. 2024 Nov 22;15(1):10116.
doi: 10.1038/s41467-024-54430-8.

BTK regulates microglial function and neuroinflammation in human stem cell models and mouse models of multiple sclerosis

Affiliations

BTK regulates microglial function and neuroinflammation in human stem cell models and mouse models of multiple sclerosis

Ross C Gruber et al. Nat Commun. .

Abstract

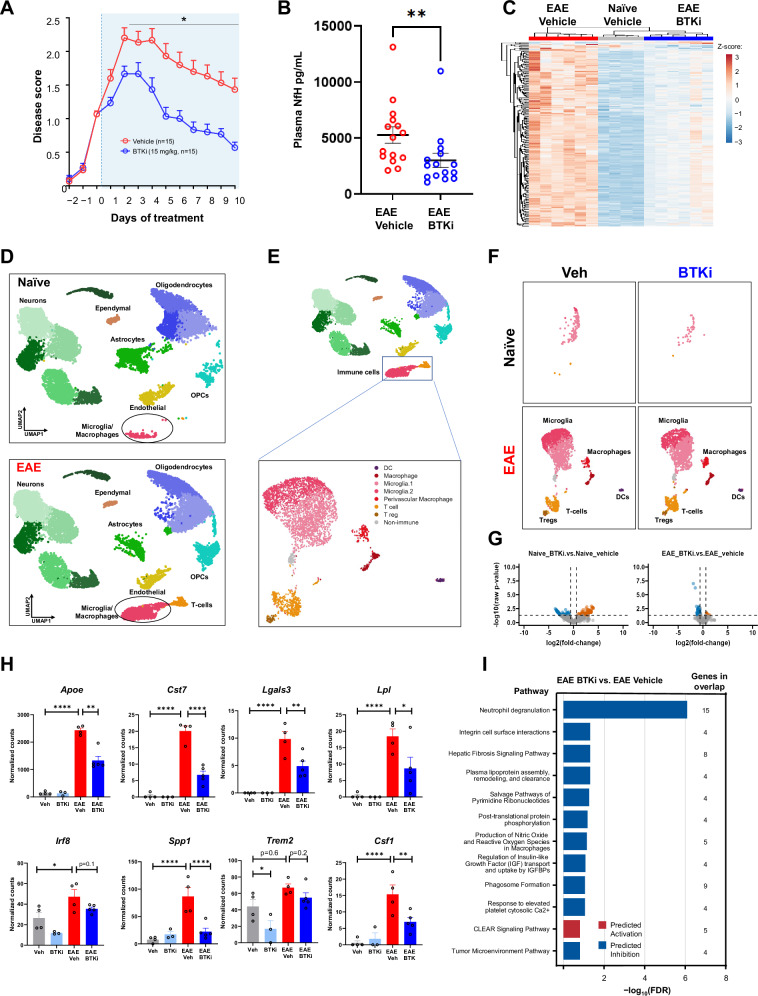
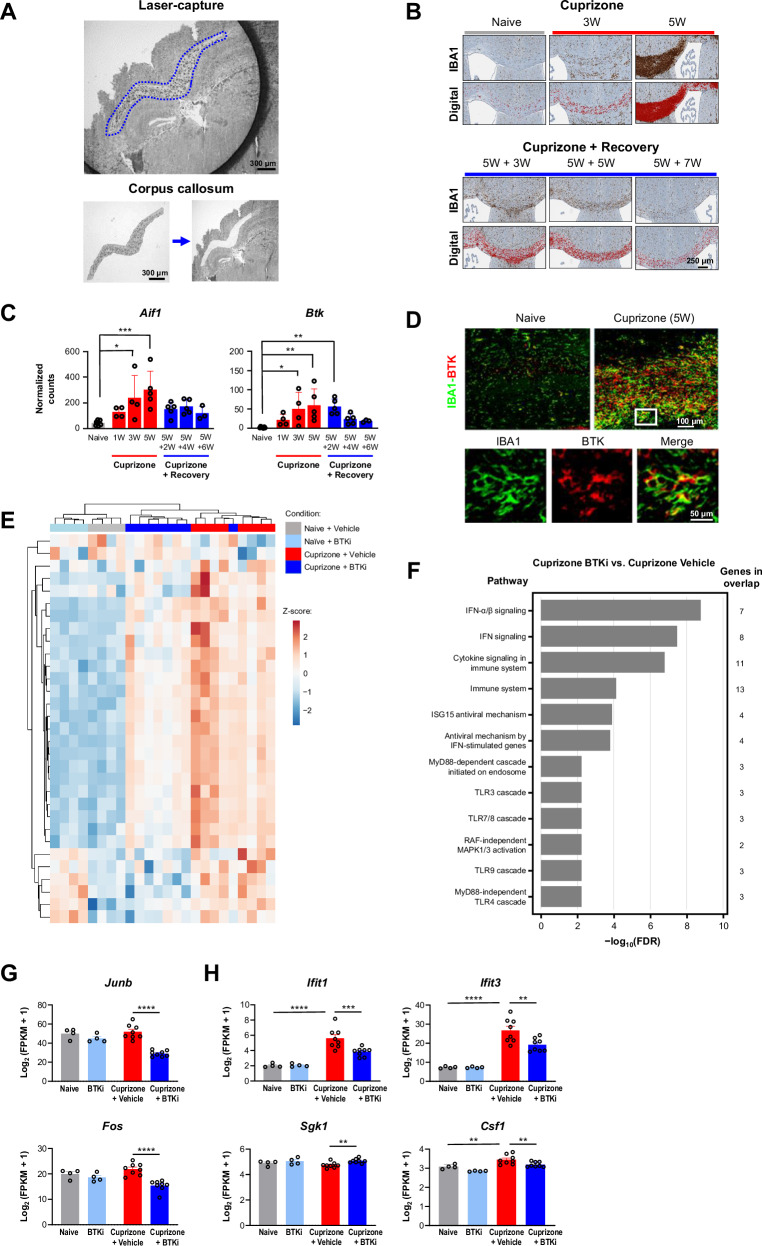
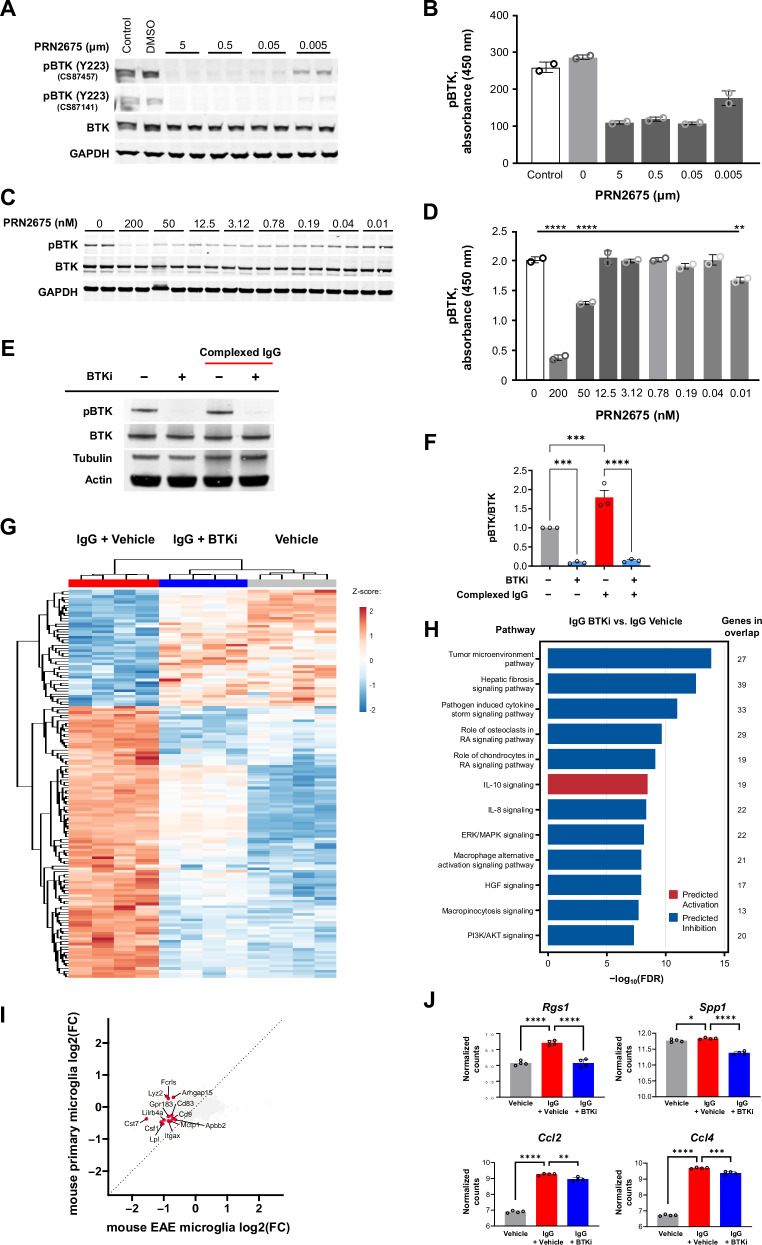
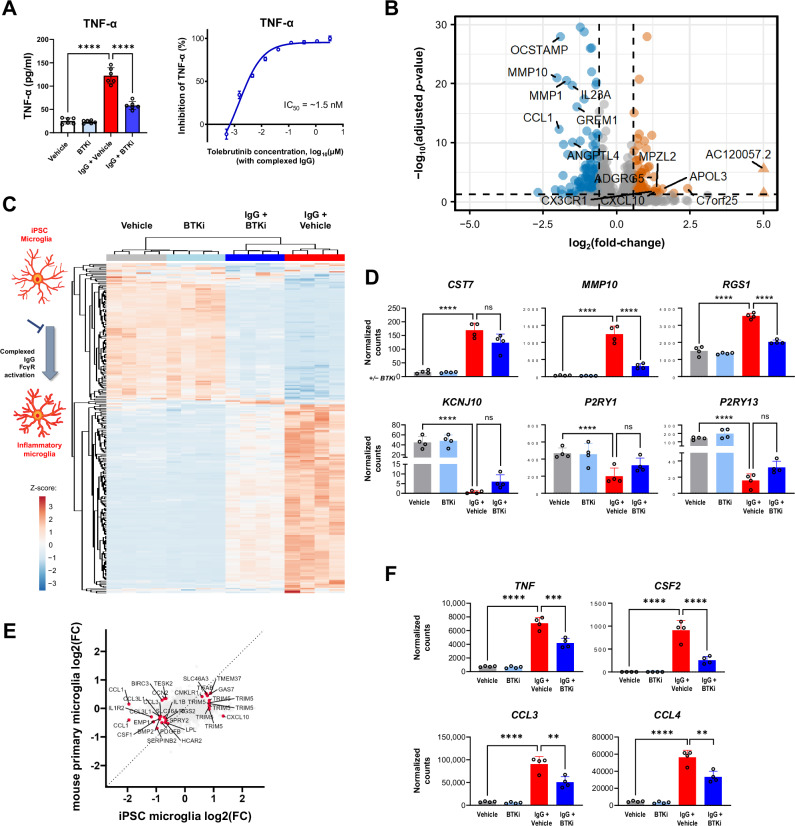
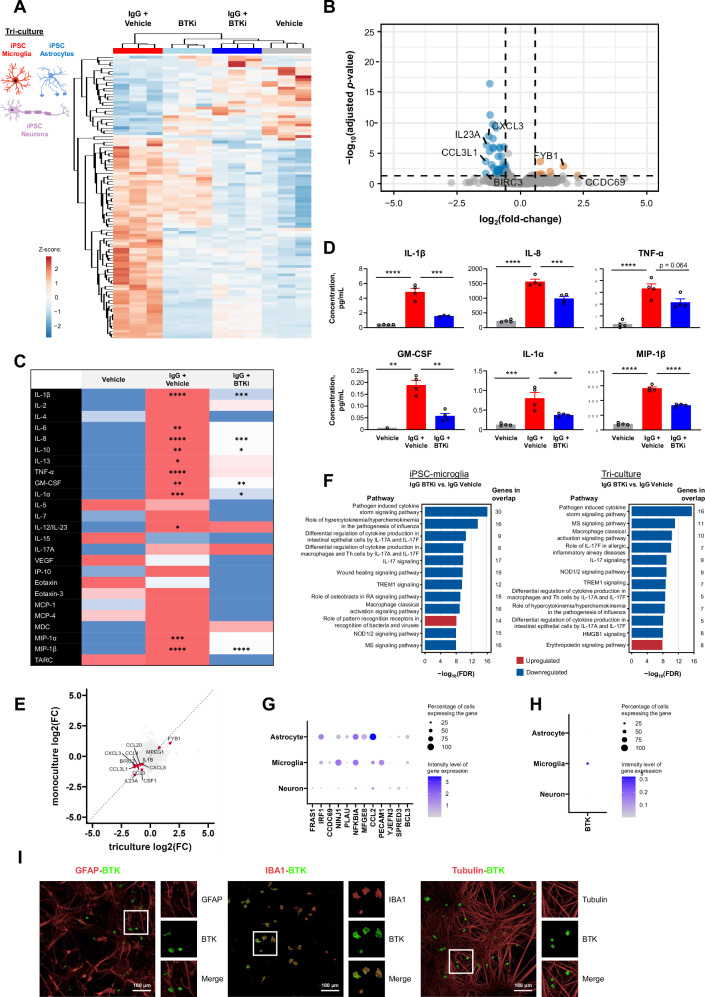
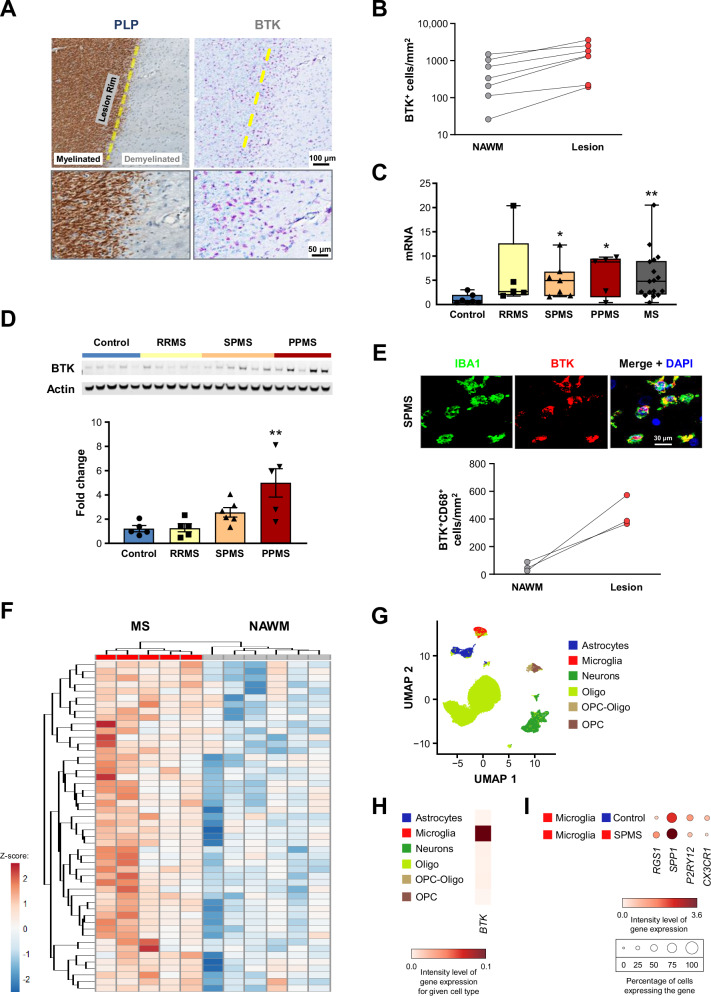
Neuroinflammation in the central nervous system (CNS), driven largely by resident phagocytes, has been proposed as a significant contributor to disability accumulation in multiple sclerosis (MS) but has not been addressed therapeutically. Bruton's tyrosine kinase (BTK) is expressed in both B-lymphocytes and innate immune cells, including microglia, where its role is poorly understood. BTK inhibition may provide therapeutic benefit within the CNS by targeting adaptive and innate immunity-mediated disease progression in MS. Using a CNS-penetrant BTK inhibitor (BTKi), we demonstrate robust in vivo effects in mouse models of MS. We further identify a BTK-dependent transcriptional signature in vitro, using the BTKi tolebrutinib, in mouse microglia, human induced pluripotent stem cell (hiPSC)-derived microglia, and a complex hiPSC-derived tri-culture system composed of neurons, astrocytes, and microglia, revealing modulation of neuroinflammatory pathways relevant to MS. Finally, we demonstrate that in MS tissue BTK is expressed in B-cells and microglia, with increased levels in lesions. Our data provide rationale for targeting BTK in the CNS to diminish neuroinflammation and disability accumulation.


Conflict of interest statement

Competing interests: R.C.G., N.C., and N.P. were employees of Sanofi when this work was undertaken. G.S.W., A.S.B., L.L., M.R.D., N.H., M.L., T.R.H., A.Che, S.R., M.Z., E.H., A.M., T.J.T., and D.O. are employees of Sanofi and may hold shares and/or stock options in the company. ACho and EC declare that they have no competing interests. B.D.T has received consulting fees, speaker honoraria, and/or research funding from Biogen, Disarm Therapeutics, EMD Serono, Novartis, Renovo Neural, and Sanofi; and principal investigator and/or speaking fees from Alkermes, Biogen, Celgene, EMD Serono, Genentech/Roche, Novartis, Sanofi, and TG Therapeutics.

Figures

Fig. 1
Fig. 1. BTK inhibition with PRN2675 in the C57BL/6 EAE mouse model of MS.
A Disease scores over time. Therapeutic treatment started once disease scores reached 1.0–1.5. B Plasma NfH concentrations at Day 10 (n = 15 mice. Shown p-value is 0.0032, calculated with a two-tailed Mann Whitney test). C Heatmap of PRN2675-dependent transcriptional signature genes. Heatmap displays DESeq2 normalized counts scaled using a Z-score. Spinal cord tissue was collected after 10 days of vehicle or PRN2675 treatment and bulk RNA-seq was performed. Differential expression analysis was performed using DESeq2. The PRN2675-dependent transcriptional signature consists of 253 genes with an absolute (fold-change) ≥1.5 and FDR ≤ 0.05 when comparing EAE +  PRN2675 to EAE + vehicle. D UMAP representation of single-nuclei RNA sequencing analysis of 52,655 cells from EAE mouse spinal cords. Clusters were identified using Seurat and several known markers for each cell type. Spinal cord tissue was collected after 8 days of vehicle or PRN2675 treatment and single-nuclei RNA-sequencing was performed. E UMAP of immune cell-type subclusters identified by sub-clustering analysis of microglia/macrophage and T-cell clusters shown in (D). F UMAP of immune cell-type clusters, as in (E), identified in naive and EAE animals, with or without PRN2675. G Pseudo-bulk analysis of microglia subclusters identified in (E) and volcano plots of differential gene expression between PRN2675-treated and untreated mouse spinal cord. Plots are shown for both naive and EAE mice. Differential expression analysis was performed using DESeq2 (absolute(fold-change) ≥1.5 and raw p-value ≤ 0.05). H DESeq2 normalized counts of disease-associated microglial genes, identified in (G). Shown p-values are unadjusted and were calculated using Wald significance test implemented in DESeq2 (n = 3–5 mice). P-values are available in the Source Data file. I Pathway analysis using IPA: EAE + PRN2675 vs EAE + vehicle. The 12 pathways that demonstrated the largest change (−log10(FDR)) and showed direction (i.e., had a z-score available) are presented. All 12 pathways shown were downregulated with EAE + PRN2675 vs EAE+ vehicle. The pathway analysis gene list is the PRN2675-dependent transcriptional signature identified in the right plot of panel G. P-values are indicated by * ≤ 0.05, ** ≤ 0.01, *** ≤ 0.001, and **** ≤ 0.0001. Data are presented as mean values ± SEM. Source data are provided as a Source Data file.
Fig. 2
Fig. 2. BTKi in a cuprizone mouse model of demyelination.
A Isolation of corpus callosum from mouse brain using laser-capture microdissection. B Immunostaining for microglial/macrophage marker IBA1 was used to generate a digital signal in HALO. This experiment was reproduced twice with similar results. C DESeq2 normalized counts for the Btk gene and the microglia/macrophage marker gene Aif1 during cuprizone treatment and subsequent recovery (n = 3–7 mice). P-values for Aif1: naive vs. 3W and 5W are 0.012 and 0.0003, respectively. P-values for Btk: naive vs. 3W, 5W, and 5W + 2W are 0.0252, 0.0029, and 0.0053, respectively. D Fluorescent immunostaining for BTK and IBA1. Mouse BTK histology was the result of many experiments to determine optimal antibodies and concentrations to selectively stain for BTK+ cells. E Heatmap of PRN2675-reversed transcriptional signature genes. Heatmap displays log2(FPKM + 1) data scaled using a Z-score. Differential expression analysis was performed in Array Studio using a general linear model. The PRN2675-reversed transcriptional signature consists of 31 differentially expressed genes (absolute(fold-change) ≥ 1.2 and p-value ≤ 0.05) in Cuprizone + Vehicle vs Naive + Vehicle that were reversed in Cuprizone + PRN2675 vs Cuprizone + Vehicle. F Pathway analysis of genes identified in panel E, performed using EnrichR tool based on 2022 Reactome Database. The pathway analysis gene list is the PRN2675-dependent transcriptional signature identified in panel (E). G Expression of the Junb and Fos transcription factor genes quantified as log2(FPKM + 1). Shown p-values were calculated using Array Studio (n = 4–8 mice). P-values are available in the Source Data file. H Expression of the Ifit1,Ifit3, Sgk1, and Csf1 genes quantified as log2(FPKM + 1). Shown p-values were calculated using Array Studio (n = 4–8 mice). P-values are available in the Source Data file. P-values are indicated by * ≤ 0.05, ** ≤ 0.01, *** ≤ 0.001, and **** ≤ 0.0001. Data are presented as mean values ± SEM. BTK Bruton’s tyrosine kinase, BTKi BTK inhibitor, FDR false discovery rate, FPKM fragments per kilobase of transcript per million mapped reads, IBA1 ionized calcium binding adapter molecule 1, IFN interferon, MAPK mitogen-activated protein kinase, RAF rapidly accelerated fibrosarcoma kinase, W week mitogen-activated protein kinase, RAF rapidly accelerated fibrosarcoma kinase, W week. Source data are provided as a Source Data file.
Fig. 3
Fig. 3. Activation of BTK and identification of a BTK-dependent transcriptional signature in mouse microglia.
Effect of the irreversible BTKi PRN2675 on BTK autophosphorylation in the BV-2 mouse microglial cell line, assessed by Western blot (A) and ELISA (B) (n = 2 technical replicates for (B)). Effect of PRN2675 on BTK phosphorylation in primary mouse microglia, assessed by Western blot (C) and ELISA (D). P-values were calculated using two-way ANOVA with post hoc Sidak test. P values shown in (D) for PRN2675 0 vs. 200, 50, and 0.01 nM are <0.0001, <0.0001, and 0.0036, respectively (n = 2 technical replicates for (D)). E BTK enzyme activity in primary mouse microglia, with or without complexed mouse IgG stimulation or tolebrutinib, assessed by Western blot. F Effect of the irreversible BTKi tolebrutinib on the pBTK-to-BTK ratio in primary mouse microglia, with or without complexed mouse IgG stimulation, quantified by Western blot, as exampled in (E). Shown p-values were calculated using one-way ANOVA with post hoc Sidak test. P-values for Control vs. BTKi, Control vs. IgG, and IgG vs. IgG+BTKi are 0.0004, 0.001, and <0.0001, respectively (n = 3 separate experiments). G Heatmap of tolebrutinib-reversed transcriptional signature genes in primary mouse microglia. Heatmap displays log2(FPKM+1) data scaled using a Z-score. Differential expression analysis was performed in Array Studio using a general linear model. The tolebrutinib-reversed transcriptional signature consists of 144 differentially expressed genes (absolute (fold-change) ≥1.2 and p value ≤ 0.05) in IgG + tolebrutinib vs IgG + Vehicle that was reversed in IgG + Vehicle vs Vehicle. H Pathway analysis using IPA for IgG + tolebrutinib vs. IgG. H The 12 pathways that were most significantly impacted (−log10(FDR)) and showed direction (i.e., negative z-score [predicted inhibition] or positive z-score [predicted activation]) are presented. The pathway analysis gene list is the tolebrutinib-dependent transcriptional signature identified in (G). I Four-way plot of EAE pseudo-bulk microglia differential expression results for EAE+PRN2675 vs EAE + vehicle (Fig. 1G, right) and primary mouse microglia differential expression results for IgG + tolebrutinib vs IgG (Fig. 3G). Labeled genes were commonly significantly differentially expressed genes between the two analyses (for EAE, absolute(fold-change) ≥1.5 and raw p value ≤ 0.05; for mouse microglia, absolute(fold-change) ≥ 1.2 and p value ≤ 0.05). J Expression of immune-associated gene targets for which expression was partially altered with tolebrutinib, quantified as log2(FPKM+1). Shown p-values were calculated using Array Studio (n = 4 technical replicates). P-values are available in the Source Data file. P-values are indicated by * ≤ 0.05, ** ≤ 0.01, *** ≤ 0.001, and **** ≤ 0.0001. Data are presented as mean values ± SEM. AKT protein kinase B, BTK Bruton’s tyrosine kinase, BTKi BTK inhibitor, DMSO dimethyl sulfoxide, ELISA enzyme-linked immunosorbent assay, ERK extracellular signal-regulated kinase, GAPDH glyceraldehyde 3-phosphate dehydrogenase, HGF hepatocyte growth factor, IgG immunoglobulin G, IL interleukin, IPA ingenuity pathway analysis, MAPK mitogen-activated protein kinase, pBTK phosphorylated BTK, PI3K phosphatidylinositol 3-kinase, RA rheumatoid arthritis. Source data are provided as a Source Data file.
Fig. 4
Fig. 4. Identification of a BTK-dependent transcriptional signature in human iPSC-derived microglia.
A Effect of tolebrutinib on TNF-α secretion in human iPSC-derived microglia, 24 h after complexed IgG stimulation (10 μg/mL Fc OxyBURST™; Invitrogen, F2902). Shown p-values were <0.0001 and calculated using one-way ANOVA with post hoc Sidak test (left panel n = 6 technical replicates, right panel n = 3–6 technical replicates). B Volcano plot of differential expression between tolebrutinib-treated and untreated hiPSC-derived microglia, 6 h after complexed IgG stimulation. Differential expression analysis was performed using DESeq2. 250 genes were observed to be differentially expressed in the IgG + tolebrutinib condition (absolute(fold-change) ≥1.5 and FDR ≤ 0.05). The 14 most strongly up- and down-regulated genes (as ranked by log2(fold-change)) are labeled (Wald significance test implemented in DESeq2). C Heatmap of the 250 tolebrutinib-specific transcriptomic signature identified in (B). Heatmap displays DESeq2 normalized counts scaled using a Z-score. D Effect of tolebrutinib 100 nM on expression levels of the CST7, MMP10, and RGS1 genes, which were induced by complexed IgG, and the KCN1J10, P2RY1, and P2RY13 genes, which were inhibited in response to complexed IgG. DESeq2 normalized counts are shown, with FDR-corrected p-values generated using DESeq2 (Wald significance test implemented in DESeq2, n = 4 technical replicates). P-values are available in the Source Data file. E Four-way plot of hiPSC-derived microglia differential expression results for IgG + tolebrutinib vs IgG (Fig. 4B) and primary mouse microglia differential expression results for IgG + tolebrutinib vs IgG (Fig. 3G). Labeled genes were significantly differentially expressed genes in common between the two analyses (for hiPSC-derived microglia, absolute(fold-change) ≥1.5 and FDR ≤ 0.05; for mouse microglia, absolute(fold-change) ≥1.2 and p value ≤ 0.05) (Wald significance test implemented in DESeq2). F DESeq2 normalized counts of genes encoding proinflammatory cytokines and chemokines in hiPSC-derived microglia. Shown p-values are FDR-corrected and were calculated using DESeq2 (Wald significance test implemented in DESeq2, n = 4 technical replicates). P-values are available in the Source Data file. P-values are indicated by * ≤ 0.05, ** ≤ 0.01, *** ≤ 0.001, and **** ≤ 0.0001. Data are presented as mean values ± SEM. BTK Bruton’s tyrosine kinase, IC50 half-maximal inhibitory concentration, hiPSC human induced pluripotent stem cell, IgG immunoglobulin G, mus. mouse, ns non-significant, TNF-α tumor necrosis factor-alpha. Source data are provided as a Source Data file.
Fig. 5
Fig. 5. Identification of a BTK-dependent transcriptional signature in a human iPSC-derived tri-culture of microglia, astrocytes, and neurons.
A, B Tolebrutinib-specific transcriptomic signature in human tri-culture, 6 h after complexed IgG stimulation (10 μg/mL Fc OxyBURST™; Invitrogen, F2902). Heatmap of DESeq2 normalized counts scaled using a Z-score for the top 100 differentially expressed genes between IgG + tolebrutinib and IgG + vehicle, as ranked by p-value (A). Volcano plot of differential expression between IgG + tolebrutinib and IgG + vehicle. Differential expression analysis was performed using DESeq2. 396 genes were observed to be differentially regulated in the IgG + tolebrutinib condition (absolute(fold-change) ≥1.5 and FDR ≤ 0.05) (Wald significance test implemented in DESeq2). The 14 most strongly up- and down-regulated genes (as ranked by log2(fold-change)) are labeled (B). C Effect of tolebrutinib on cytokine and chemokine secretion in human tri-culture, 24 h after IgG stimulation, as assessed using multiplex panels. Comparisons are for IgG + vehicle vs. vehicle, and for IgG + tolebrutinib vs. IgG + vehicle. Shown p-values were calculated using one-way ANOVA with post hoc Sidak test. D Cytokine and chemokine secretion: analytes that were induced by IgG and blocked by tolebrutinib, significance indicated in (C) (n = 1–4 technical replicates). E Four-way plot of triculture differential expression results for IgG + tolebrutinib vs IgG (Fig. 5B) and hiPSC-derived microglia monoculture differential expression results for IgG + tolebrutinib vs IgG (Fig. 4B). Labeled genes were commonly significantly differentially expressed genes between the two analyses (for triculture, absolute(fold-change) ≥1.5 and FDR ≤ 0.05; for monoculture, absolute(fold-change) ≥1.5 and FDR ≤ 0.05). F IPA pathway analysis for the IgG + olebrutinib vs IgG comparison in human hiPSC-derived microglia, left, and human tri-culture, right. The 12 pathways that had the strongest significance levels (−log10(FDR)) and showed direction (negative z-score [predicted inhibition] or positive z-score [predicted activation]) are presented. The pathway analysis gene list for hiPSC-derived microglia is the tolebrutinib-dependent transcriptional signature identified in Fig. 4B. The gene list for tri-cultures is the tolebrutinib-dependent transcriptional signature identified in Fig. 5B. G Expression of BTK-regulated gene targets in the tri-culture. H Cellular enrichment of BTK expression in the tri-culture, with BTK transcripts identified in 30.5, 0.9, and 0.9 percent of microglia, astrocytes, and neurons, respectively, with Seurat normalized average expression levels of 0.376, 0.004, and 0.007. I Fluorescent immunostaining for markers of astrocytes (GFAP), microglia (IBA1), and neurons (beta-III tubulin) in the tri-culture. This experiment was reproduced twice with similar results. P-values are indicated by * ≤ 0.05, ** ≤ 0.01, *** ≤ 0.001, and **** ≤ 0.0001. Data are presented as mean values ± SEM. BTK Bruton’s tyrosine kinase, FDR false discovery rate, GFAP glial fibrillary acidic protein, GM-CSF granulocyte-macrophage colony-stimulating factor, HMGB1 high mobility group box 1, IBA1 ionized calcium-binding adapter molecule 1, IgG immunoglobulin G, IL interleukin, IP-10 interferon gamma-induced protein 10, IPA ingenuity pathway analysis, hiPSC human induced pluripotent stem cell, MCP monocyte chemoattractant protein, MDC macrophage-derived chemokine, MIP macrophage inflammatory protein, MS multiple sclerosis, NOD nucleotide oligomerization domain, RA rheumatoid arthritis, TARC thymus and activated-regulated chemokine, Th T helper, TNF tumor necrosis factor, VEGF vascular endothelial growth factor. Source data are provided as a Source Data file.
Fig. 6
Fig. 6. BTK expression in microglia/macrophages within lesion tissue from PMS patients.
A Immunohistochemistry analysis for myelin PLP and BTK in post-mortem brain tissue from a PMS patient. BTK-positive cells colocalized with an IBA1-positive rim around white matter lesions. Human BTK histology was the result of many experiments to determine optimal antibodies and concentrations to selectively stain for BTK+ cells. B BTK positivity in demyelinated regions compared with NAWM (n = 7 patients). BTK mRNA expression (C) and protein levels (D; assessed by Western blot) in post-mortem bulk brain tissue samples from controls and MS patients (either grouped by individual MS subtype or as all MS combined). P-values were calculated using one-way ANOVA with post hoc Dunnett test for (D). The p-values shown in (C) from left to right are 0.021, 0.023, and 0.008 and in (D) is 0.0019. (N = 5–18 and 5–6 patients for (C) and (D), respectively). Whiskers in (C) denote minimum and maximum values. E Co-immunostaining for BTK and microglia/macrophages, using anti-IBA antibody (for visualization) or anti-CD68 antibody (for quantification in lesion tissue compared with NAWM, where n = 3 patients). F Hierarchical clustering of PMS patient lesion samples from NAWM samples using the BTK-reversed signature identified in human iPSC-derived microglia. Heatmap displays log2(FPKM + 1) data scaled using a Z-score. Differential expression analysis was performed in Array Studio using a general linear model. The tolebrutinib-reversed transcriptional signature consists of 144 differentially expressed genes (absolute(fold-change) ≥1.2 and p-value ≤ 0.05) in IgG + tolebrutinib vs IgG + Vehicle that were reversed in IgG + Vehicle vs Vehicle. G, H Cellular enrichment of BTK mRNA expression in brain samples from PMS patients, including t-SNE analysis (H). I Expression of BTK-regulated gene targets in brain samples from controls and SPMS patients. P-values are indicated by * ≤ 0.05, ** ≤ 0.01, *** ≤0 .001, and **** ≤ 0.0001. Data are presented as mean values ± SEM. BTK Bruton’s tyrosine kinase, CD68 cluster of differentiation 68, DAPI = 4′,6-diamidino-2-phenylindole, IBA1 ionized calcium-binding adapter molecule 1, MS multiple sclerosis, NAWM normal-appearing white matter, Oligo oligodendrocyte, OPC oligodendrocyte progenitor cell, PLP proteolipid protein, PMS progressive MS, PPMS primary PMS, RRMS relapsing-remitting MS, SPMS secondary PMS. Source data are provided as a Source Data file.

References

    1. Baecher-Allan, C., Kaskow, B. J. & Weiner, H. L. Multiple sclerosis: mechanisms and immunotherapy. Neuron97, 742–768 (2018). - PubMed
    1. Kappos, L. et al. Contribution of relapse-independent progression vs relapse-associated worsening to overall confirmed disability accumulation in typical relapsing multiple sclerosis in a pooled analysis of 2 randomized clinical trials. JAMA Neurol.77, 1132–1140 (2020). - PMC - PubMed
    1. Hauser, S. L. et al. Ofatumumab versus teriflunomide in multiple sclerosis. N. Engl. J. Med.383, 546–557 (2020). - PubMed
    1. Hauser, S. L. et al. Ocrelizumab versus interferon beta-1a in relapsing multiple sclerosis. N. Engl. J. Med.376, 221–234 (2017). - PubMed
    1. Guerrero, B. L. & Sicotte, N. L. Microglia in multiple sclerosis: friend or foe? Front. Immunol.11, 374 (2020). - PMC - PubMed

Publication types

MeSH terms

Substances

Associated data

LinkOut - more resources