

Orbital computed tomography imaging characteristics of thyroid-associated ophthalmopathy
- PMID: 39578469
- PMCID: PMC11584846
- DOI: 10.1038/s41598-024-76624-2
Orbital computed tomography imaging characteristics of thyroid-associated ophthalmopathy
Abstract
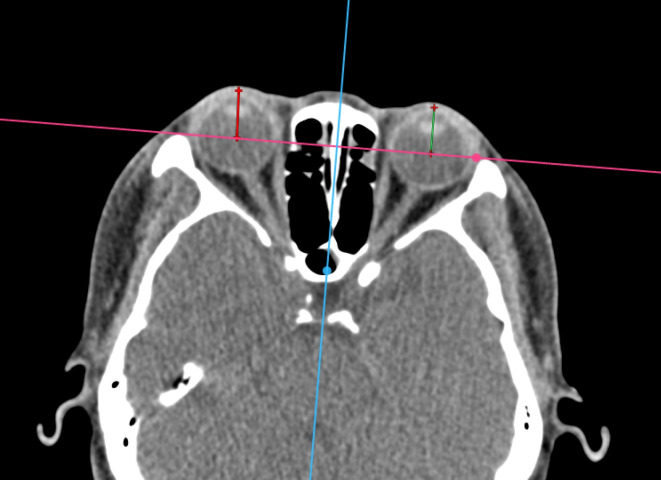
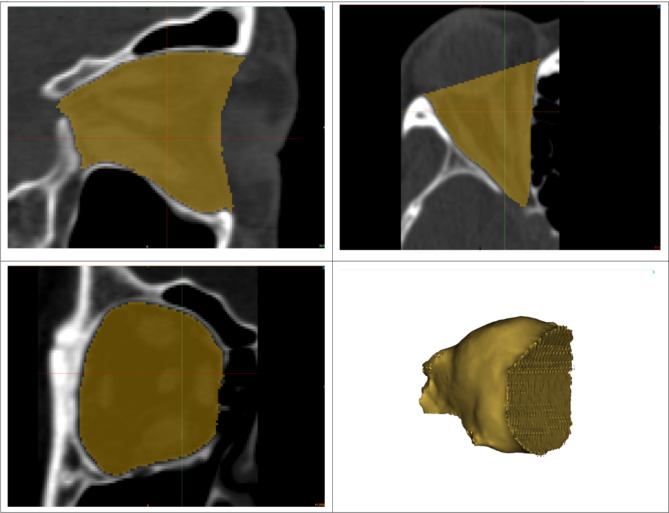
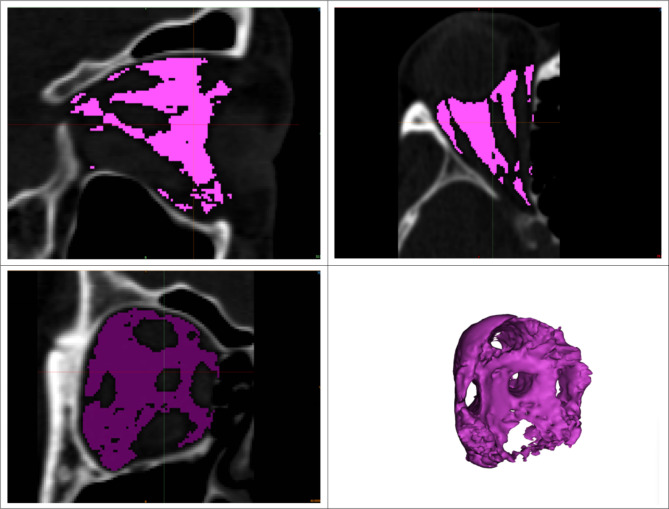
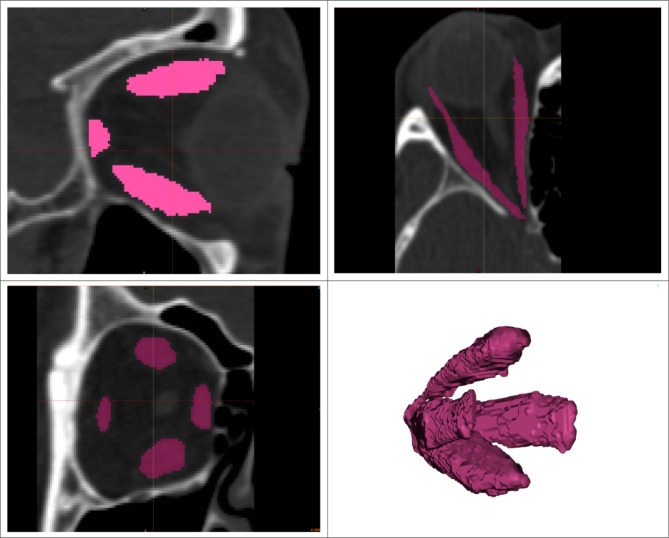
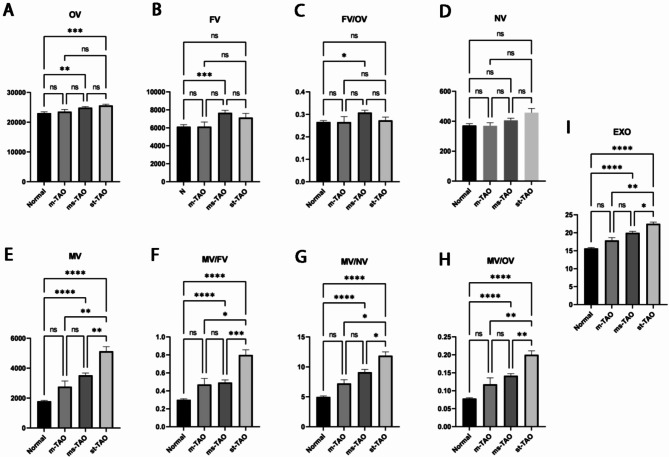
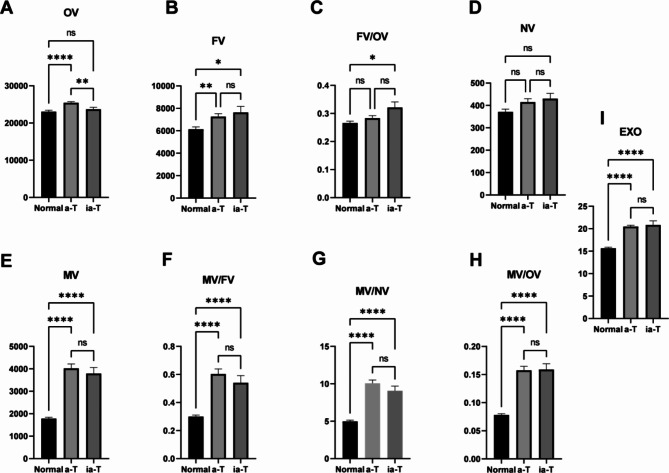
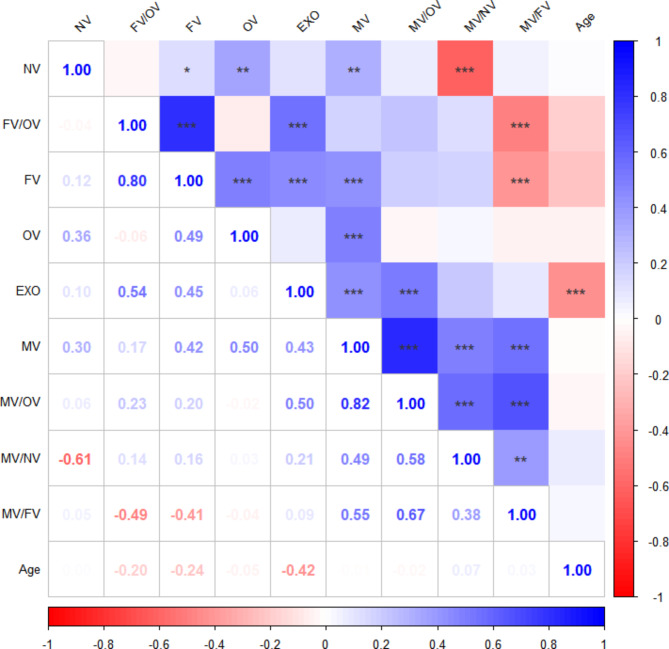
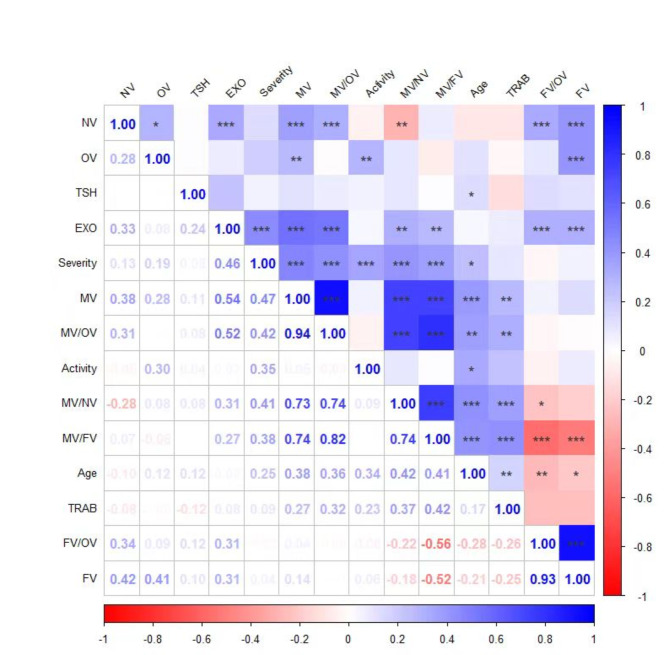
This study aims to investigate the distribution characteristics and correlations of orbital soft tissue volume expansion in patients with thyroid-associated ophthalmopathy (TAO) by analyzing orbital computed tomography (CT) data and to determine the most appropriate parameters and corresponding cut-off values for imaging classification. Patients with TAO who met the inclusion and exclusion criteria, along with those with lacrimal duct obstruction requiring orbital CT examination, were included in the study. Raw CT data were imported into Mimics and RadiAnt software for analysis, and measurements of orbital volume, orbital fat volume, extraocular muscle volume, optic nerve volume, and exophthalmos were obtained. The results demonstrated that the combination of Mimics and other softwares for processing orbital CT scans allows for the quantitative analysis of various soft tissue volumes within the orbit. The MV/FV ratio was found to effectively reflect the relative changes in extraocular muscle volume, serving as a valuable indicator for identifying different subtypes of TAO and providing significant clinical reference value.
Keywords: Computerized tomography; Three-dimensional reconstruction; Thyroid associated ophthalmopathy.
© 2024. The Author(s).
Conflict of interest statement
Declarations. Competing interests: The authors declare no competing interests. Ethics approval and consent to participate: Ethical approval for this trial was obtained from the Ethics Committee of the Affiliated Eye Hospital of Nanchang University (Ethics Approval number: YLP20231051). All participants were asked to complete a written consent form before beginning the program. Consent for publication: Written informed consent was obtained from the person for publication of his accompanying images in this manuscript.
Figures

References
-
- Regensburg, N. I. et al. A new and validated CT-based method for the calculation of orbital soft tissue volumes. Invest. Ophthalmol. Vis. Sci.49, 1758–1762 (2008). - PubMed
-
- Chinese guideline on the diagnosis and treatment of thyroid-associated ophthalmopathy. Zhonghua Yan Ke Za Zhi58, 646–668 (2022). - PubMed
-
- Bartalena, L. et al. The 2021 European Group on Graves’ orbitopathy (EUGOGO) clinical practice guidelines for the medical management of Graves’ orbitopathy. Eur. J. Endocrinol.185, G43–G67 (2021). - PubMed
-
- Ozgen, A. et al. Quantitative CT of the orbit in Graves’ disease. Br. J. Radiol.72, 757–762 (1999). - PubMed
MeSH terms
Grants and funding
LinkOut - more resources
Full Text Sources
Medical
Miscellaneous
