. 2024 Nov 23;15(1):10155.
doi: 10.1038/s41467-024-54505-6.

Lysosomal "TRAP": a neotype modality for clearance of viruses and variants

Affiliations

Lysosomal "TRAP": a neotype modality for clearance of viruses and variants

Chengliang Lyu et al. Nat Commun. .

Abstract

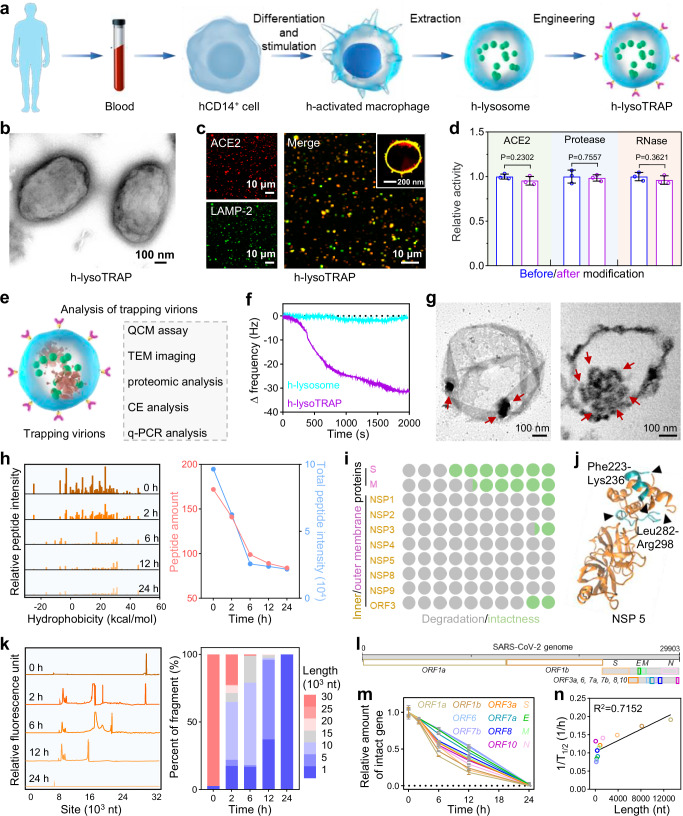
The binding of viruses to host-entry factor receptors is an essential step for viral infection. Many studies have shown that macrophages can internalize viruses and degrade them in lysosomes for clearance in vivo. Inspired by these natural behaviors and using SARS-CoV-2 as a testbed, we harvest lysosomes from activated macrophages and anchor the protein-receptor ACE2 as bait, thus constructing a lysosomal "TRAP" (lysoTRAP) that selectively captures, internalizes, and eventually degrades SARS-CoV-2. Through experiments with cells, female mice, female hamsters, and human lung organoids, we demonstrate that lysoTRAP effectively clears SARS-CoV-2. Importantly, unlike therapeutic agents targeting SARS-CoV-2 spike protein, lysoTRAP remains effective against nine pseudotyped variants and the authentic Omicron variant, demonstrating its resistance to SARS-CoV-2 mutations. In addition to the protein-receptor ACE2, we also extend lysoTRAP with the saccharide-receptor sialic acid and verify its excellent antiviral effect against H1N1, highlighting the flexibility of our "TRAP" platform in fighting against various viruses.


Conflict of interest statement

Competing interests: The authors declare no competing interests.

Figures

Fig. 1
Fig. 1. Construction and characterizations of lysoTRAP.
a Schematic for lysosome purification. Primary macrophages were stimulated with lipopolysaccharides (LPS) to generate activated macrophages, which was followed by the isolation of lysosomes via physical disruption and differential centrifugation. b Transmission electron microscopy (TEM) images of the lysosomes isolated from macrophages stimulated with LPS (LPS+) or without LPS (LPS-). c Protein levels of the lysosomes (same number) isolated from macrophages stimulated with or without LPS, showing increased protein levels following LPS stimulation. d Proteomic analysis of hydrolase levels in the lysosomes from macrophages stimulated with or without LPS via liquid chromatography–mass spectrometry (LC-MS). Relative ratio was normalized according to the LPS- group. e Levels of representative hydrolases in lysosomes based on proteomic data. Protein value was derived from LC-MS data and the relative ratio was normalized according to the LPS- group. f Theoretical analysis of enzymatic cleavage sites of SARS-CoV-2 (wild-type) representative proteins and genes according to the enzymatic mechanisms of proteases and RNases inside lysosomes. g Schematic for construction of lysoTRAP. An amphiphilic compound-DSPE-PEG-NTA-Ni was inserted into the membrane of the lysosomes, followed by anchoring ACE2-His tag fusion protein through NTA-Ni/His affinity, thus creating our “lysoTRAP”. h Confocal laser scanning microscopy (CLSM) images and inserted stimulated emission depletion microscopy (STED) images of naked lysosomes and lysoTRAP, showing successful anchorage of ACE2 to the lysoTRAP membrane. i Enzymatic activities of ACE2 before and after ACE2 anchorage to lysosome. j Physical stability of lysoTRAP over a 72-hour incubation in phosphate buffered saline (PBS) at 37 °C, detected by the size and zeta potential. k Biological stability of lysoTRAP over a 72-hour incubation in PBS at 37 °C, detected by the enzymatic activities of ACE2, total proteases and RNases. l Physical stability of lysoTRAP before and after lyophilization and rehydration (Lyo/Reh). m Biological stability of ACE2, total protease and RNase in the lysoTRAP before and after Lyo/Reh. The data in c, i, j, k, and m represent the mean ± S.D. (n = 3 biologically independent experiments). Statistical significance was calculated using two-tailed unpaired t-test in c, i, k, and m. Source data were provided in the Source data file.
Fig. 2
Fig. 2. Evaluations of programmed performance of lysoTRAP in capturing, internalizing, and degrading pseudotyped SARS-CoV-2 virions, causing efficient inhibition of viral infection.
a Schematic for showing the designed SARS-CoV-2 clearance mechanism by lysoTRAP. b Schematic illustration for quartz crystal microbalance (QCM) experiment. Corresponding QCM curves and the change of the frequency of each group were displayed on the right panels. c CLSM images of Cy5-labeled lysoTRAP co-incubated with BODIPY-labeled pseudotyped virions, showing the process of pseudotyped virion internalization by lysoTRAP. d STED image showing a high magnification of Cy5-labeled lysoTRAP with internalized BODIPY-labeled pseudotyped virions after a 4-hour co-incubation. Corresponding TEM imaging and TEM section observation were displayed on the right panels. The internalized pseudotyped virions were indicated by red arrows in lysoTRAP. e Enzyme-linked immunosorbent assay (ELISA) measurement of viral protein levels (P55 and P24: structural proteins in the pseudotyped virions) after lysoTRAP or PBS incubation for indicated time points. Corresponding western blotting (WB) results of the 24-hour incubated sample were displayed on the right panel. f Quantitative polymerase chain reaction (q-PCR) analysis of viral RNA levels (GFP and Luc) after incubating with lysoTRAP or PBS for indicated time points. Corresponding agarose gel electrophoresis results of the 24-hour incubated sample were displayed on the right panel. g CLSM images of viral infection in ACE2-OE HEK293T cells and corresponding flow cytometry analysis. Both CLSM and flow cytometry analysis were assessed based on the GFP expression. In the infection assays, virions and lysoTRAP (PBS, lysosome or ACE2) were cultured with host cells at the same time. h Infection assays using additional pseudotyped virions carrying the S protein mutations (each with a Luc reporter to support quantification). The variants included the D614G strain, three variants of interest (VOI) and five variants of concern (VOC). The data in b, e, f, g, and h represent the mean ± S.D. (n = 3 biologically independent experiments). Statistical significance was calculated using a two-tailed one-way ANOVA with multiple comparison tests in b and g, and two-tailed unpaired t-test in h. Source data were provided in the Source data file.
Fig. 3
Fig. 3. In vivo biodistribution and trapping of lysoTRAP.
a Schematic for the administration of Cyanine 7 (Cy7)-labeled lysoTRAP via pulmonary inhalation or intravenous (i.v.) injection and corresponding in vivo real-time fluorescence images of mice. b Corresponding signal profiles of lysoTRAP in a and corresponding area under the curve (AUC) calculation, showing the superior bioavailability of lysoTRAP in lungs via pulmonary inhalation. c Mean fluorescence intensity (MFI) statistics of the major organs dissected from C57BL/6 mice 9 h after the administration, and corresponding proportion of the lysoTRAP accumulation in lungs. d 3D reconstructed light-sheet microscopic image of a lung dissected from a mouse 24 h after pulmonary inhalation of Cyanine 5 (Cy5)-labeled lysoTRAP. The tracheas were labeled with streptavidin-fluorescein isothiocyanate (FITC). e H&E images of lung tissue sections after pulmonary inhalation of lysoTRAP or PBS. f Analysis of IFN-γ level in the supernatant of lung homogenate after pulmonary inhalation of lysoTRAP or PBS. g The evaluation of lung respiratory function after pulmonary inhalation of lysoTRAP or PBS, assessed as the tidal volume (the volume of air inhaled or exhaled per breath) (the blue background presents the normal range.) h Schematic for the detection of in vivo trapping SARS-CoV-2 pseudotyped virions by lysoTRAP in C57BL/6 mice. i Representative CLSM images of pseudotyped virion distribution in the lungs at 24 h of post-administration and corresponding quantitative analysis of fluorescence intensity (FI) alongside the white dotted line. j WB analysis of viral protein components (P55 and P24) in the lungs, showing the efficient protein degradation by h-lysoTRAP. k q-PCR analysis of viral RNA levels (GFP) in lungs. The data in b, c, f, g, and k represent the mean ± S.D. (n = 3 biologically independent mice). Statistical significance was calculated using two-tailed unpaired t-test in b and c, and two-tailed one-way ANOVA with multiple comparison test in k. Source data were provided in the Source data file.
Fig. 4
Fig. 4. In vivo clearance of pseudotyped and authentic SARS-CoV-2 by lysoTRAP.
a Schematic for the detection of in vivo clearance of pseudotyped virions by lysoTRAP in the hACE2 C57BL/6 mouse model. b Ex vivo imaging of pseudotyped virion (wild-type) GFP expression (inserted at the top of panel) and corresponding quantitative analysis of GFP fluorescence signals in the lungs dissected from hACE2 C57BL/6 mice after viral inoculation and administration with different treatments. c Representative fluorescence images of pseudotyped virion (wild-type) GFP expression in the lung slides and corresponding quantification analysis of the GFP signals. d, e Similar data as that presented in b,c following infection with the Omicron variant of pseudotyped virions. f Schematic for the detection of in vivo clearance of authentic SARS-CoV-2 by lysoTRAP in the hamster model. g q-PCR analysis of wild-type SARS-CoV-2 RNA copies in lungs at 3 d. h Representative immunofluorescent images of S expression in the lung tissues at 3 d. i Representative hematoxylin and eosin (H&E) images of the lung tissues at 3 d. The lungs in the PBS group showed abundant infection symptoms (alveolar septal thickening and inflammatory cell infiltration), while those symptoms were almost disappeared in lysoTRAP group. j Analysis of inflammatory cytokine (interleukin 6 (IL-6) and tumor necrosis factor (TNF)) mRNA levels in the supernatant of lung homogenate at 3 d via q-PCR detection. Actin was used as the housekeeping gene, and relative gene expression was normalized to the PBS group. k–n Similar data as that presented in gj following infection with Omicron variant. The data in b, c, d, and e, represent the mean ± S.D. (n = 3 biologically independent mice). The data in g, j, k, and n represent the mean ± S.D. (n = 5 biologically independent hamsters). Statistical significance was calculated using two-tailed one-way ANOVA with multiple comparison test in b, c, d, and e, and two-tailed unpaired t-test in g, j, k, and n, respectively. Source data were provided in the Source data file.
Fig. 5
Fig. 5. Construction of human lysoTRAP and the performance of trapping authentic SARS-CoV-2 in vitro.
a Schematic for the construction of human lysoTRAP (h-lysoTRAP). b TEM image of h-lysoTRAP. c CLSM and STED images (inserted at the upper right corner) of h-lysoTRAP, showing the successful anchorage of ACE2 to the h-lysoTRAP membrane. d Enzymatic activities of ACE2, proteases and RNases in lysosomes before and after ACE2 anchorage to h-lysosomes. e Schematic for trapping SARS-CoV-2 by h-lysoTRAP and corresponding investigation methods, including QCM assay, TEM imaging, proteomic analysis, capillary electrophoresis (CE) analysis and q-PCR analysis. f QCM analysis of the interaction between authentic SARS-CoV-2 virions (wild-type) and h-lysoTRAP (h-lysosomes). g TEM imaging and corresponding TEM section observation of h-lysoTRAP after a 4-hour co-incubation with SARS-CoV-2 virions. The internalized virions were indicated by red arrows in h-lysoTRAP. h Peptide fingerprints of SARS-CoV-2 proteins identified by LC-MS after h-lysoTRAP incubation for indicated time points. The right panel showed the corresponding quantitative analysis of the amount and total intensity of identified peptide, highlighting the expected h-lysoTRAP-mediated decrease of SARS-CoV-2 proteins. i Degradation proportion analysis of representative viral proteins after a 24-hour co-incubation with h-lysoTRAP based on the proteomics data. The degradation proportions of each viral protein were normalized according to the PBS group. j Detection of residual peptides of NSP5 after a 24-hour co-incubation with h-lysoTRAP via proteomic analysis. For visualization, the detected peptides (marked with cyan) were overlapped upon the NSP5 crystal 3D Structure. k CE analysis of authentic SARS-CoV-2 genome and corresponding distribution analysis of viral genome and fragments, showing a dynamic degradation process on viral genome scale. l Schematic for the authentic SARS-CoV-2 genome. m Degradation profiles of representative authentic SARS-CoV-2 genes with h-lysoTRAP treatment based on q-PCR data. n Correlation analysis between degradation half-time and length of representative authentic SARS-CoV-2 genes. The R2 values reflect Pearson’s correlation analysis. The data in d, m, and n represent the mean ± S.D. (n = 3 biologically independent experiments). Statistical significance was calculated using two-tailed unpaired t-test in d. Source data were provided in the Source data file.
Fig. 6
Fig. 6. h-lysoTRAP-mediated clearance of authentic SARS-CoV-2 on human lung organoids.
a Schematic for the construction of human lung organoids and anti-infection experiment on organoid model. Lung cells (isolated from normal lung tissues adjacent to tumors derived from resection surgeries) were seeded into Matrigel containing known growth and regulatory factors to induce lung spheroids. 1 d after inoculation with 100 TCID50 authentic SARS-CoV-2 and treatment with different formulations, the lung spheroids were collected for q-PCR analysis, immunofluorescence analysis and lactate dehydrogenase (LDH) release detection. In these formulations, free EIDD-2801 (molnupiravir) can bind with RNA-dependent RNA polymerase (RdRp) to inhibit SARS-CoV-2 infection and have been FDA-approved specific medicine for COVID-19. Free RBD antibody can bind with the RBD area of S protein of SARS-CoV-2 to inhibit SARS-CoV-2 infection. The concentration of free EIDD-2801 and RBD antibody was selected to match the amount of ACE2 present on the membrane of the h-lysoTRAP. b q-PCR analysis of wild-type SARS-CoV-2 RNA copies in human lung organoids, showing the efficient virion clearance and efficiently inhibited viral infection by h-lysoTRAP in human lung organoids. c Representative immunofluorescence images of wild-type SARS-CoV-2 infection, visualized by S protein expression in human lung organoids. d Relative LDH release from human lung organoids after viral inoculation and formulation treatment. e Representative photos of the organoids after viral inoculation and formulation treatment. f–i Similar data as presented in be following infection with Omicron variant. j Principal component analysis showing the viral infection profiles (four infection indices) across eight groups. Each dot represents a human lung organoid; the colors of the dot denote the groups; and the ellipses show the distribution of the groups. k Visualization of indices of viral infection among the eight groups. Data were normalized for plotting. The data in b, d, f, and h represent the mean ± S.D. (n = 3 biologically independent experiments). Statistical significance was calculated using two-tailed one-way ANOVA with multiple comparison tests in b, d, f, and h. Source data were provided in the Source data file.
Fig. 7
Fig. 7. Extension of lysoTRAP for clearance of H1N1 in vitro, in vivo and on human lung organoids.
a Schematic for the construction of sialic acid (SA) engineering lysosome (lysoTRAP (SA)). Upon 2,6-siayltransferase (SIAT1) and Cytidine 5’-monophosphate-N-acetylneuraminic acid (CMP-SA), the surface of the lysosome was modified with SA, which served as a H1N1 entry-point. b CLSM images of lysoTRAP (SA). c TEM lysoTRAP (SA) showing the typical lysosome morphology. d QCM analysis of the interaction between H1N1-PR8 virions and lysoTRAP (SA). e TEM imaging of lysoTRAP (SA) after a 4-hour co-incubation with H1N1-PR8 virions. The internalized H1N1-PR8 virions were indicated by red arrows in lysoTRAP (SA). f ELISA measurement of viral N protein level and q-PCR analysis of H1N1-PR8 mRNA expression after a 24-hour incubation with lysoTRAP (SA). g q-PCR analysis of H1N1-PR8 mRNA expression (left) and representative CLSM images of N protein expression (right) in MDCK cells upon treatment with PBS or lysoTRAP (SA). h Schematic for the detection of in vivo clearance of H1N1 virions by lysoTRAP (SA) in C57BL/6 mice. i q-PCR analysis of H1N1-PR8 mRNA levels in the lung tissues. j Representative H&E images of the lung tissue after H1N1-PR8 infection. kl Similar data as that presented in i,j following infection with H1N1-CA07. m Schematic for the anti-infection experiment on human lung organoid model. 1 d after inoculation with 100 TCID50 H1N1-CA07 or H1N1-PR8 and treatment with PBS or h-lysoTRAP (SA), the human lung organoids were collected for q-PCR analysis and immunofluorescence analysis. n q-PCR analysis of H1N1-PR8 RNA copies and representative immunofluorescence images of N protein of H1N1-PR8 in human lung organoids. o Similar data as that presented in n following infection with H1N1-CA07. The data in f, g, n, and o represent the mean ± S.D. (n = 5 biologically independent experiments). The data in i and k represent the mean ± S.D. (n = 10 biologically independent mice). Statistical significance was calculated using two-tailed unpaired t-test in f, g i, k, n, and o. Source data were provided in the Source data file.

References

    1. Synowiec, A., Szczepanski, A., Barreto-Duran, E., Lie, L. K. & Pyrc, K. Severe Acute Respiratory Syndrome Coronavirus 2 (SARS-CoV-2): a Systemic Infection. Clin. Microbiol. Rev.34, 133–120 (2021). - PMC - PubMed
    1. Lamers, M. M. & Haagmans, B. L. SARS-CoV-2 Pathogenesis. Nat. Rev. Microbiol.20, 270–284 (2022). - PubMed
    1. Wiersinga, W. J., Rhodes, A., Cheng, A. C., Peacock, S. J. & Prescott, H. C. Pathophysiology, Transmission, Diagnosis, and Treatment of Coronavirus Disease 2019 (COVID-19): A Review. JAMA324, 782–793 (2020). - PubMed
    1. Hoffmann, M. et al. SARS-CoV-2 Cell Entry Depends on ACE2 and TMPRSS2 and Is Blocked by a Clinically Proven Protease Inhibitor. Cell181, 271–280.e278 (2020). - PMC - PubMed
    1. Zhang, H. et al. APOE Interacts with ACE2 Inhibiting SARS-CoV-2 Cellular Entry and Inflammation in COVID-19 Patients. Signal. Transduct. Target. Ther.7, 261 (2022). - PMC - PubMed

Publication types

MeSH terms

Substances

Supplementary concepts