. 2024 Nov 22;14(1):28962.
doi: 10.1038/s41598-024-73544-z.

Analysis of complex excitation patterns using Feynman-like diagrams

Affiliations

Analysis of complex excitation patterns using Feynman-like diagrams

Louise Arno et al. Sci Rep. .

Abstract

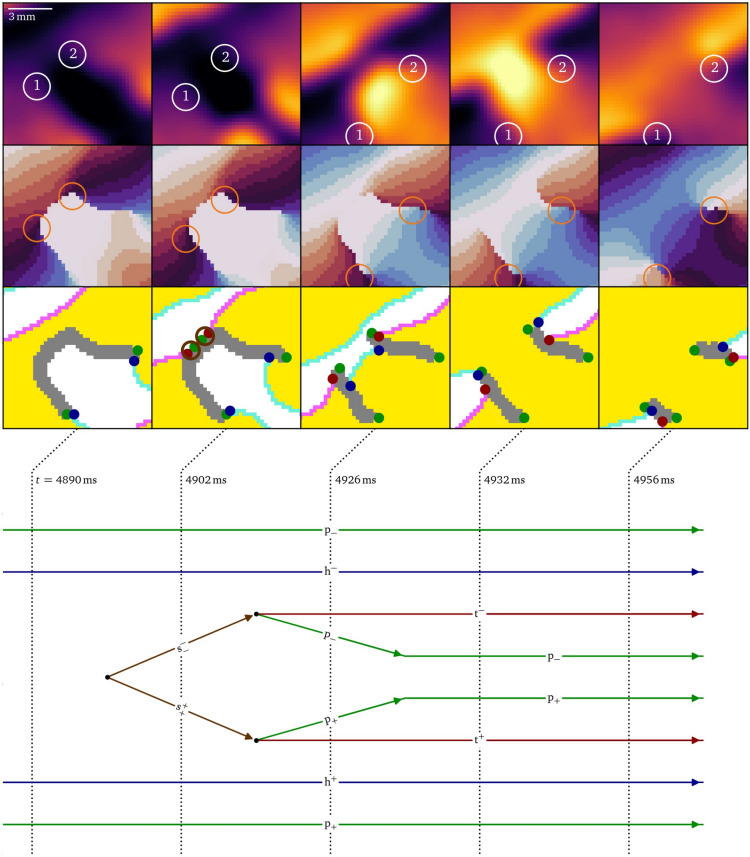
Many extended chemical and biological systems self-organise into complex patterns that drive the medium behaviour in a non-linear fashion. An important class of such systems are excitable media, including neural and cardiac tissues. In extended excitable media, wave breaks can form rotating patterns and turbulence. However, the onset, sustaining and elimination of such complex patterns is currently incompletely understood. The classical theory of phase singularities in excitable media was recently challenged, as extended lines of conduction block were identified as phase discontinuities. Here, we provide a theoretical framework that captures the rich dynamics in excitable systems in terms of three quasiparticles: heads, tails, and pivots. We propose to call these quasiparticles 'cardions'. In simulations and experiments, we show that these basic building blocks combine into at least four different bound states. By representing their interactions similarly to Feynman diagrams in physics, the creation and annihilation of vortex pairs are shown to be sequences of dynamical creation, annihilation, and recombination of the identified quasiparticles. We draw such diagrams for numerical simulations, as well as optical voltage mapping experiments performed on cultured human atrial myocytes (hiAMs). Our results provide a new, unified language for a more detailed theory, analysis, and mechanistic insights of dynamical transitions in excitation patterns.


Conflict of interest statement

Competing interests: The authors declare no competing interests.

Figures

Fig. 1
Fig. 1
Conceptual framework for the analysis of excitation patterns using quasiparticles and Feynman-like diagrams. (A) A linear-core spiral wave in a numerical simulation on a human biventricular geometry, see the Methods section below. (B) Numerical simulation in a two-dimensional domain, which could represent a pattern on the outer surface of the heart or in a cell culture. (C) The linear phase based on local activation time (LAT) (3). (D) Spatial analysis of the observed pattern, showing excited (E, yellow) and unexcited (U, white) regions. They are separated by the wave fronts (F, cyan), wave backs (B, magenta), and phase defect lines (Z, gray). The end points of these three different curves are topologically preserved as quasiparticles: heads (h, blue), tails (t, red), and pivots (p, green). (E) Top: Depending on the orientation, we assign positive or negative charges Q=±12 to heads and tails, and charges P=±12 to pivots. Bottom: Several combinations of head, tail, and pivot are seen to travel together through the medium, akin to bound states in particle physics: the classical tip (f=h+t), the spiral core (c=h+t+2p), and the newly identified phase defect growth sites (g=h+t+p), and shrinking sites (s=t+p) seen during arrhythmogenesis. For an overview of all quantities, see Table 1. (F) We propose to keep track of the recombinations of building blocks over time using Feynman-like diagrams.
Fig. 2
Fig. 2
Sketch illustrating the main quantities in the definitions for the topological framework on a linear-core rotor. Isochrones at different LATs t are used to define the phase φ, which in turn is used to define the wave front (F) and back (B). At the core of the vertex, the phase φ is discontinuous. The threshold ρ>ρ of the phase defect density is used to define the phase defect region Z. The angle ψ with the x-axis is the direction of wave propagation.
Fig. 3
Fig. 3
Non-integer P-charges are possible for paths around inexcitable obstacles.
Fig. 4
Fig. 4
Diagrammatic analysis of the creation of two spiral waves in a simulation of break-up,. First row: Snapshots of the normalized transmembrane potential with the phase singularities highlighted which were detected by the Kuklik method, and in the second row, corresponding phase maps,. Third row: Identification of the quasiparticles in subsequent snapshots. The resulting diagram at the bottom shows that the birth of a rotor pair involves seven topological interactions, including the creation of a shrink pair, and the splitting of a conduction block line. No heads, tails, or pivots are drawn at the boundary since it is an inset, not the medium boundary. The vortex with label 1 is excluded from the diagram of topological interactions. The same color scheme as in Fig. 1 is used consistently in this article.
Fig. 5
Fig. 5
Feynman-like diagram of the creation of two spiral waves via two merging conduction block lines (CBLs) in an optical voltage mapping experiment. The detailed quasiparticle viewpoint shows that both events are part of a single complex multi-stage process of up to twelve quasiparticles at the same time interacting in 93 reactions. The stages (A, B, D, and E) are shown in more detail in Figs. 6, 7, 8, and 9, respectively. The formation of the second CBL in panel C is analogous to the first one in panel A and Fig. 6.
Fig. 6
Fig. 6
Creation of a persisting pair of pivot particles due to conduction block as the first step of figure-of-eight spiral formation in the optical mapping experiment, cf. Fig. 5A. At first, when the wave front runs into the wave back, a pair of growth particles is formed, which then decay into a pivot, head, and tail each. The heads and tails annihilate, while the pivot particles persist.
Fig. 7
Fig. 7
Accumulation of conduction block is the process of shrinking due to a wave back hitting a phase defect line and growing due to a wave front, which, in total, makes the conduction block grow. This process is observed another five times in the data during the following burst pacing pulses leading up to figure-of-eight spiral formation in the optical mapping experiment, cf. Fig. 5B.
Fig. 8
Fig. 8
The merger of two conduction blocks takes place when the two phase defects grow close enough such that their particles annihilate with each other, creating a larger phase defect line. This is another intermediate step of figure-of-eight spiral formation in the optical mapping experiment, cf. Fig. 5D.
Fig. 9
Fig. 9
Splitting of a large conduction block as the final step of figure-of-eight spiral formation in the optical mapping experiment, cf. Fig. 5E. When a wave back meets the phase defect, a pair of shrink particles is formed, halving the U-shaped phase defect line with Q=0 and P=0. When the shrink particles decay, two rotor cores with Q=±1 and P=±1 are formed.

Similar articles

References

    1. Cannon, J. et al. Neurosystems: Brain rhythms and cognitive processing. Eur. J. Neurosci.39, 705–719. 10.1111/ejn.12453 (2014). - PMC - PubMed
    1. Smith, D. L., Lucey, B., Waller, L. A., Childs, J. E. & Real, L. A. Predicting the spatial dynamics of rabies epidemics on heterogeneous landscapes. Proc. Natl. Acad. Sci.99, 3668–3672. 10.1073/pnas.042400799 (2002). - PMC - PubMed
    1. Lechleiter, J., Girard, S., Peralta, E. & Clapham, D. Spiral calcium wave propagation and annihilation in xenopus laevis oocytes. Science252, 123–126. 10.1126/science.2011747 (1991). - PubMed
    1. Rotermund, H.-H., Engel, W., Kordesch, M. & Ertl, G. Imaging of spatio-temporal pattern evolution during carbon monoxide oxidation on platinum. Nature343, 355–357. 10.1038/343355a0 (1990).
    1. Kapral, R. & Showalter, R. Chemical Waves and Patterns (Kluwer, 1995).

LinkOut - more resources