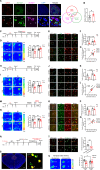
. 2025 Jun;30(6):2407-2426.
doi: 10.1038/s41380-024-02845-6. Epub 2024 Nov 22.

Prefrontal parvalbumin interneurons mediate CRHR1-dependent early-life stress-induced cognitive deficits in adolescent male mice

Affiliations

Prefrontal parvalbumin interneurons mediate CRHR1-dependent early-life stress-induced cognitive deficits in adolescent male mice

Yu-Nu Ma et al. Mol Psychiatry. 2025 Jun.

Abstract

Cognitive impairment, a core symptom of psychiatric disorders, is frequently observed in adolescents exposed to early-life stress (ES). However, the underlying neural mechanisms are unclear, and therapeutic efficacy is limited. Targeting parvalbumin-expressing interneurons (PVIs) in the medial prefrontal cortex (mPFC), we report that ES reduces mPFC PVI activity, which causally mediated ES-induced cognitive deficits in adolescent male mice through chemogenetic and optogenetic experiments. To understand the possible causes of PVI activity reduction following ES, we then demonstrated that ES upregulated corticotropin-releasing hormone (CRH) receptor 1 [CRHR1, mainly expressed in pyramidal neurons (PNs)] and reduced activity of local pyramidal neurons (PNs) and their excitatory inputs to PVIs. The subsequent genetic manipulation experiments (CRHR1 knockout, CRH overexpression, and chemogenetics) highlight that ES-induced PVI activity reduction may result from CRHR1 upregulation and PN activity downregulation and that PVIs play indispensable roles in CRHR1- or PN-mediated cognitive deficits induced by ES. These results suggest that ES-induced cognitive deficits could be attributed to the prefrontal CRHR1-PN-PVI pathway. Finally, treatment with antalarmin (a CRHR1 antagonist) and environmental enrichment successfully restored the PVI activity and cognitive deficits induced by ES. These findings reveal the neurobiological mechanisms underlying ES-induced cognitive deficits in adolescent male mice and highlight the therapeutic potentials of PVIs in stress-related cognitive deficits in adolescent individuals.


Conflict of interest statement

Competing interests: The authors declare no competing interests. Ethics approval and consent to participate: All methods performed in this study were conducted in accordance with the relevant guidelines and regulations. Ethical approval was obtained from the Peking University Biomedical Ethics Committee, Laboratory Animal Welfare Ethics Sub-Committee (reference number LA2020309). Informed consent was obtained from all participants involved in the study.

Figures
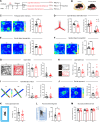
Fig. 1
Fig. 1. Early-life stress specifically impaired cognition in adolescent male mice.
A Experimental timeline of ES, behavioral tests, and brain tissue acquisition. B A schematic illustration of control (left panel) and ES (right panel) housing conditions. While the control mice lived in cages with sufficient bedding/nesting conditions, the ES dam and pups lived in cages with limited nesting and bedding materials. CF Cognitive behavioral tests and results. The left panels in (C, E, and F) are representative maps showing the time spent in each location by CT and ES mice; warm colors represent more time. C Temporal order memory test. Right panel, the percentage of time spent probing the “remote” and “recent” object (one sample t-test between two objects: CT: t11 = 4.475, p = 0.001; ES: t11 = 0.006, p = 0.996; unpaired t-test: t22 = 2.911, p = 0.008). D Y-maze spontaneous alternations. Left panel, representative motion path in the test; middle, spontaneous alternation ratio (t22 = 2.676, p = 0.014, unpaired t-test). Right panel, erroneous alternations: alternative arm return (AAR: t22 = 1.549, p = 0.136, unpaired t-test) and same arm return (SAR: t22 = 2.381, p = 0.026, unpaired t-test). E Novel object recognition test. Right panel, the percentage of time spent probing the “novel” object and “familiar” object (one sample t-test between two objects: CT: t11 = 4.839, p = 0.001; ES: t11 = 2.003, p = 0.0704; unpaired t-test: t22 = 0.806, p = 0.008). F Spatial object recognition test. Right panel, the percentage of time spent probing the “displaced” and “stationary” object (one sample t-test: CT: t11 = 3.426, p = 0.006; ES: t11 = 0.358, p = 0.727; unpaired t-test: t22 = 2.819, p = 0.010). GI Anxiety-like behavioral tests and results. G Open field test. Left panel, representative motion paths of CT and ES mice. Middle panel, total distance traveled in 10 min (t22 = 1.073, p = 0.295, unpaired t-test). Right panel, time spent in center zone (t12.73 = 2.095, p = 0.057, unpaired t-test with Welch’s correction). H Light–dark box test. Left panel, representative motion paths in the light chamber for CT and ES mice. Middle panel, time in the light chamber (t17 = 1.051, p = 0.308, unpaired t-test). Right panel, latency to reach the light chamber (t17 = 0.482, p = 0.636, unpaired t-test). I Elevated plus maze test. Left panel, representative map showing the time spent in each location by CT and ES mice; warm colors represent more time. Middle panel, time spent in the open arms (t10.17 = 1.184, p = 0.263, unpaired t-test with Welch’s correction). Right panel, latency to open arms (t10.52 = 1.053, p = 0.316, unpaired t-test with Welch’s correction). J Social approach test. Left panel, representative map showing the time spent in each location by CT and ES mice; warm colors represent more time. Right panel, time spent interacting with stranger mice (t22 = 1.320, p = 0.201, unpaired t-test). KM Depressive-like behavioral tests and results. K Tail suspension test. Left panel, diagram of the test. Right, immobility time within 6 min (t22 = 2.095, p = 1.299, unpaired t-test). L Forced swimming test. Left panel, diagram of the test; Right panel, immobility time within 6 min (t20 = 2.260, p = 0.035, unpaired t-test). M Sucrose preference test. The percentage of sucrose preference (stress effect, F (1, 63) = 0.001, p = 0.976; time effect, F (2, 63) = 0.493, p = 0.613; stress × time interaction, F (2, 63) = 0.148, p = 0.863). Data are represented as mean ± SEM. *p < 0.05 and **p < 0.01 for comparisons between the CT and ES group; ##p < 0.01 and ###p < 0.001, one sample t-test. AAR alternative arm return, CT control, ES early-life stress, PND postnatal day, SAR same arm return. See also Figs. S1–S2.
Fig. 2
Fig. 2. Early-life stress reduced PVIs (not SST-INs) activity in the mPFC of adolescent male mice.
AC Quantification of the density of PVIs or SST-INs that were c-fos-positive in CT and ES mice during the TOM test. A Experimental timeline of ES exposure, behavioral tests, and brain tissue acquisition from C57BL/6 mice. B Top panel, representative images showing the co-expression of c-fos and PV in the mPFC of CT and ES mice. Asterisks indicate neurons that co-express c-fos and PV; arrowheads indicate PV-expressing cells without detectable c-fos expression. Scale bar, 100 µm or 20 µm. Bottom panel: the density of neurons showing PV and c-fos colocalization in the three subfields of mPFC in two groups (Stress effect, F (1, 24) = 17.78, p < 0.001). C Top panel, representative images show the co-expression of c-fos and SST in the mPFC of CT and ES mice. Asterisks indicate neurons that co-express c-fos and SST; arrowheads indicate SST-expressing cells without detectable c-fos expression. Scale bar, 100 µm or 20 µm. Bottom panel: the density of neurons showing SST and c-fos colocalization in the three subfields of the mPFC in the two groups (Stress effect, F (1, 24) = 1.969, p = 0.170). DF Effects of ES on the intrinsic excitability of PVIs in the mPFC. D The experimental timeline of electrophysiological recordings in the mPFC in adolescent male PV::Ai14 mice. E Evoked action potentials. Left panel, sample traces in response to a 500-pA current step of CT and ES mice. Right panel, ES reduced the frequency of evoked action potentials in response to the current injection (≥200 μA, all p < 0.044, unpaired t-test). F Spontaneous action potentials. Left panel, sample traces of spontaneous potential in CT and ES mice. Right panel, ES did not alter the frequency and amplitude of the spontaneous action potential of PVIs. GJ Effects of ES on the excitatory transmission of PNs to PVIs. G The experimental timeline of electrophysiological recordings in the mPFC of adolescent male PV-Cre mice. H Schematic of virus injection and the recording strategy in PVIs in acute slice. I, J oEPSCs in PVIs in response to optical stimulation (473 nm, 10-ms pulse width at 100-ms interval) on PNs in the mPFC. I The frequency and amplitude of oEPSCs. Left panel, representative traces of oEPSC of CT and ES groups. Right panel, quantification of oEPSC frequency (t22 = 6.723, p < 0.001, unpaired t-test) and amplitude (t22 = 1.373, p = 0.184, unpaired t-test with Welch’s correction) of PVIs. J PPR of oEPSCs. Left panel, representative traces of PPR of CT and ES groups. Right panel, quantification of PPR (t19 = 5.908, p < 0.001, unpaired t-test). Data are represented as mean ± SEM. *p < 0.05, **p < 0.01 and ***p < 0.001, comparisons between CT and ES group; &p < 0.05 and & & &p < 0.001 for the effect of stress in the two-way ANOVA. Cg cingulate cortex, CT control, ES early-life stress, IL infralimbic cortex, mPFC medial prefrontal cortex, oEPSC optical-evoked excitatory postsynaptic current, PN pyramidal neuron, PND postnatal day, PPR paired-pulse ratio, PrL prelimbic cortex, PVI parvalbumin-expressing interneuron, SST-IN somatostatin-expressing interneuron, TOM temporal order memory. See also Figs. S3–S4.
Fig. 3
Fig. 3. Prefrontal PVI activity mediates early-life stress-induced cognitive deficits in adolescent male mice.
AE Chemogenetic inhibition of mPFC PVI activity impairs cognition. A Experimental timeline of the behavioral tests, CNO injection, and brain tissue acquisition after hM4D(Gi) virus injection in adolescent PV-Cre mice. B Left panel, representative image showing region-specific expression of mCherry in the mPFC; right panel, representative image showing that the majority of PVIs express hM4Di in the mPFC. Asterisks indicate neurons that co-express mCherry and PV; arrowheads indicate PV-expressing cells without detectable mCherry expression. Scale bar, 500 μm or 20 μm. C Representative images show the expression of c-fos and mCherry in the mPFC of Veh and CNO mice. Asterisks indicate neurons that co-express mCherry and c-fos, while arrowheads indicate mCherry-expressing cells without detectable c-fos expression. Scale bar, 100 µm or 20 µm. Immunostaining analyses confirmed that Gi decreased in the expression of c-fos in PVIs in the mPFC (t9 = 2.748, p = 0.023, unpaired t-test). Chemogenetic inhibition of mPFC PVI activity impaired (D) temporal order memory (Paired t-test: Veh: t9 = 2.617, p = 0.028; CNO: t9 = 1.495, p = 0.169; unpaired t-test: t18 = 3.010, p = 0.008) and E spatial working memory in the Y-maze spontaneous alternation test (SAR: t15 = 2.135, p = 0.050, unpaired t-test) in adolescent mice. FI Optogenetic inhibition of mPFC PVI activity impairs cognition. F Experimental timeline of the behavioral tests, light stimulation, and brain tissue acquisition after eNpHR3.0 viral infection in adolescent PV-Cre mice. The light stimulation protocol was 594 nm laser, 4–5 mW, OFF-ON-OFF-ON, 2 min/section. G Representative image showing the location of bilateral viral infection and optic-fiber implantation in mPFC. Scale bar, 500 μm. Optogenetic inhibition of mPFC PVI activity impaired (H) temporal order memory (Paired t-test: EGFP: t4 = 4.301, p = 0.013; eNpHR3.0: t4 = 1.542, p = 0.198; unpaired t-test: t8 = 3.414, p = 0.009) and (I) increased AAR in the Y-maze spontaneous alternation test (t8 = 2.709, p = 0.027, unpaired t-test) in adolescent mice. JN Chemogenetic activation of mPFC PVI activity reverses ES-induced cognitive deficits. J The experimental timeline of the behavioral tests, CNO injection, and brain tissue acquisition after hM3D(Gq) virus injection in adolescent PV-Cre mice. K Left panel, representative image showing region-specific expression of mCherry in the mPFC; right panel, representative image showing that the majority of PVIs express hM3Dq in the mPFC. Asterisks indicate neurons that co-express mCherry and PV; arrowheads indicate PV-expressing cells without detectable mCherry expression. Scale bar, 500 μm or 20 μm. L Representative images showing the expression of c-fos and PV in the mPFC of the four groups of mice. Immunostaining analyses reveal that the number of activated PVI neurons in the mPFC in the temporal order memory test was increased by CNO injection (CNO effect: F 1, 25 = 30.32, p < 0.001; two-way ANOVA). Asterisks indicate neurons that co-express PV and c-fos; arrowheads indicate PV-expressing cells without detectable c-fos expression. Scale bar, 100 µm or 20 µm. M, N Activation of PVIs in the mPFC reverses the ES-induced deficits of temporal order memory (M, CT-Veh vs. ES-Veh: p < 0.001, ES-Veh vs. ES-CNO: p < 0.001, Bonferroni’s test) and spatial working memory (N, SA: CT-Veh vs. ES-Veh: p < 0.001, Bonferroni’s test; ES-Veh vs. ES-CNO: p = 0.001, unpaired t-test; SAR: CT-Veh vs. ES-Veh: p < 0.001, ES-Veh vs. ES-CNO: p = 0.002, Bonferroni’s test). Data are represented as mean ± SEM. *p < 0.05, **p < 0.01 and ***p < 0.001, unpaired t-test or Bonferroni’s post hoc test; #p < 0.05, one sample t-test. AAR alternative arm return, CNO clozapine-N-oxide, CT control, ES early-life stress, mPFC medial prefrontal cortex, PND postnatal day, PVI parvalbumin-expressing interneuron, SA spontaneous alternation, SAR same arm return, Veh vehicle. See also Figs. S5–S8.
Fig. 4
Fig. 4. Prefrontal PN activity mediates early-life stress-induced cognitive deficits by enhancing PVI activity in adolescent male mice.
A The effects of ES on the mPFC PN activity. The left panels in (A) depict representative images showing the co-expression of c-fos and or Neurogranin in the mPFC of CT and ES mice. Asterisks indicate co-expressing neurons; arrowheads indicate neurogranin-expressing cells without detectable c-fos expression. Scale bar, 100 μm or 10 μm. Right panels show that ES reduces the density of c-fos- and neurogranin-co-expressing neurons (t9 = 2.668, p = 0.026, unpaired t-test) in the mPFC of adolescent mice during the TOM test. B The effects of ES on evoked action potential of PNs. Left panel, sample traces in response to a 500-pA current step of CT and ES mice. Bottom panel, ES reduced the frequency of evoked action potential in response to the current injection (≥400 μA, all p < 0.043, unpaired t-test). CH Chemogenetic activation of mPFC PN activity reverses ES-induced cognitive deficits. C Experimental timeline of the behavioral tests, CNO injection, and brain tissue acquisition after CamkIIa-hM3D(Gq) virus injection in adolescent C57BL/6 mice. D Representative image showing the co-expression of mCherry and CamkIIa in the mPFC. Scale bar, 10 µm. E Representative images showing the expression of c-fos and mCherry in the mPFC of the four groups of mice. Asterisks indicate neurons that co-express mCherry and c-fos; arrowheads indicate mCherry-expressing cells without detectable c-fos expression. Scale bar, 100 µm or 20 µm. F Immunostaining analyses show that the density of mCherry-infected neurons co-labeled with c-fos in the mPFC is significantly increased after the CNO injection (CNO effect: F 1, 20 = 17.57, p < 0.001; two-way ANOVA). G, H Activation of PNs in the mPFC reverses ES-induced deficits of temporal order memory (J, CT-Veh vs. ES-Veh: p = 0.003, ES-Veh vs. ES-CNO: p = 0.038, Bonferroni’s test) and spatial working memory (K, SA: CT-Veh vs. ES-Veh: p = 0.002; ES-Veh vs. ES-CNO: p = 0.008, Bonferroni’s test; SAR: CT-Veh vs. ES-Veh: p = 0.003, ES-Veh vs. ES-CNO: p = 0.007, Bonferroni’s test). I Experimental timeline of the behavioral tests, CNO injection, and brain tissue acquisition after CamkIIa-Gq and DIO-Gi viral infection in adolescent PV-Cre mice. J Representative images showing the expression of mCherry and c-fos in the mPFC of the four groups of mice. CNO increases the number of activated PNs (co-expressing mCherry and c-fos) in stressed (ES-Veh vs. ES-CNO, p < 0.001, Bonferroni’s test) mice. Asterisks indicate neurons that co-express mCherry and c-fos; arrowheads indicate mCherry-expressing cells without detectable c-fos expression. Scale bar, 20 µm. K Representative images showing the expression of PV and c-fos in the mPFC of the four groups of mice. PVI activity was inhibited in control mice after CNO administration and was reduced in ES-exposed vehicle mice (CT-Veh vs. CT-CNO, p = 0.028; CT-Veh vs. ES-Veh, p ≤ 0.023, Bonferroni’s test). Asterisks indicate neurons that co-express PV and c-fos; arrowheads indicate PV-expressing cells without detectable c-fos expression. Scale bar, 20 µm. L In the temporal order memory test, the inhibition of mPFC PVIs blocked the effects of the activation of PNs (ES-Veh vs. ES-CNO: t10 = 0.048, p = 0.963, unpaired t-test) on reversing the temporal order memory impairment induced by ES (CT-Veh vs. ES-Veh: t13 = 4.556, p < 0.001, unpaired t-test). M In the Y-maze spontaneous alternation test, a significant main effect of stress was observed on the SA (F 1, 27 = 4.859, p = 0.036), indicating the absence of the reversal effects of PN activation after PVI inhibition. In addition, CNO significantly increased AAR (F 1, 27 = 11.72, p = 0.002) and decreased SAR (F 1, 27 = 8.421, p = 0.007). Data are represented as mean ± SEM. *p < 0.05, **p < 0.01 and ***p < 0.001, unpaired t-test or Bonferroni’s post hoc test; #p < 0.05, paired t-test. &p < 0.05, stress effect of two-way ANOVA. $$p < 0.01, $$$p < 0.001, CNO effects in two-way ANOVA. AAR alternative arm return, CNO clozapine-N-oxide, CT control, ES early-life stress, mPFC medial prefrontal cortex, PND postnatal day, PVI parvalbumin-expressing interneuron, SA spontaneous alternation, SAR same arm return, Veh vehicle, VGluT1 vesicular glutamate transporter-1. See also Figs. S9–S14.
Fig. 5
Fig. 5. CRHR1 downregulation reverses early-life stress-induced cognitive deficits in adolescent male mice by restoring PVI activity in the medial prefrontal cortex.
A Crhr1 expression in excitatory and inhibitory neurons in the mPFC of adolescent mice. Left panel, representative (top, scale bar, 50 µm) and magnified (bottom, scale bar, 10 µm) images showing the mRNA expression of Crhr1, Slc32a1, and Slc17a7. Right panel, numbers of neurons that co-express Crhr1 and Slc32a1, Crhr1 and Slc17a7, Slc32a1 and Slc17a7, and Crhr1, Slc32a1, and Slc17a7. Numbers in parentheses indicate the total number of neurons expressing the corresponding mRNA. B ES upregulated CRHR1 mRNA level in mPFC of adolescent male mice (t9 = 2.489, p = 0.035, unpaired t-test). C, H, and M Experimental timeline in the behavioral tests and brain tissue acquisition after CRHR1 knockout in mPFC (C), antalarmin administration during ES exposure (H), or acute antalarmin treatment (M) in C57BL/6 mice. D, I, and N ES-induced deficits of temporal order memory were reversed by mPFC CRHR1 deletion (D, CT-CV vs. ES-CV: p = 0.002, ES-CV vs. ES-KD: p < 0.001, Bonferroni’s test), chronic antalarmin administration during PND2-8 (I, CT-Veh vs. ES-Veh: p = 0.003, ES-Veh vs. ES-Anta: p = 0.042, Bonferroni’s test), and acute antalarmin treatment (N, CT-Veh vs. ES-Veh: p = 0.002, ES-Veh vs. ES-Anta: p = 0.002, Bonferroni’s test). E, J, and O Representative images showing the expression of c-fos and PV in the mPFC of four groups. Asterisks indicate neurons that co-express c-fos and PV; arrowheads indicate PV-expressing cells without detectable c-fos expression. Scale bar, 100 µm or 20 µm. F, K, and P The effects of CRHR1 blockade on the reduction in PVI activity reduction induced by ES. F, K The negative effects of ES were reversed by CRHR1 deletion in the mPFC (F, CT-CV vs. ES-CV: p = 0.029, ES-CV vs. ES-KD: p = 0.029; unpaired t-test) or acute antalarmin treatment (K, CT-Veh vs. ES-Veh: p = 0.001; ES-Veh vs. ES-Anta: p = 0.007; Bonferroni’s test). P Chronic antalarmin administration during PND2-8 upregulated the density of PVIs co-labeled with c-fos reduced by ES (F 1, 15 = 17.82, p < 0.001, two-way ANOVA). G, L, and Q Correlations between mPFC PVI activity and the discrimination index in the temporal order memory test across all animals in each experiment. R Experimental timeline of the behavioral tests, CNO and antalarmin injection, and brain tissue acquisition after DIO-Gi viral infection in adolescent PV-Cre mice. S Left panel, representative image showing region-specific expression of mCherry in the mPFC; right panel, representative the image showing that the majority of PVIs express hM4Di in the mPFC. Asterisks indicate neurons that co-express mCherry and PV; arrowheads indicate PV-expressing cells without detectable mCherry expression. Scale bar, 500 μm or 10 μm. U In temporal order memory test, the inhibition of mPFC PVIs blocked the effects of an acute injection of antalarmin on reversing the temporal order memory impairment induced by ES (ES-Anta-Veh vs. ES-Anta-CNO: t18 = 2.464, p = 0.024, unpaired t-test; ES-Anta-Veh: t9 = 3.122, p = 0.012, ES-Anta-CNO: t9 = 0.242, p = 0.815, paired t-test). T Representative images showing the expression of PV and c-fos in the mPFC of the two groups of mice. PVI activity was inhibited in stressed mice acutely injected with of antalarmin after CNO administration (t9 = 4.898, p < 0.001, unpaired t-test). Asterisks indicate neurons that co-express PV and c-fos; arrowheads indicate PV-expressing cells without detectable c-fos expression. Scale bar, 100 µm or 20 µm. Data are represented as mean ± SEM. *p < 0.05, **p < 0.01 and ***p < 0.001, Bonferroni’s post hoc test; &p < 0.05, &&p < 0.01, for the effect of stress from two-way ANOVA; $$$p < 0.001, for the effect of the drug from two-way ANOVA. Anta antalarmin, Cg cingulate cortex, CNO clozapine-N-oxide, CT control, CV control virus, ES early-life stress, KO knockout, mPFC medial prefrontal cortex, PND postnatal day, PrL prelimbic cortex, PVI parvalbumin-expressing interneuron, Veh vehicle. See also Figs. S15–S17.
Fig. 6
Fig. 6. Environmental enrichment alleviates early-life stress-induced cognitive deficits through activation of prefrontal PNs and PVIs in adolescent male mice.
A Experimental timeline of EE exposure, behavioral tests, and brain tissue acquisition after ES. B A schematic illustration (left panel) and a photograph (right panel) of the enriched housing environment. C EE partially reversed the ES-induced temporal order memory deficits. Only the stressed mice in the standard housing environment failed to distinguish the “remote” object from the “recent” object (ES-SE: t6 = 0.396, p = 0.706, paired t-test), while the mice in the other three groups exhibited intact temporal order memory (CT-SE: t7 = 4.818, p = 0.002; CT-EE: t8 = 3.316, p = 0.011; ES-EE: t5 = 3.609, p = 0.015; paired t-test). D Representative images showing the expression of c-fos and neurogranin in the mPFC of the four groups. Asterisks indicate neurons that co-express c-fos and neurogranin; arrowheads indicate neurogranin-expressing cells without detectable c-fos expression. Scale bar, 100 µm or 20 µm. E ES significantly reduced neurogranin+ neuron activity (p = 0.013, Bonferroni’s test), which was reversed by environmental enrichment (t8 = 2.774, p = 0.024 unpaired t-test). F The correlation between mPFC PN activity and the discrimination index in the temporal order memory test across all animals. G Representative images showing the expression of c-fos and PV in the mPFC of the four groups. Asterisks indicate neurons that co-express c-fos and PV, while arrowheads indicate PV-expressing cells without detectable c-fos expression. Scale bar, 100 µm or 20 µm. H ES significantly reduced PVI activity (p < 0.001, Bonferroni’s test), which was reversed by environmental enrichment (p = 0.017, Bonferroni’s test). I The correlation between mPFC PVI activity and the discrimination index in the temporal order memory test across all animals. Data are represented as mean ± SEM. *p < 0.05, **p < 0.01 and ***p < 0.001, Bonferroni’s post hoc test; #p < 0.05 and ##p < 0.01, paired t-test. CT control, ES early-life stress, EE environmental enrichment, mPFC medial prefrontal cortex, PND postnatal day, PVI parvalbumin-expressing interneuron, SE standard environment. See also Fig. S18.

Similar articles

Cited by

References

    1. Solmi M, Radua J, Olivola M, Croce E, Soardo L, de Pablo GS, et al. Age at onset of mental disorders worldwide: large-scale meta-analysis of 192 epidemiological studies. Mol Psychiatry. 2022;27:281–95. - PMC - PubMed
    1. Paus T, Keshavan M, Giedd JN. Why do many psychiatric disorders emerge during adolescence. Nat Rev Neurosci. 2008;9:947–57. - PMC - PubMed
    1. LeMoult J, Humphreys KL, Tracy A, Hoffmeister JA, Ip E, Gotlib IH. Meta-analysis: exposure to early life stress and risk for depression in childhood and adolescence. J Am Acad Child Adolesc Psychiatry. 2020;59:842–55. - PMC - PubMed
    1. Wade M, Wright L, Finegold KE. The effects of early life adversity on children’s mental health and cognitive functioning. Transl Psychiatry. 2022;12:244. - PMC - PubMed
    1. Millan MJ, Agid Y, Brune M, Bullmore ET, Carter CS, Clayton NS, et al. Cognitive dysfunction in psychiatric disorders: characteristics, causes and the quest for improved therapy. Nat Rev Drug Discov. 2012;11:141–68. - PubMed

MeSH terms

LinkOut - more resources