. 2025 Feb;5(2):275-290.
doi: 10.1038/s43587-024-00762-5. Epub 2024 Nov 22.

Molecular and genetic insights into human ovarian aging from single-nuclei multi-omics analyses

Affiliations

Molecular and genetic insights into human ovarian aging from single-nuclei multi-omics analyses

Chen Jin et al. Nat Aging. 2025 Feb.

Abstract

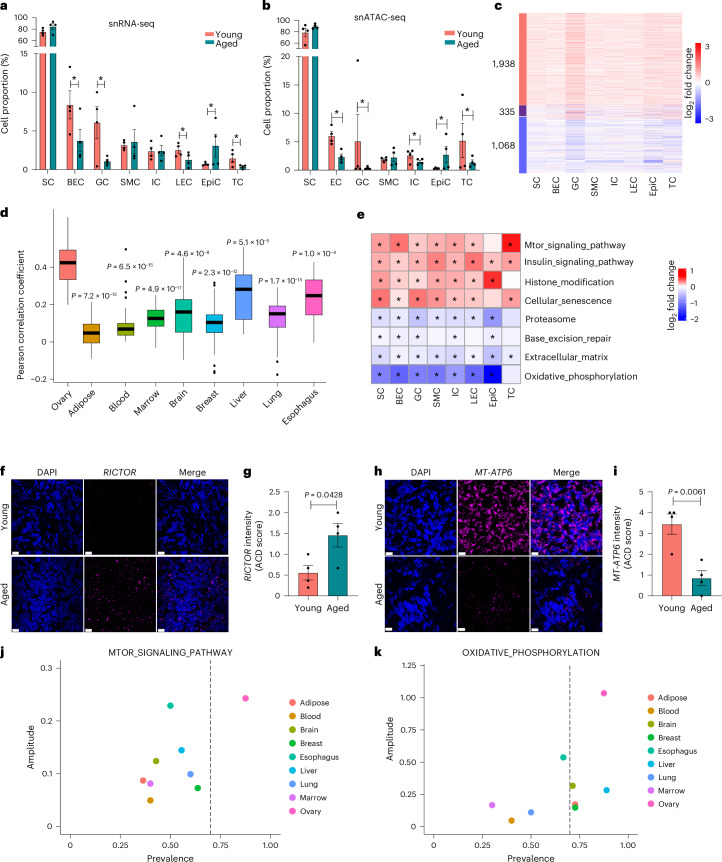
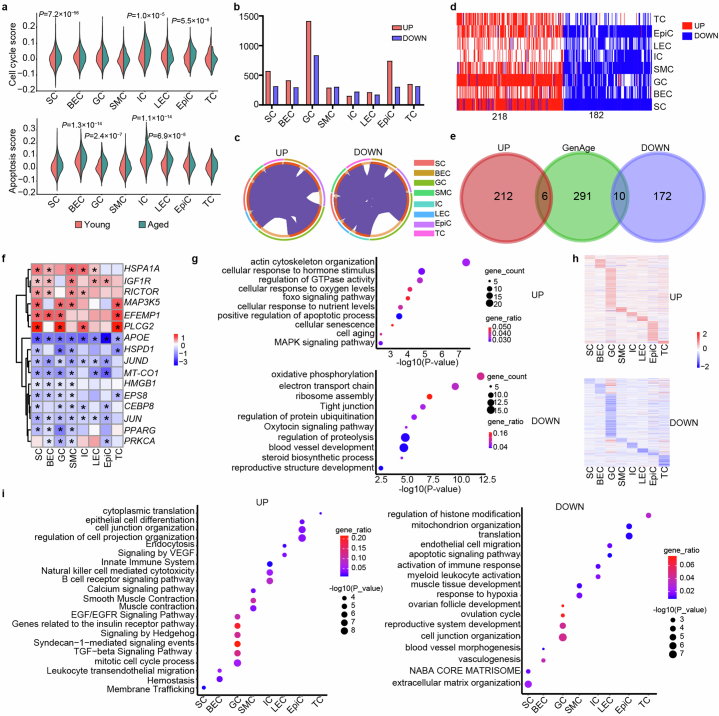
The ovary is the first organ to age in the human body, affecting both fertility and overall health. However, the biological mechanisms underlying human ovarian aging remain poorly understood. Here we present a comprehensive single-nuclei multi-omics atlas of four young (ages 23-29 years) and four reproductively aged (ages 49-54 years) human ovaries. Our analyses reveal coordinated changes in transcriptomes and chromatin accessibilities across cell types in the ovary during aging, notably mTOR signaling being a prominent ovary-specific aging pathway. Cell-type-specific regulatory networks reveal enhanced activity of the transcription factor CEBPD across cell types in the aged ovary. Integration of our multi-omics data with genetic variants associated with age at natural menopause demonstrates a global impact of functional variants on gene regulatory networks across ovarian cell types. We nominate functional non-coding regulatory variants, their target genes and ovarian cell types and regulatory mechanisms. This atlas provides a valuable resource for understanding the cellular, molecular and genetic basis of human ovarian aging.


Conflict of interest statement

Competing interests: The authors declare no competing interests.

Figures

Fig. 1
Fig. 1. Single-nuclei transcriptomic and chromatin accessibility profiling of the human ovary.
a, Schematic representation of experimental methodology. b, UMAP plots of human ovary snRNA-seq dataset (n = 8 donors; four young and four aged; 42,568 nuclei). c, Dot plot representing relative mRNA expression of selected known markers for each cell type. Dot size indicates the proportion of cells in the cluster expressing a gene; the shading indicates the relative level of expression (low to high reflected as light to dark). d, UMAP plots of human ovary snATAC-seq dataset (n = 8 donors; four young and four aged; 41,550 nuclei). e, Dot plot representing relative gene activity of selected known markers for each cell type. Dot size indicates the proportion of cells in the cluster expressing a gene; the shading indicates the relative level of expression (low to high reflected as light to dark).
Fig. 2
Fig. 2. Aging alters ovarian cellular composition and affects the transcriptional activity of pathways involved in the hallmarks of aging across cell types.
a, Bar plots represent the proportion of each cell type in young and aged ovaries estimated from snRNA-seq data. Data are presented as mean ± s.e.m; permutation test; asterisk (*) indicates FDR < 0.05 and |FC| > 1.5; n = 10,000 iterations on cells from four biologically independent samples. b, Bar plots represent the proportion of each cell type in young and aged ovaries estimated from snATAC-seq data. Data are presented as mean ± s.e.m; permutation test; asterisk (*) indicates FDR < 0.05 and |FC| > 1.5; n = 10,000 iterations on cells from four biologically independent samples. c, Heatmap displaying log2FCs in gene expression (aged versus young) of human ovarian aging-associated DEGs in each cell type. d, Bar plots comparing the Pearson correlation coefficient of transcriptomic changes during aging between different tissues with human ovary (two-sided Wilcoxon test with Bonferroni correction). The box in the box plot represents the interquartile range (IQR), with the lower and upper edges corresponding to the 25th and 75th percentiles, respectively. In this case, the mean is indicated within the box. Whiskers extend to the minimum and maximum values within 1.5 times the IQR from the quartiles. e, Heatmaps showing the changes in pathway activity in ovarian aging for selected aging hallmark pathways. Differential pathway activity was assessed using a moderated t-test, with multiple comparisons adjusted by the Benjamini–Hochberg method. Asterisk (*) indicates a statistically significant difference (Padj < 0.05). f, Representative in situ hybridization (RNAscope) images from fresh-frozen human ovary tissue for RICTOR staining. Scale bar, 20 μm. g, Quantification of RICTOR expression in human ovary (young versus aged). Data are presented as mean ± s.e.m; n = 4 biologically independent samples; two-tailed unpaired t-test. h, Representative in situ hybridization (RNAscope) images from fresh-frozen human ovary tissue for MT-ATP6 staining. Scale bar, 20 μm. i, Quantification of MT-ATP6 expression in human ovary (young versus aged). Data are presented as mean ± s.e.m; n = 4 biologically independent samples; two-tailed unpaired t-test. j, Scatter plots showing the amplitude and prevalence ratio of mTOR signaling in the different human tissues. k, Scatter plots showing the amplitude and prevalence ratio of oxidative phosphorylation in the different human tissues. BEC, blood endothelial cell; EpiC, epithelial cell; FDR, false discovery rate; GC, granulosa cell; IC, immune cell; LEC, lymphatic endothelial cell; SC, stromal cell; SMC, smooth muscle cell; TC, theca cell. Source data
Fig. 3
Fig. 3. Aging increases signatures of cellular senescence and alters cellular communication in the ovary.
a, Bar plots represent the proportion of CDKN1A+ for each cell type in young and aged ovaries. Data are presented as mean ± s.e.m; permutation test; asterisk (*) indicates FDR < 0.05 and |FC| > 1.5; n = 10,000 iterations on cells from four biologically independent samples. b, Representative in situ hybridization (RNAscope) images from fresh-frozen human ovary tissue for CDKN1A (p21) staining. Scale bar, 20 μm. c, Quantification of CDKN1A expression and the proportion of CDKN1A+ cells in the human ovary (young versus aged). Data are presented as mean ± s.e.m; n = 4 biologically independent samples; two-tailed unpaired t-test. d, Violin plots showing the module score of HIF-1 pathway genes in CDKN1A+ cells and CDKN1A- cells from each type (two-sided Wilcoxon test with Bonferroni correction; NS, not significant). e, Heatmap of the differential number of interactions between cell types in young and aged ovaries. The top bar plots represent the sum of each column of values displayed in the heatmap (incoming signaling). The right bar plots represent the sum of each row of values (outgoing signaling). f, Heatmap showing the outgoing and incoming signaling pathways that were significantly enriched in young or aged ovaries for each cell type. g, Heatmap of FSH signaling network in young and aged ovaries. Rows and columns represent sources and targets, respectively. Bar plots on the right and top represent the total outgoing and incoming interaction scores, respectively. h, Heatmap of GDF signaling network in young and aged ovaries. Rows and columns represent sources and targets, respectively. Bar plots on the right and top represent the total outgoing and incoming interaction scores respectively. i, Violin plots showing the expression of FSH signaling-related genes in young and aged granulosa cells (two-sided MAST test with Bonferroni correction). j, Violin plots showing the expression of GDF signaling-related genes in young and aged granulosa cells (two-sided MAST test with Bonferroni correction). BEC, blood endothelial cell; EpiC, epithelial cell; FDR, false discovery rate; GC, granulosa cell; IC, immune cell; LEC, lymphatic endothelial cell; SC, stromal cell; SMC, smooth muscle cell; TC, theca cell. Source data
Fig. 4
Fig. 4. Cell-type-specific TF regulatory networks implicate CEBPD as an important regulator of aging-associated gene expression in the human ovary.
a, Heatmap showing the average chromVAR motif activity for each cell type. b, UMAP plots displaying the chromVAR motif activity of selected cell-type-specific TFs. c, Heatmap showing the TFs with significant changes in chromVAR motif activity in each cell type during ovarian aging. d, Split violin plots showing the expression levels of CEBPD in each cell type from young and aged ovaries (two-sided MAST test with Bonferroni correction). ek, TF regulatory network plots showing the top regulators of aging-associated DEGs in each cell type. BEC, blood endothelial cell; EpiC, epithelial cell; GC, granulosa cell; IC, immune cell; LEC, lymphatic endothelial cell; SC, stromal cell; SMC, smooth muscle cell; TC, theca cell.
Fig. 5
Fig. 5. Integration of ANM GWAS, single-nuclei multi-omics and machine learning nominates causal variants and gene targets associated with human ovarian aging.
a, Heatmap of enrichment significance of ovary-relevant trait GWAS variants in ovary cell type gene expression signatures. Cell type enrichment analysis was performed using MAGMA (one-sided). Asterisk (*) indicates a statistically significant enrichment (P < 0.05), no adjustment for multiple comparisons. b, Heatmap of enrichment significance of ovary-relevant trait GWAS variants in ovary cell-type-specific chromatin accessibility. Cell type enrichment analysis was performed using ldsc (two-sided). Asterisk (*) indicates a statistically significant enrichment (P < 0.05), no adjustment for multiple comparisons. c, Upset plot showing the intersection size between sets of ANM-associated variants that overlap with transcriptional regulatory elements found in each cell type. The bar plot on the left shows the set size of variants for each cell type; the bar plot on the top shows the number of overlapping variants shared by two or more sets or the number of unique variants in one set. d, Cis-regulatory architecture at the HELB gene in each cell type. The snATAC-seq tracks represent the aggregate signals of all cells from a given cell type. The co-accessible peaks inferred by Cicero for each cell type are shown. e, The gkm-SVM importance score for each base within the ±25-bp region surrounding rs3741605. f, The eQTL effect of rs3741605 on HELB expression in human ovary tissue from the GTEx database. g, Cis-regulatory architecture at the DEPTOR gene in each cell type. The snATAC-seq tracks represent the aggregate signals of all cells from a given cell type. The co-accessible peaks inferred by Cicero for each cell type are shown. h, The gkm-SVM importance score for each base within the ±25-bp region surrounding rs13263296. i, Split violin plots showing the expression levels of DEPTOR in each cell type during ovarian aging (two-sided MAST test with Bonferroni correction). j, The eQTL effect of rs13263296 on DEPTOR expression in human ovary tissue from the GTEx database. BEC, blood endothelial cell; CC, homozygous cytosine; EpiC, epithelial cell; GC, granulosa cell; IC, immune cell; LEC, lymphatic endothelial cell; SC, stromal cell; SMC, smooth muscle cell; TC, theca cell; TT; homozygous thymine.
Fig. 6
Fig. 6. Allele-specific expression analysis of the ANM-associated HELB variant.
a, Schematic of the stem cell models to test the causality of identified HELB variant rs3741605 in regulating HELB expression. b,c, Bar plots showing the relative abundance of major allele and minor allele DNA and cDNA in IMR90 (b) and H9-derived iPSC (c), EC, SMC, SC and GC. Data are presented as mean ± s.e.m; n = 3 biologically independent samples; two-sided paired t-test; no adjustment for multiple comparisons. d, Bar plots showing the relative abundance of major allele and minor allele cDNA in human primary cumulus cells. Data are presented as mean ± s.e.m; n = 3 biologically independent samples; two-sided paired t-test; no adjustment for multiple comparisons. EC, endothelial cell; GC, granulosa cell; SC, stomal cell; SMC, smooth muscle cell. Source data
Extended Data Fig. 1
Extended Data Fig. 1. Sample imaging and cell type assignments for human ovary snRNA-seq and snATAC-seq datasets.
a, Representative hematoxylin and eosin (H&E) images of young and aged human ovaries. Arrows indicate the follicles. Scale bar, 100 μm. This experiment was performed on all 8 human ovary samples, with 3-5 slides acquired per sample. b, Violin plots showing the post-mortem interval (PMI) score ovary samples. c, UMAP plots of the snRNA-seq datasets by sample. d, UMAP plots of the snATAC-seq datasets by sample.
Extended Data Fig. 2
Extended Data Fig. 2. Sample consistency and cell type specific features for human ovary snRNA-seq and snATAC-seq datasets.
a, UMAP plots of human ovary snATAC-seq dataset. Cell colors based on the snRNA-seq predicted annotation are shown. b, Genome browser plots showing the pseudo-bulk chromatin accessibility profiles for each cell type at the promoter region of cell type marker genes. c, Heat maps showing the pairwise cosine similarity of whole transcriptomes between human ovary samples. d, Heat maps showing the pairwise cosine similarity of chromatin accessibility between human ovary samples. e, Heat map showing the relative expression of the cell type-markers. f, Heat map showing chromatin accessibility of the cell type-specific DARs.
Extended Data Fig. 3
Extended Data Fig. 3. Cell type-common and specific features between ovarian cell types during aging.
a, Split violin plots showing the cell cycle score (left) and apoptosis (right) in each cell type from young and aged ovaries. (Two-sided Wilcoxon test with Bonferroni correction). b, Bar plots depicting the number of ovarian aging-associated DEGs for each cell type. c, Circos plots depicting the overlaps among gene lists of ovarian aging-associated up-regulated DEGs (left) or down-regulated DEGs (right) for each cell type. The inner-circle represents gene lists, and purple curves link identical genes. The genes that hit multiple lists are colored in dark orange, and genes unique to a list are shown in light orange. d, Heat map showing the genes that are differentially expressed in at least 4 cell types between young and aged ovaries. e, Venn diagrams of the overlaps between ovarian aging-associated up- or down-regulated DEGs and human aging-associated genes from the GenAge database. f, Heat map displaying log2 fold changes in gene expression (aged vs. young) of ovarian aging-associated DGEs in the GenAge database. Two-sided MAST test with Bonferroni correction. Asterisk (*) indicates the asterisk indicates a statistically significant difference. (Padj < 0.05). g, Representative GO terms of up-regulated common DEGs and down-regulated common DEGs. h, Heat map displaying log2 fold changes in gene expression (aged vs. young) of the cell type-specific ovarian aging-associated up- (top) and down-regulated (bottom) DEGs in each cell type. i, Representative GO terms of the cell type-specific ovarian aging-associated up- (top) and down-regulated (bottom) DEGs in each cell type. Source data
Extended Data Fig. 4
Extended Data Fig. 4. Pairwise Pearson correlation coefficient of transcriptomic changes during aging between cell types in various tissues.
a-i, Heat maps showing the Pearson correlation coefficient of transcriptomic changes during aging between cell types in human ovary (a), blood (b), marrow (c), brain (d), adipose (e), liver (f), breast (g), lung (h), and esophagus (i).
Extended Data Fig. 5
Extended Data Fig. 5. Aging affects the transcriptional activity of pathways involved in aging hallmarks across cell types.
a, Heat maps showing the changes in pathway activity in ovarian aging for 21 aging hallmark pathways. Differential pathway activity was assessed using a moderated t-test, with multiple comparisons adjusted by the Benjamini-Hochberg method. Asterisk (*) indicates a statistically significant difference (Padj <0.05). b, Split violin plots showing the expression levels of ovarian aging-associated DEGs in the mTOR pathway. Two-sided MAST test with Bonferroni correction. Asterisk (*) indicates the asterisk indicates a statistically significant difference. P-values for IGF1R are as follows: SC, P = 3.53 × 10⁻¹⁵⁸; BEC, P = 2.37 × 10⁻⁸; GC, P = 4.39 × 10⁻⁷; SMC, P = 4.88 × 10⁻²¹; LEC, P = 0.0021; EpiC, P = 2.79 × 10⁻¹⁰. P-values for INSR are as follows: SC, P = 2.91 × 10-148; SMC, P = 0.0052; EpiC, P = 2.35 × 10⁻5. P-values for IRS2 are as follows: SC, P = 1.75 × 10⁻152; GC, P = 1.56 × 10⁻15. P-values for PIK3C3 are as follows: SC, P = 6.45 × 10⁻117; GC, P = 1.67 × 10⁻8. P-values for PIK3CA are as follows: SC, P = 1.58 × 10⁻9. P-values for AKT3 are as follows: SC, P = 1.70 × 10⁻214; GC, P = 7.41 × 10⁻52; SMC, P = 1.28 × 10⁻5; IC, P = 3.73 × 10⁻6; LEC, P = 4.65 × 10⁻8; TC, P = 1.75 × 10⁻24. P-values for RICTOR are as follows: SC, P = 4.24 × 10⁻285; BEC, P = 4.1 × 10⁻8; SMC, P = 2.62 × 10⁻7; IC, P = 0.0071. P-values for RPTOR are as follows: GC, P = 0.035; EpiC, P = 0.0061. P-values for PDPK1 are as follows: GC, P = 8.3 × 10⁻8. P-values for PRKCI are as follows: SC, P = 1.20 × 10⁻70; GC, P = 1.62 × 10⁻6; EpiC, P = 1.71 × 10⁻11. P-values for PRKCH are as follows: BEC, P = 2.85 × 10⁻9; IC, P = 2.12 × 10⁻6. P-values for PRKCE are as follows: GC, P = 7.65 × 10⁻7; IC, P = 7.81 × 10⁻13. P-values for SGK1 are as follows: SC, P = 7.75 × 10⁻59; GC, P = 9.32 × 10⁻15; SMC, P = 2.25 × 10⁻29. P-values for RPS6KA2 are as follows: BEC, P = 3.49 × 10⁻11; GC, P = 5.60 × 10⁻5; EpiC, P = 0.015. P-values for RPS6KA3 are as follows: GC, P = 9.21 × 10⁻11. P-values for RPS6KA5 are as follows: SC, P = 6.62 × 10⁻108; EpiC, P = 0.00029. c, Split violin plots showing the expression levels of ovarian aging-associated DEGs in the oxidative phosphorylation pathway. Two-sided MAST test with Bonferroni. Asterisk (*) indicates the asterisk indicates a statistically significant difference. P-values for MT-ATP6 are as follows: SC, P = 0; BEC, P = 3.06 × 10⁻91; GC, P = 2.06 × 10⁻6; SMC, P = 5.06 × 10⁻37; IC, P = 1.11 × 10⁻5; LEC, P = 2.89 × 10⁻16; EpiC, P = 5.19 × 10⁻30. P-values for MT-CYB are as follows: SC, P = 1.21 × 10⁻210; BEC, P = 2.0 × 10⁻74; SMC, P = 7.28 × 10⁻25; LEC, P = 5.8 × 10⁻24; EpiC, P = 3.51 × 10⁻24. P-values for MT-ND1 are as follows: SC, P = 0; BEC, P = 4.17 × 10⁻90; GC, P = 0.00019; SMC, P = 6.54 × 10⁻28; LEC, P = 4.40 × 10⁻19; EpiC, P = 2.64 × 10⁻20. P-values for MT-ND2 are as follows: SC, P = 1.91 × 10⁻140; BEC, P = 7.20 × 10⁻59; GC, P = 2.40 × 10⁻7; SMC, P = 1.24 × 10⁻12; EpiC, P = 2.01 × 10⁻16. P-values for MT-ND3 are as follows: SC, P = 5.59 × 10⁻189; BEC, P = 2.09 × 10⁻59; GC, P = 0.0054; SMC, P = 1.32 × 10⁻26; EpiC, P = 5.60 × 10⁻13. P-values for MT-ND4 are as follows: SC, P = 1.69 × 10⁻200; BEC, P = 5.90 × 10⁻90; SMC, P = 5.25 × 10⁻19; LEC, P = 2.61 × 10⁻14; EpiC, P = 4.91 × 10⁻17. P-values for MT-ND5 are as follows: SC, P = 2.4 × 10⁻275; BEC, P = 3.12 × 10⁻46; GC, P = 1.66 × 10⁻10; SMC, P = 4.57 × 10⁻8; LEC, P = 2.74 × 10⁻8; EpiC, P = 1.70 × 10⁻12. P-values for MT-CO1 are as follows: SC, P = 0; BEC, P = 6.36 × 10⁻43; GC, P = 2.43 × 10⁻20; SMC, P = 1.44 × 10⁻17; LEC, P = 1.0 × 10⁻16; EpiC, P = 5.99 × 10⁻29. P-values for MT-CO2 are as follows: SC, P = 2.31 × 10⁻232; BEC, P = 9.86 × 10⁻37; GC, P = 7.11 × 10⁻5; SMC, P = 7.45 × 10⁻5; LEC, P = 1.43 × 10⁻6; EpiC, P = 1.72 × 10⁻25. P-values for MT-CO3 are as follows: SC, P = 0; BEC, P = 1.74 × 10⁻82; GC, P = 3.80 × 10⁻23; SMC, P = 3.53 × 10⁻45; IC, P = 6.91 × 10⁻6; LEC, P = 2.63 × 10⁻22; EpiC, P = 2.31 × 10⁻31.
Extended Data Fig. 6
Extended Data Fig. 6. Aging-prevalent pathways in various tissues and Human ovarian aging specific DEGs.
a-h, Scatter plots showing the amplitude and prevalence ratio of 21 aging hallmark pathways during aging in human ovary (a), blood (b), marrow (c), brain (d), adipose (e), liver (f), breast (g), lung (h), and esophagus (i). j, Venn diagrams of the overlap between ovarian aging-associated DEGs and aging-associated genes for all other human tissues. k,Representative GO terms of the 2,301 ovarian aging-specific genes.
Extended Data Fig. 7
Extended Data Fig. 7. CDKN1A+ cell proportions and transcriptional programs across age and different cell types.
a, UMAP plots showing the expression of CDKN1A (p21) and CDKN2A (p16) in the human ovary. b, Bar plots represent the proportion of CDKN1A+ cells and CDKN2A+ cells in the snRNA-seq data. (Data are presented as the mean ± s.e.m; Permutation test; Asterisk (*) indicates FDR < 0.05 and |fold change | > 1.5; n = 10,000 iterations on cells from 4 biologically independent samples). c, Heat map displaying log2 fold changes in gene expression (CDKN1A+ vs. CDKN1A- cells) of selected SASP genes in each cell type. d, Heat maps displaying log2 fold changes in gene expression (CDKN1A+ vs. CDKN1A- cells) of key HIF-1 target genes in each cell type. e, Middle: Volcano plot depicting differentially expressed genes (DEGs) in CDKN1A+ cells versus CDKN1A- cells from young (top) and old (middle) stromal cells, CDKN1A+ cells from old stromal cells versus CDKN1A+ cells from young stromal cells (bottom). Left: Representative GO terms of down-regulated genes in CDKN1A+ cells versus CDKN1A- cells from young (top) and old (middle) stromal cells, CDKN1A+ cells from old stromal cells versus CDKN1A+ cells from young stromal cells (bottom). Right: Representative GO terms of up-regulated genes in CDKN1A+ cells versus CDKN1A- cells from young (top) and old (middle) stromal cells, CDKN1A+ cells from old stromal cells versus CDKN1A+ cells from young stromal cells (bottom). f, Bar plots represent the number of intercellular interactions in young and old ovaries. g, Bar plots represent the strength of intercellular interactions in young and old ovaries. h, Heat map of the differential strength of interactions between cell types in young and aged ovaries. The top bar plots represent the sum of each column of values displayed in the heatmap (incoming signaling). The right bar plots represent the sum of each row of values (outgoing signaling). Source data
Extended Data Fig. 8
Extended Data Fig. 8. Cell identity-associated transcription factors in the human ovary.
a, UMAP plots displaying the chromVAR motif activity of granulosa cell-specific TFs. b, UMAP plots displaying the chromVAR motif activity of steroidogenesis-related TFs. c, Footprinting analysis of the granulosa cell-specific TFs and steroidogenesis-related TFs across ovarian cell types. d, UMAP plots displaying the chromVAR motif activity of endothelial cell and immune cell-specific TFs. e, UMAP plots displaying the chromVAR motif activity of epithelial cell and stromal cell-specific TFs. f, Split violin plots showing the cell identity score in each cell type from young and aged ovaries. Two-sided Wilcoxon test with Bonferroni correction; **P < 0.01, ****P < 0.0001. P-values for SC identify score are as follows: SC, P = 1.5 × 10⁻292; GC, P = 1.7 × 10⁻83; SMC, P = 2.4 × 10⁻12; TC, P = 1.9 × 10⁻12. P-values for GC identify score are as follows: GC, P = 4.2 × 10⁻44; TC, P = 1.7 × 10⁻5. P-values for SMC identify score are as follows: SMC, P = 4.3 × 10⁻11. P-values for IC identify score are as follows: IC, P = 0.0034. P-values for LEC identify score are as follows: BEC, P = 3.3 × 10⁻25. P-values for EpiC identify score are as follows: GC, P = 1.6 × 10⁻9; EpiC, P = 1.3 × 10⁻²². P-values for TC identify score are as follows: TC, P = 2.6 × 10⁻24. Source data
Extended Data Fig. 9
Extended Data Fig. 9. Cell type-specific cis-regulatory networks in the human ovary.
a, Schematic of the strategy to construct TF regulatory networks in each cell type. b, Bar plots represent the number of CCANs and CCAN-linked genes identified in each cell type. c, Venn diagrams of the overlap between CCAN-linked genes and cell-type markers or aging-associated DEGs in each cell type. A one-sided Fisher’s exact test was used for gene-set overlap significance, no adjustment for multiple comparisons. d, Representative GO terms of CEBPD target genes in each cell type.
Extended Data Fig. 10
Extended Data Fig. 10. Integrated analyses reveal candidate variants and regulatory elements in DNA damage response, mTOR, and oxidative phosphorylation.
a-g, Cis-regulatory architecture at DDX5 (a), PRIM1 (b), PHF20 (c), SENP7 (d), UBXN2A (e), EIF4EBP1 (f), and NADK2 (g) gene in each cell type. The snATAC-seq tracks represent the aggregate signals of all cells from a given cell type. The co-accessible peaks inferred by Cicero for each cell type are shown.

References

    1. Spira, A. The decline of fecundity with age. MaturitasSuppl 1, 15–22 (1988). - PubMed
    1. Faddy, M., Gosden, R., Gougeon, A., Richardson, S. J. & Nelson, J. Accelerated disappearance of ovarian follicles in mid-life: implications for forecasting menopause. Hum. Reprod.7, 1342–1346 (1992). - PubMed
    1. Nagaoka, S. I., Hassold, T. J. & Hunt, P. A. Human aneuploidy: mechanisms and new insights into an age-old problem. Nat. Rev. Genet.13, 493–504 (2012). - PMC - PubMed
    1. Muka, T. et al. Association of age at onset of menopause and time since onset of menopause with cardiovascular outcomes, intermediate vascular traits, and all-cause mortality: a systematic review and meta-analysis. JAMA Cardiol.1, 767–776 (2016). - PubMed
    1. Collaborative Group on Hormonal Factors in Breast Cancer. Menarche, menopause, and breast cancer risk: individual participant meta-analysis, including 118 964 women with breast cancer from 117 epidemiological studies. Lancet Oncol.13, 1141–1151 (2012). - PMC - PubMed