. 2024 Dec;27(12):2443-2454.
doi: 10.1038/s41593-024-01784-3. Epub 2024 Nov 22.

Predicting modular functions and neural coding of behavior from a synaptic wiring diagram

Collaborators, Affiliations

Predicting modular functions and neural coding of behavior from a synaptic wiring diagram

Ashwin Vishwanathan et al. Nat Neurosci. 2024 Dec.

Abstract

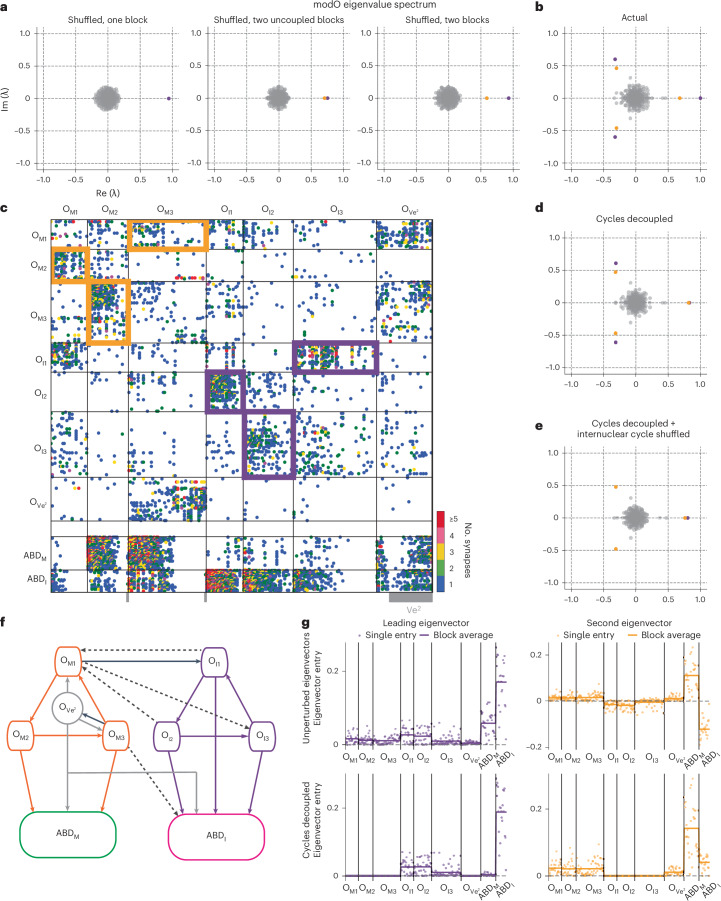
A long-standing goal in neuroscience is to understand how a circuit's form influences its function. Here, we reconstruct and analyze a synaptic wiring diagram of the larval zebrafish brainstem to predict key functional properties and validate them through comparison with physiological data. We identify modules of strongly connected neurons that turn out to be specialized for different behavioral functions, the control of eye and body movements. The eye movement module is further organized into two three-block cycles that support the positive feedback long hypothesized to underlie low-dimensional attractor dynamics in oculomotor control. We construct a neural network model based directly on the reconstructed wiring diagram that makes predictions for the cellular-resolution coding of eye position and neural dynamics. These predictions are verified statistically with calcium imaging-based neural activity recordings. This work demonstrates how connectome-based brain modeling can reveal previously unknown anatomical structure in a neural circuit and provide insights linking network form to function.


Conflict of interest statement

Competing interests: H.S.S., N.K., D.I., N.T. and K.L. have financial interests in Zetta AI, LLC. The remaining authors declare no competing interests.

Figures

Fig. 1
Fig. 1. EM reconstructions of brainstem neurons.
a, Three-dimensional rendering of reconstructed neurons. The large green cell body in the foreground is the Mauthner neuron (Mcell); Ro, rostral; C, caudal; D, dorsal; V, ventral; L, lateral; M, medial. The inset (top left) shows the location of the unilateral EM volume (black box) relative to the olfactory bulb (OB), tectum (Te), hindbrain (HB) and spinal cord (SC). bd, Automatic synapse detection and partner assignment. b, Raw EM image; scale bar, 750 nm. c, Postsynaptic densities (PSDs) identified by a convolutional network. d, Postsynaptic densities (red) overlaid onto the original raw image together with an exemplar presynaptic (blue) and postsynaptic (yellow) partnership identified by a second convolutional network. e, Sagittal view of the identified ABDM (green) and ABDI (magenta) neurons overlaid over representative EM planes; R, rhombomere. The asterisk (*) indicates the Mauthner cell soma. f, Coronal planes showing the locations of the ABDM (left) and ABDI (right) neurons at the planes indicated by dotted black lines in the sagittal view. Black boxes highlight nerve bundles from these populations. g, Representative ABDM and ABDI neurons with arrows indicating the axons. h, Reconstructions of large and small RS neurons and Ve2 neurons.
Fig. 2
Fig. 2. Modularity and functional specialization of interneurons.
a, Top, matrix of connections in the ‘center’ of the wiring diagram, with neurons clustered into two modules (modA and modO). Bottom, matrix of connections from center to large RS and ABD neurons in the periphery. b, Top, example connected pairs of modA neurons. Bottom, example connected pair of modO neurons (light and dark blue) and the overlap of their axons with the dendrite of an ABD internuclear cell (magenta). The grid in the background is the same in both images to facilitate comparison. c, Locations of reconstructed neuron somas (modA, orange; modO, blue) projected onto the horizontal plane and one-dimensional (1D) densities along the mediolateral (bottom) and rostrocaudal (left) axes. Closed circles are neurons with complete somas inside the reconstructed EM volume. Open circles are locations of the primary neurites exiting the top of the EM volume for cells with somas above the volume. The inset cartoon shows the region of the hindbrain in the figure. d, Postsynapses of neurons in modA and modO along with 1D densities. Every fifth postsynaptic density is plotted for clarity. e, Presynapses of neurons in modA and modO along with 1D densities. Every tenth presynaptic terminal is plotted for clarity. f, Schematic illustrating the definition of a potential (that is, false) synaptic connection identified when a presynaptic terminal (for example, axon 2) is proximal (red) to a postsynaptic density (for example, dendrite 1) but not actually in contact with it. g, Ratio of the number of within-module to the number of between-module synapses versus threshold distance for true and potential synapses. The table lists the actual true synapse densities for the data point with an asterisk (*). h, Ratio of numbers of synapses from neurons in modA and modO to peripheral neurons (ABD and RS).
Fig. 3
Fig. 3. Submodules specialized for the two eyes.
a, Top, matrix of connections within modO organized into two submodules termed modOM and modOI. Bottom, projections of modOM and modOI onto ABDM and ABDI neuron populations. b, Locations of reconstructed neuron somata along with 1D densities for neurons within modOM (blue) or modOI (brown). The symbols, inset and orientation are as in Fig. 2c. c,d, Postsynaptic densities (c) and presynaptic terminals (d) in modOI and modOM. Every fifth synaptic site was plotted for clarity. e, Ratio of the number of within-module synapses for modOM and modOI to the number of between-module synapses as a function of potential synapse distance. The table lists the actual number of true synapses for the data point with an asterisk (*). f, Ratio of the number of synaptic contacts between a modO submodule and its preferred peripheral partner versus those between a modO submodule and its nonpreferred peripheral partner. The numbers in the tables represent normalized synapse counts defined as the ratio of the sum of all synapses in a block to the product of the number of elements in the block. g, Ocular preference index for modOM and modOI neurons. A value of 1 or –1 indicates connections to only one ABD population. A value of 0 indicates an equal number of connections to each ABD population. Ve2 neurons were not included.
Fig. 4
Fig. 4. ModO contains two distinct cycles with different projections to the ABD.
a, Eigenvalue spectrum for modO when connections are shuffled (Methods), with modO treated as a single block (left) or as two blocks consisting of modOM and modOI with interconnections removed (middle) or intact (right). Im, imaginary; Re, real. b, Eigenvalue spectrum for the actual connectome. c, Matrix of synaptic connections for modO and its connections to the ABD. Cells are grouped by block identity in a seven-block SBM. The orange and purple boxes highlight cycles in the connections within blocks OM1–OM3 and blocks OI1–OI3, respectively. Gray ticks indicate the location of Ve2 cells. d,e, Eigenvalue spectrum of modO after the cycles are decoupled by eliminating connections between the internuclear cycle and the other four blocks (d) and when the connections within the internuclear cycle are additionally shuffled (e). f, Diagram of connections between blocks in modO. Solid lines indicate the most prominent connections, and dashed lines indicate weaker connections. g, Leading (left, purple) and second leading (right, orange) eigenvectors for modO (top) and modO with the two cycles decoupled as in d.
Fig. 5
Fig. 5. Connectome-based model captures functional characteristics of the oculomotor system.
a, Schematic illustrating gross organization of synaptic connections (triangles, excitatory; bars, inhibitory) between the three optically imaged populations; Ve2, vestibular; ABD, combined ABDM (green) + ABDI (pink) populations. b, Eye position (top) and calcium fluorescence activity (bottom) of an ABD neuron ipsilateral to the shown eye (green: raw fluorescence; dotted black: neural activity estimate from deconvolved fluorescence); AU, arbitrary units. c, Top, for the neuron in b, deconvolved fluorescence versus eye position (gray) and best-fit relationship (red) used to determine the relative eye position sensitivity k~ (see Methods). Bottom, for an example VPNI neuron, saccade-triggered average (STA) of deconvolved fluorescence (gray) and best fit to a sum of exponential functions with fixed time constants derived approximately from the principal components of the population firing rates (red; see Methods). d, Relative eye position sensitivities from the connectome-based model (gray) and imaging of real cells (green). e, Same as d except that the model uses potential synapses instead of the actual connectome. f, Cumulative variance explained for the leading principal components of the STA of the firing rates of the model (gray) or deconvolved fluorescence of imaged cells (green) for the period between 2 and 6 s after a saccade. g, For double exponential fits as in c, best-fit amplitudes of the exponentials for each cell in the model (gray) and each imaged cell (green). Note in d that VPNI cells were defined experimentally by having a sufficiently large correlation with eye position; thus, although included for completeness, the lowest sensitivity simulated VPNI cells would not have been counted if they occurred in a functional imaging dataset.
Extended Data Fig. 1
Extended Data Fig. 1. Composition of Axial module (modA).
a. Connectivity matrix (as in Fig. 2) with identification (arrows) of small RS neurons that were part of the center and inclusion into the periphery of the remaining small RS neurons along with the large RS neurons. b. Visualization of the large and small classes of RS neurons in the periphery (ro - rostral; c - caudal; m - medial; l - lateral). c. Visualization of small vSPNs that are part of the ‘center’ in modA and are indicated by arrows above the rows in a.
Extended Data Fig. 2
Extended Data Fig. 2. Module-specific synapse size and location distributions.
a. Histogram of neuronal pathlength in modA (n = 251) and modO (n = 289) for all cells (left), those with somata in the reconstructed volume (middle), and those with somata outside the reconstructed volume (right). Here and below, p is the significance value based on a two-sided Wilcoxon-rank sum test (RS-test). b. Histogram of synaptic size (detected PSD voxels [vx]) for connections within (left) and between (right) modules modA and modO. Table (here and below) summarizes the mean and standard deviations. c. Histogram of synapse locations, that is, distance from somata to synaptic site along the neurite, for neurons in modA and modO. Cohen’s D measures the effect size. d. Histogram of synapse sizes (detected PSD) of neurons within-module (left) and between-modules (right) for modOI and modOM. e. Histogram of synapse locations for neurons within the oculomotor modules modOI and modOM.
Extended Data Fig. 3
Extended Data Fig. 3. Clustering algorithm comparisons.
a. Connectivity when the center is organized by spectral clustering into two modules. b. Normalized number of synapses within and between relevant cell groups.
Extended Data Fig. 4
Extended Data Fig. 4. Clustering of center subgraph is insensitive to selection criteria and synapse detection errors.
a. Connectome for modO and its connections to the abducens with the eigencentrality threshold for inclusion in the center raised to exclude 25% of the cells that were previously included in the center. Cells are ordered by block identity after fitting a stochastic block model with 8 blocks. In this case, an eighth block was needed to sequester the vestibular cells into their own block. Colored rectangles highlight two cycles in the block structure, one connecting primarily to ABDM (orange) and the other primarily to ABDI(purple). b. Association matrix for block assignments when segmentation of the center is repeated 100 times after random addition and deletion of synapses according to the estimated precision and recall of synapse detection (see Methods). On average, a random variation of the connectome caused 0.5% of neurons to change block assignments.
Extended Data Fig. 5
Extended Data Fig. 5. Substructure of the center network.
Each dot indicates the presence of one or more synapses between two cells in the center network or from a cell in the center to a cell in the periphery. Cells are ordered by their block identity, determined by using Louvain clustering to split the center into an axial module (modA) and an oculomotor module (modO), followed by Stochastic Block Modeling to find substructure in each module. In the above, modA is split into 3 blocks, and modO is split into 7 blocks.
Extended Data Fig. 6
Extended Data Fig. 6. Example neuron firing rates in the simulated network.
Simulated firing rates for three neurons in response to a sequence of three simulated saccades at intervals of seven seconds (see Methods). Each trace is normalized to the peak firing rate reached by that neuron during the first fixation.
Extended Data Fig. 7
Extended Data Fig. 7. Behavior of the connectome-based model is insensitive to centrality threshold and errors in synapse detection.
a. Relative position sensitivites for different cell classes as the eigencentrality threshold for inclusion in the center is varied. Box bounds indicate 1st and 3rd quartiles; the whiskers extend from the box to the farthest data point lying within 1.5x the inter-quartile range (IQR) from the box. b. A comparison of relative eye position sensitivities between the actual connectome (gray) and 100 variations of the network produced by random addition and deletion of synapses according to the estimated error in synapse detection (green, see Methods). c. Comparison of estimated firing rates of identified integrator cells in larval zebrafish using calcium imaging (green) to firing rates simulated using a connectome-based model when the eigencentrality threshold is raised to remove 25% of the center (gray). (top) Cumulative variance explained for the leading principal components of the average activity between two and six seconds after a saccade. (bottom) Best-fit amplitudes determined as in Fig. 5g. Error bars on the cumulative variance explained (mean) show the standard deviation across the 100 random variations of the network. d. Same as c, but for the variations of the network used in b.
Extended Data Fig. 8
Extended Data Fig. 8. Block structure sufficient to maintain circuit function.
a. Position sensitivities (top, middle) and eigenvalues (bottom) for 100 networks in which all synapses within modO were shuffled while maintaining the in-degree and out-degree of each cell. In the top row, the position sensitivities of all shuffled networks (green) are compared to the actual network (gray) for each cell class (VPNI, Ve2, ABD). In the middle row, shuffled networks (x-axis) are compared to the actual network (y-axis) on a cell-by-cell basis, with the colors indicating which block each cell belonged to and opacity indicating the relative frequency of the eye position sensitivities produced for each cell across all of the shuffles. b. Same as a except that modO was partitioned into two blocks using a stochastic block model (SBM) and each group of synapses within each block and between each pair of blocks was shuffled separately. c. Same as b, but for 7 blocks instead of two.
Extended Data Fig. 9
Extended Data Fig. 9. Sub-blocks within ModO are necessary to reproduce observed dynamics.
a. Comparison of estimated firing rates of identified integrator cells in larval zebrafish using calcium imaging (green) to firing rates simulated using a connectome-based model after shuffling the synapses within ModO (gray, see Methods). (left) Cumulative variance explained for the leading principal components of the average activity between two and six seconds after a saccade. Error bars about the mean show the standard deviation across 100 random shuffles of the network. (right) Best-fit amplitudes determined as in Fig. 5g. b, c. Same as a, but with ModO split into two sub-blocks (b) or seven sub-blocks (c) using a stochastic block model. Synapses were shuffled separately for each possible pairing of presynaptic block and postsynaptic block.
Extended Data Fig. 10
Extended Data Fig. 10. Complex modes of cycles in the VPNI exhibit overdamped oscillation.
Stimulating a complex mode of a network gives rise to a linear combination of two spatial patterns of activity, one corresponding to the real part of the eigenvector and one corresponding to the imaginary part. The level of activity in each pattern oscillates over time while the overall amplitude decays, so that each neuron follows a trajectory of the form Aeηt sin (ωt + φ). If the decay is fast enough relative to the frequency of oscillation, as occurs for the complex modes of the internuclear and motor cycles, oscillations will not be evident in the single-neuron firing rates. The curves above show, for the complex mode of the internuclear cycle, a range of potential single-neuron firing rate trajectories corresponding to different phase offsets, from zero initial activity (purple) to maximal initial activity (blue).

References

    1. Briggman, K. L., Helmstaedter, M. & Denk, W. Wiring specificity in the direction-selectivity circuit of the retina. Nature471, 183–188 (2011). - PubMed
    1. Anderson, J. R. et al. Exploring the retinal connectome. Mol. Vis.17, 355–379 (2011). - PMC - PubMed
    1. Liu, Z. et al. Central vestibular tuning arises from patterned convergence of otolith afferents. Neuron108, 748–762 (2020). - PMC - PubMed
    1. Liu, Z. et al. Organization of the gravity-sensing system in zebrafish. Nat. Commun.13, 5060 (2022). - PMC - PubMed
    1. Wanner, A. A. & Friedrich, R. W. Whitening of odor representations by the wiring diagram of the olfactory bulb. Nat. Neurosci.23, 433–442 (2020). - PMC - PubMed

LinkOut - more resources