. 2024 Nov 22;7(1):1555.
doi: 10.1038/s42003-024-07214-1.

Targeting heterochromatin eliminates chronic myelomonocytic leukemia malignant stem cells through reactivation of retroelements and immune pathways

Affiliations

Targeting heterochromatin eliminates chronic myelomonocytic leukemia malignant stem cells through reactivation of retroelements and immune pathways

Donia Hidaoui et al. Commun Biol. .

Abstract

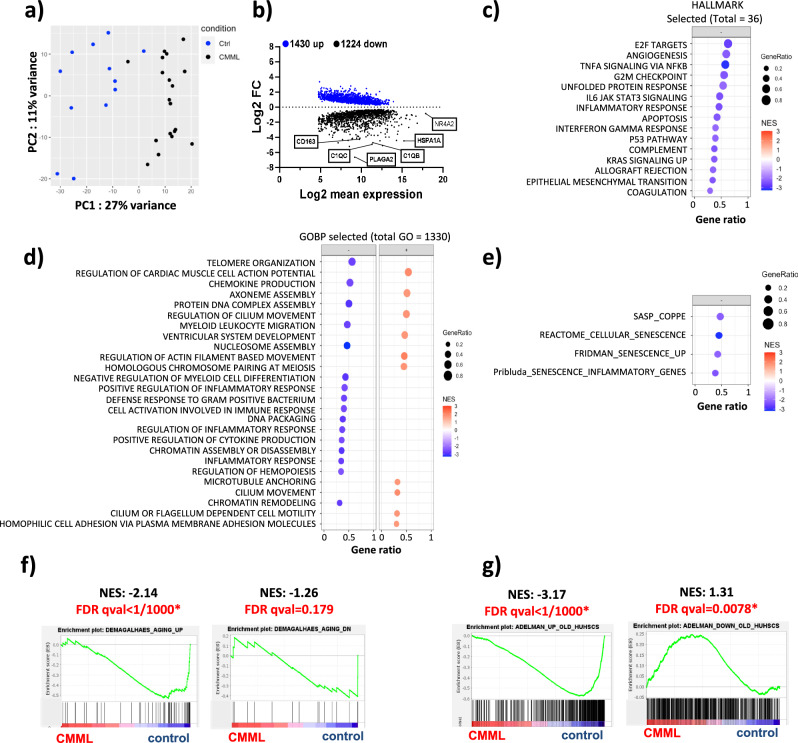
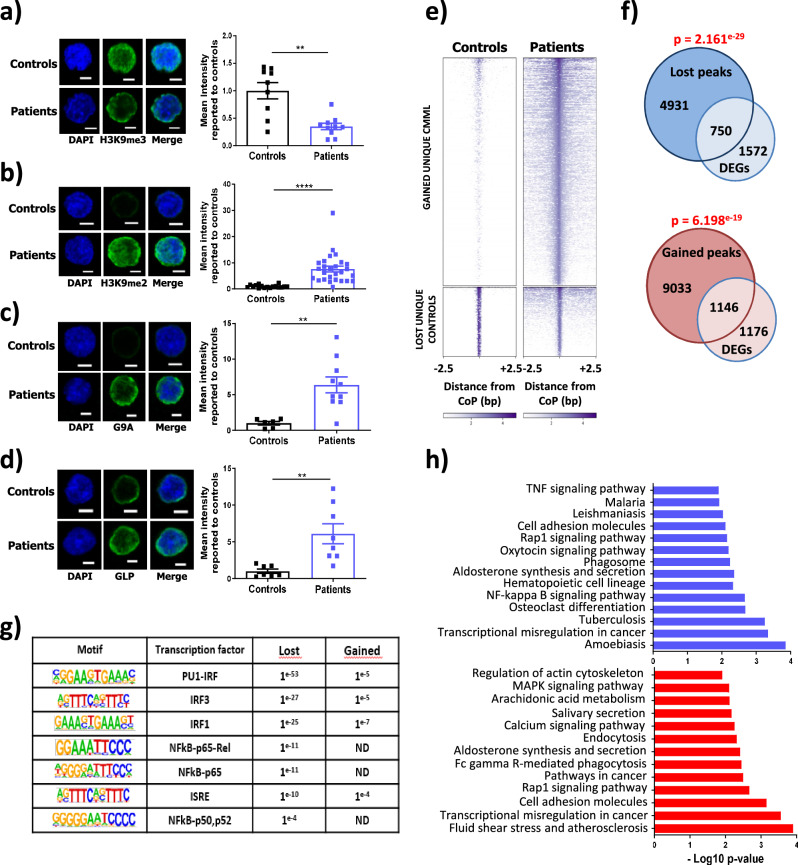
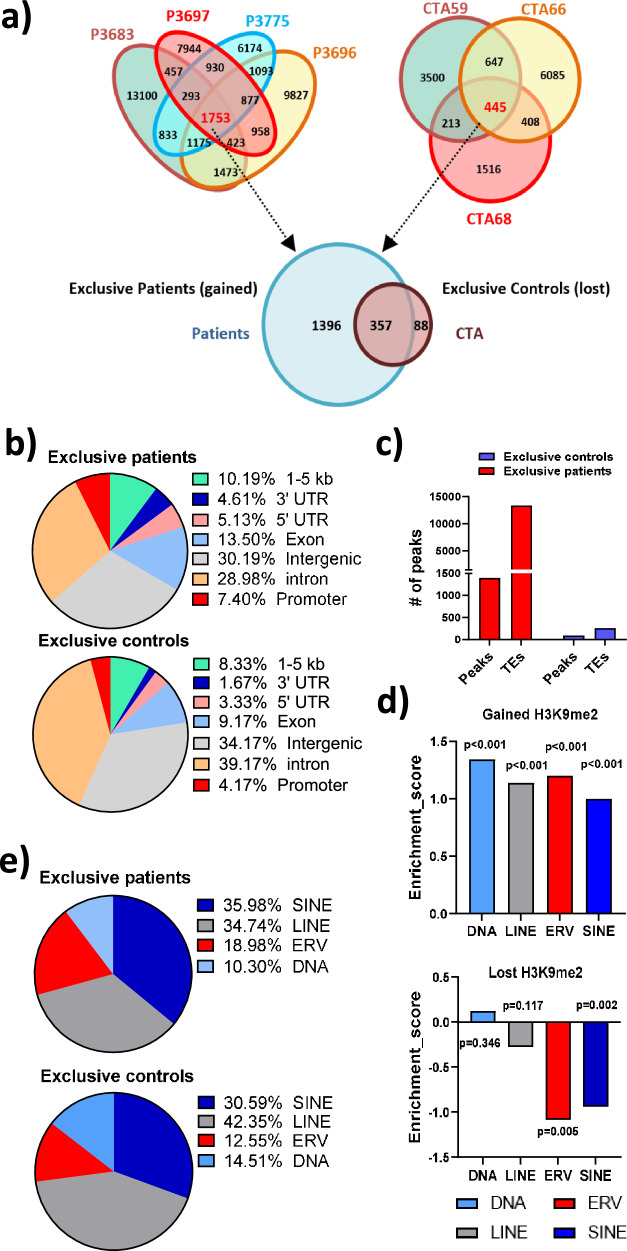
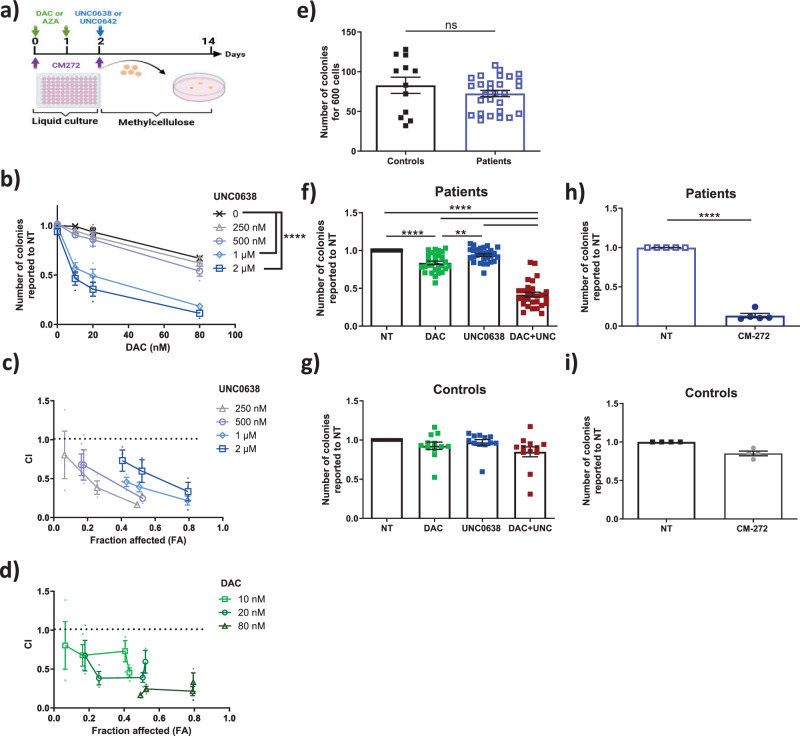
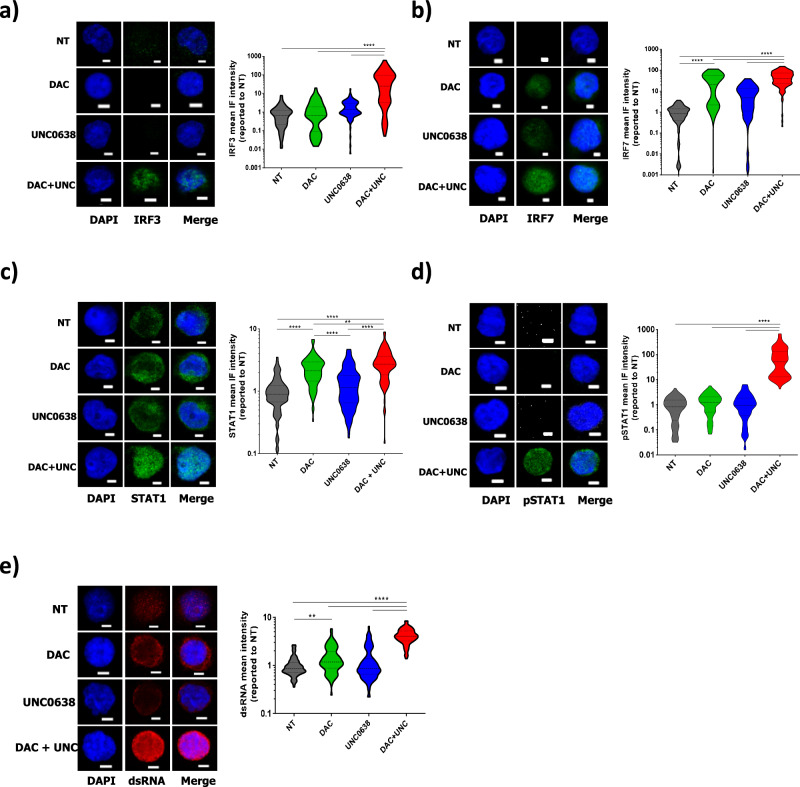
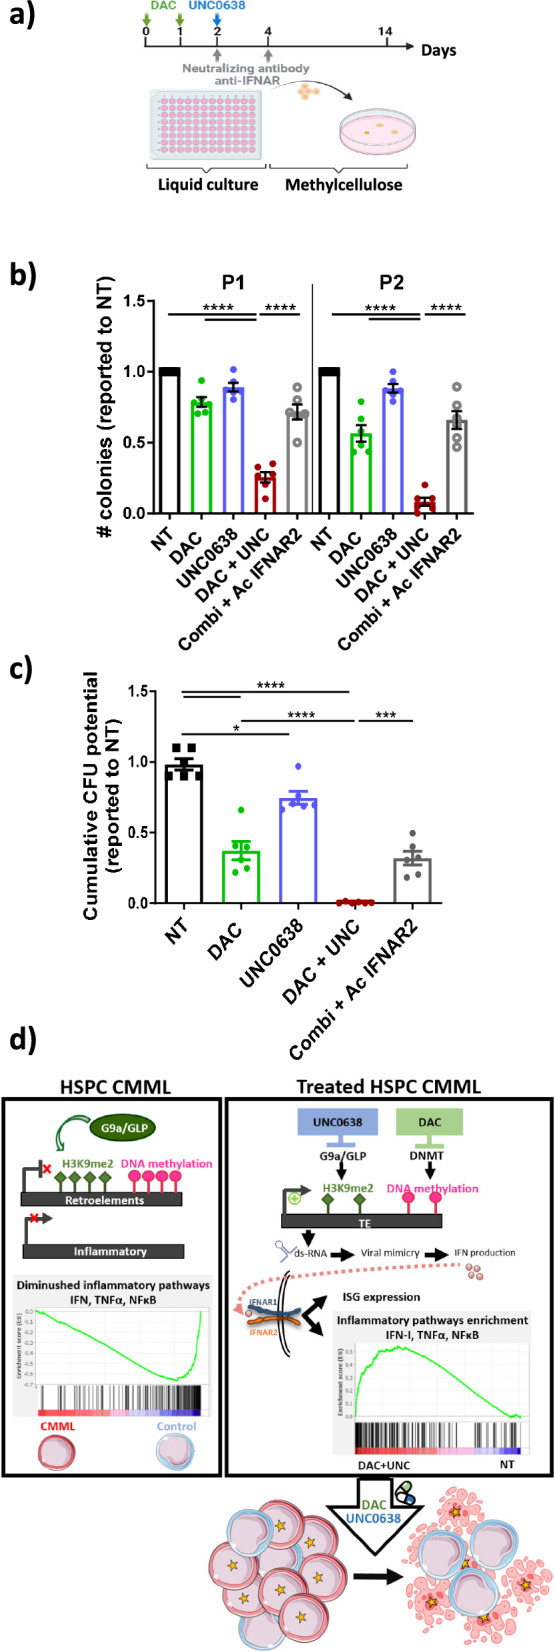
Chronic myelomonocytic leukemia (CMML) is a severe myeloid malignancy affecting the elderly, for which therapeutic options are limited. DNA hypomethylating agents (HMAs) provide transient responses, failing to eradicate the malignant clone. Hematopoietic stem cell (HSC) aging involves heterochromatin reorganization, evidenced by alterations in histone marks H3K9me2 and H3K9me3. These repressive marks together with DNA methylation are essential for suppressing transposable elements (TEs). In solid cancers, the antitumor efficacy of HMAs involves the derepression of TEs, mimicking a state of viral infection. In this study, we demonstrate a significant disorganization of heterochromatin in CMML HSCs and progenitors (HSPCs) characterized by an increase in the repressive mark H3K9me2, mainly at the level of TEs, and a repression of immune and age-associated transcripts. Combining HMAs with G9A/GLP H3K9me2 methyltransferase inhibitors reactivates these pathways, selectively targeting mutated cells while preserving wild-type HSCs, thus offering new therapeutic avenues for this severe myeloid malignancy.


Conflict of interest statement

Competing interests: E.T. is an Editorial Board Member for Communications Biology, but was not involved in the editorial review of, nor the decision to publish this article. The other authors declare no competing interests.

Figures

Fig. 1
Fig. 1. CMML HSPCs show a decrease in inflammatory response pathways.
a Principal component analysis (PCA) plot of BM CD34+ cells isolated from 19 CMML patients at diagnosis and 12 controls, based on RNA-seq regularized log transformed expression values. b MA-plots showing differentially expressed genes (p adj <0.1), upregulated (blue dots) or downregulated (black dots) in CMML cells. ce Dot plots showing selected enriched HALLMARK (total 36), GO (total 1330) and senescence gene sets upregulated (positive NES, red dots) and downregulated (negative NES, blue dots) in CMML cells. Gene sets are ranked by their NES and gene ratio scores. f, g Enrichment plots for aging published gene sets. FDR false discover rate, NES normalized enrichment score. *FDR < 0.05.
Fig. 2
Fig. 2. Chromatin is remodeled in CMML HSPCs.
a H3K9me3, b H3K9me2, c G9A and d GLP immunostaining in CD34+ cells from CMML patients and controls. Representative images and quantification of mean global immunofluorescence (IF) intensity using ImageJ software are shown. Means ± SEM from 2–4 independent experiments normalized to the mean intensity of controls. Each dot represents a single individual, with at least 50 cells counted per sample. Bars, 3 µm. Mann–Whitney test, **p < 0.01; ****p < 0.0001. e Heat map of the differentially chromatin accessible regions in CMML patient (n = 4) and control (n = 3) CD34+ cells ±2.5 kb from the center of the peak (CoP). f Venn diagrams depicting the overlap of DEGs in CMML HSPCs with genes assigned to gained or lost ATAC peaks (−100/+25 kb from TSS). Fisher’s exact test. g Motifs and p values for enrichment motifs of TF involved in IFN/NF-κB signaling in ATAC-seq peaks unique to patients (gained) and controls (lost) using HOMER. ND non detected. h KEGG gene sets (FDR < 0.25)  of deregulated genes that also exhibit gained (red) or loss chromatin accessibility in CMML patient cells (blue).
Fig. 3
Fig. 3. H3K9me2 is increased at TEs in CMML CD34+ cells.
a Venn diagram of peak retrieved from the calling from H3K9me2 CUT&Tag on CD34+ from 4 patients (P) and 3 controls (CTA). b Repartition of the CUT&Tag peaks found exclusively in patients and controls. c Numbers of common peaks found exclusively in the 4 patients (red) and 3 controls (blue) and numbers of TEs annotated in these peaks. d Enrichment or depletion of the different classes of TEs in gained or lost H3K9me2-CUT&Tag peaks. The Y-axis representing the enrichment score was calculated as the log2 fold change of the number of specific peaks overlapping with TEs found in patient gained or lost peaks over the median number of TEs found in 1000 times the same number of randomly selected peaks overlapping with TEs. Positive log2 fold change = enrichment, and negative log2 fold change = depletion. e Repartition of the different TE classes in CUT&Tag peaks found exclusively in patients and controls.
Fig. 4
Fig. 4. The HMA and G9A/GLP inhibitor combination reduces CMML HSPC clonogenicity.
a Treatment protocol of CD34+ cells. DAC decitabine, AZA 5-azacytidine, UNC0638 and UNC0642 G9A/GLP inhibitors, CM-272 dual DNMT1 and G9A/GLP inhibitor. b Dose-response effect of DAC (X-axis) and UNC0638 (color scale) on CMML CD34+ colony formation. Mean ± SEM from 3 patients. Two-way ANOVA Bonferroni’s multiple comparisons. c, d Chou-Talalay model of the effects of combining different doses of DAC and UNC0638. The fraction affected (fa) corresponds to the proportion of colonies eliminated by the treatments. The combination index (CI) is calculated by CompuSyn software (ComboSyn. Inc.) where CI < 1, CI = 1, CI > 1 indicates a synergistic, additive and antagonistic effect respectively. Mean ± SEM from 3 patients. e Number of colonies formed from CMML (n = 28) and control (n = 12) CD34+ cells in the absence of treatment. One dot represents a single individual. t-test. f, g Number of colonies formed by CD34+ cells from patients (f) or controls (g) after treatment with 10 nM DAC and 1 μM UNC0638 alone or in combination. NT non-treated. One dot represents a single individual; controls, n = 12; patients, n = 28. Results are normalized to the number of colonies in the NT condition. Means ± SEM. One-way ANOVA Bonferroni’s multiple comparison. h, i Number of colonies formed by CD34+ cells from patients, n = 5 (h) or controls, n = 4 (i) after treatment with or without (NT) 200 nM CM-272. Results are normalized to the number of colonies in the NT condition. One dot represents a single individual. Means ± SEM. t-test. **p < 0.01; ***p < 0.001; ****p < 0.0001.
Fig. 5
Fig. 5. Specific targeting of CMML mutant HSCs by DAC and G9A/GLP inhibitor combination.
a Protocol for treatments and serial replating assays in methylcellulose using stem cell- (CD34+CD38CD90+) or progenitor- (CD34+CD38CD90)-enriched populations. P passage. b Number of colonies formed from CMML patient stem and progenitor cells (n = 3) after the different passages in the presence or absence of DAC ± UNC0638. Numbers are reported to 5000 cells. Mean ± SEM. One-way ANOVA. c Effects of DAC and/or UNC0638 treatments on the cumulative clonogenic potential ([number of colonies at P2/number of cells planted at baseline] × number cells retrieved at P1) of stem and progenitor cells from patients, n = 3. Mean ± SEM. One-way ANOVA Bonferroni’s multiple comparison. d Protocol for treatments and single cell liquid culture assays using stem cell- (CD34+CD38CD90+) or progenitor- (CD34+CD38CD90)-enriched populations. eg Single cell liquid cultures. Viability (e), proliferation index (f) and cell number distribution per well at day 8 of the culture (g) of CMML patient stem cells (left panel) or progenitors (right panel) treated with either DAC (green), UNC0638 (blue) or both (red), or left non-treated (NT, black). n = 3. Mean ± SEM. Two-way ANOVA Bonferroni’s multiple comparison. *p < 0.05; **p < 0.01; ***p < 0.001; ****p < 0.0001.
Fig. 6
Fig. 6. The drug combination selectively eliminates leukemic cells while sparing wild-type cells in the patients.
Evaluation of the variant allelic frequency of identified mutated genes with VAF > 30%, after 14 days of culture of CD34+ cells in methylcellulose (left panel) or CD34+CD38CD90+ stem cells in liquid cultures (right panel), in the 4 conditions, as indicated. Percentage of cells with 0 (blue), 1 (light green and white), 2 (dark and light gray), or 3 (red) mutations. Mutation VAF are indicated over each panel.
Fig. 7
Fig. 7. Synergistic increase in TE expression in CMML patients CD34+ cells after treatment with the combination.
ae TE expression in RNA-seq analysis from CD34+ cells from 4 patients, after treatments in liquid culture with either DAC, UNC0638 or DAC + UNC0368, or left untreated (NT). a Protocol for treatments in liquid culture. b Volcano plots showing differential TE expression (p val < 0.05) in the DAC + UNC0638 condition compared to NT cells. c TE family repartition in differentially expressed TEs. Numbers indicate the percentage represented by each family. d Log2 Fold-change increase of differentially expressed TE classes in the DAC + UNC0638 condition vs. NT cells. One-way ANOVA Bonferroni’s multiple comparison. e Expression levels of TEs differentially expressed in the DAC + UNC0638 vs. NT condition in each of the treatment conditions, sorted by TE class. fh Differential analysis of ERV loci in RNA-seq data from 7 patients after treatments with DAC, UNC0638 or both compared to the untreated condition (NT). Venn diagrams of the differentially expressed ERV transcripts (p val < 0.05, FC 1.5), up- (f) and down-regulated (g) in each of the treated condition vs. NT, as indicated. h Heat map representation of the median expression level of differentially expressed ERVs in DAC + UNC0638 in the different conditions. Clusters with fewer than 20 nodes were excluded from the analysis. i RT-qPCR analysis of mRNA expression of chosen ERV families in the different conditions. Ct were normalized to HPRT, Tubulin, Gus, PPIA and/or RPL32 and reported to the NT condition. One line represents a single patient. Means ± SEM. One-way ANOVA Tukey’s multiple comparison. *p < 0.05; **p < 0.01.
Fig. 8
Fig. 8. Induction of transcriptional viral mimicry state by the combination of HMA and G9A/GLP inhibitors.
ae RNA-seq-analysis of coding genes from CD34+ cells of 7 patients after 4 days of treatment or not with DAC, UNC0638 or both. Each condition is compared to NT cells. a Venn diagram showing the number of common or unique DEGs in each condition. b Distribution of DEGs overexpressed (red) and downregulated (blue). GSE analysis of pathways enriched in upregulated (c) and downregulated (d) genes in DAC + UNC0638 vs. NT. e Enrichment analysis of different IFN/antiviral signatures by single sample gene-set variation analysis (ssGSVA). f mRNA expression level of IFNB1, IRF7 and IRF9 measured by RT-qPCR. Ct were normalized by custom housekeeping genes (HPRT, Tubulin, Gus, PPIA and/or RPL32) and reported to the NT condition. Each line represents a single patient. Means ± SEM. One-way ANOVA Dunnett’s multiple comparison *p < 0.05.
Fig. 9
Fig. 9. IFN signaling is activated by the HMA and G9A/GLP inhibitor combination.
Representative images and quantification of the mean overall IF intensity of a IRF3, b IRF7, c STAT1, d pSTAT1 and e dsRNAs in patient CD34+ cells after 4 days of culture. Results are reported to the mean IF intensity in the NT condition. N = 2 patients. Bars, 3 µm. Quantifications were performed using ImageJ software. Violin plots representing the mean IF intensity of each cell. At least 45 cells counted per sample. Dotted lines: median and 25th and 75th percentiles. One-way ANOVA Bonferroni’s multiple comparison. **p < 0.01; ****p < 0.0001.
Fig. 10
Fig. 10. IFN signaling is required for HMA and G9A/GLP inhibitor combination-induced cell death.
a Protocol scheme for the treatments with DAC ± UNC0638 and blocking IFN receptor (IFNAR2) antibodies. The anti-IFNAR2 antibody (1 µg/ml) was added on days 2 and 4 and the cells were seeded in methylcellulose on day 4. b Number of colonies at passages 1 and 2, reported to the non-treated condition. c Cumulative potential at passage 2. Results are reported to those obtained in the NT condition. Mean ± SEM; n = 6 patients. One-way ANOVA Bonferroni’s multiple comparison. *p < 0.05; ***p < 0.001; ****p < 0.0001. d Model illustrating the increase in H3K9me2 at TEs and repression of immune-associated transcripts in CMML HSPCs compared with age-matched healthy HSPCs (left). The mechanism repressing inflammatory gene is unknown but independent of H3K9me2. TEs are repressed by both H3K9me2 and DNA methylation in CMML cells, as shown by their reexpression only upon treatment with a combination of HMA and G9A/GLP inhibitors (right). Reexpression of TEs results in dsRNA formation, induction of IFN signaling and reactivation of the innate immune response in CMML HSCs, selectively targeting mutated cells while preserving residual wild-type HSCs. Left: Dark-blue cell, healthy donor HSC; red cells, CMML HSC. CMML mutated cells enter in apoptosis upon treatment with the combination. Right: red cell with a yellow star, CMML mutated HSC; light-blue cell, non-mutated HSC in CMML patients. The figure was created by AP and FP. Pictures from the cells are from Servier medical Art (https://smart.servier.com/).

References

    1. Khoury, J. D. et al. The 5th edition of the World Health Organization classification of haematolymphoid tumours: myeloid and histiocytic/dendritic neoplasms. Leukemia36, 1703–1719 (2022). - PMC - PubMed
    1. Itzykson, R. et al. Clonal architecture of chronic myelomonocytic leukemias. Blood121, 2186–2198 (2013). - PubMed
    1. Binder, M. et al. Oncogenic gene expression and epigenetic remodeling of cis-regulatory elements in ASXL1-mutant chronic myelomonocytic leukemia. Nat. Commun.13, 1434 (2022). - PMC - PubMed
    1. Merlevede, J. et al. Mutation allele burden remains unchanged in chronic myelomonocytic leukaemia responding to hypomethylating agents. Nat. Commun.7, 10767 (2016). - PMC - PubMed
    1. Palomo, L. et al. DNA methylation profile in chronic myelomonocytic leukemia associates with distinct clinical, biological and genetic features. Epigenetics13, 8–18 (2018). - PMC - PubMed

MeSH terms

LinkOut - more resources