. 2024 Nov 22;14(1):29013.
doi: 10.1038/s41598-024-79909-8.

Different dynamics of soluble inflammatory mediators after clearance of respiratory SARS-CoV-2 versus blood-borne hepatitis C virus infections

Affiliations

Different dynamics of soluble inflammatory mediators after clearance of respiratory SARS-CoV-2 versus blood-borne hepatitis C virus infections

Antonia Zeuzem et al. Sci Rep. .

Abstract

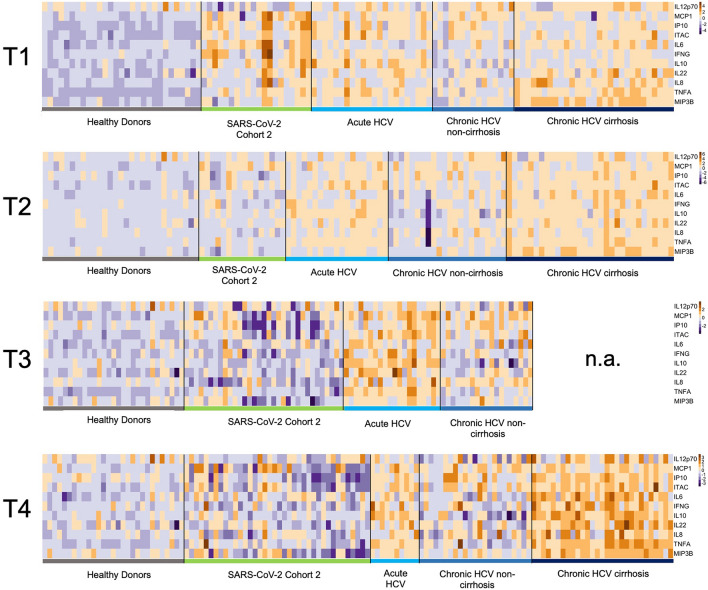
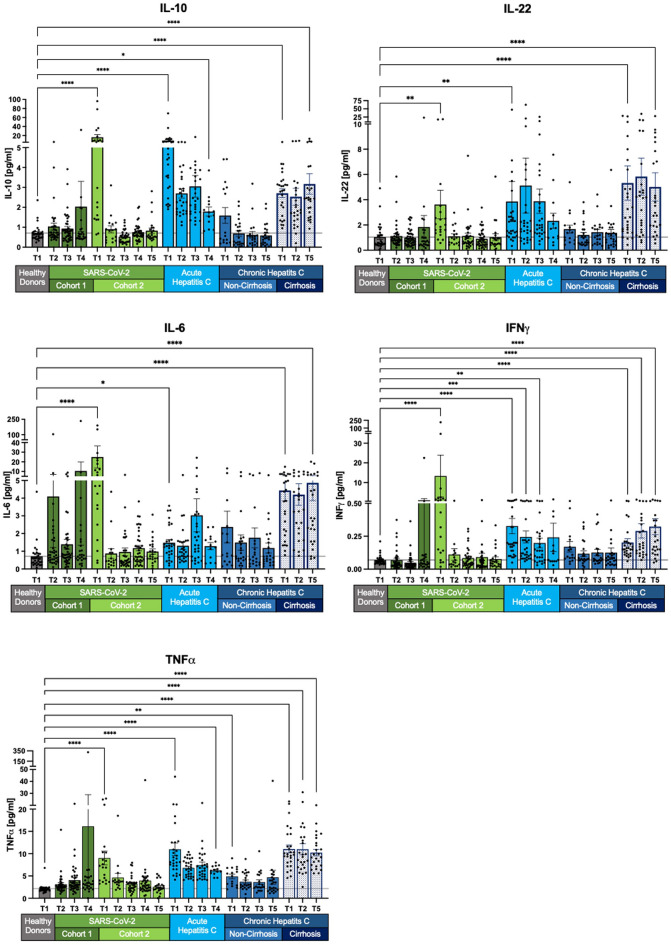
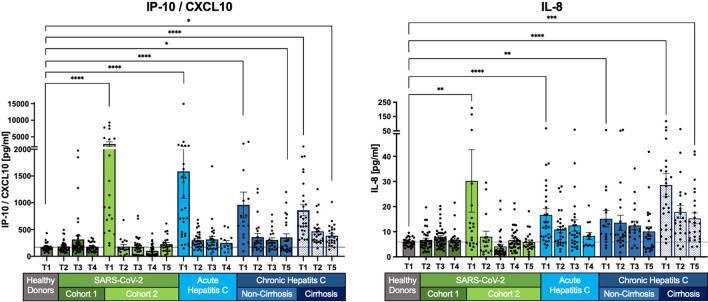
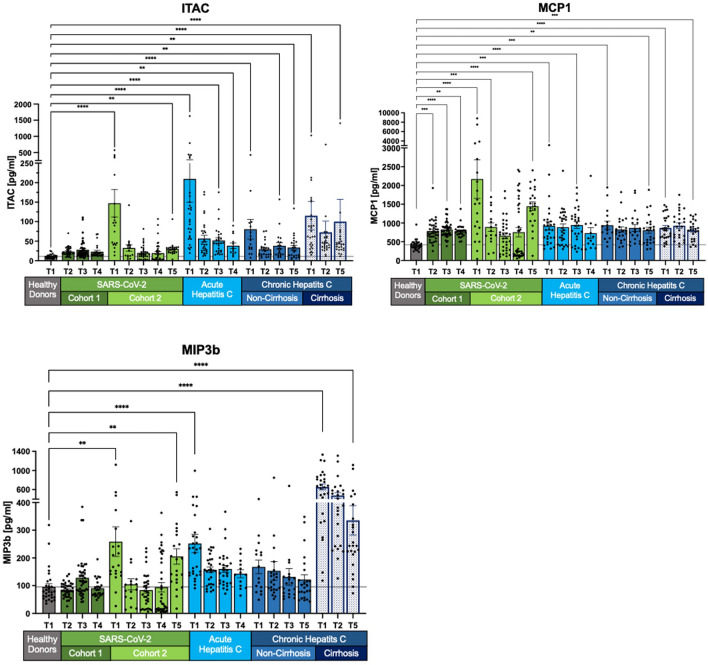
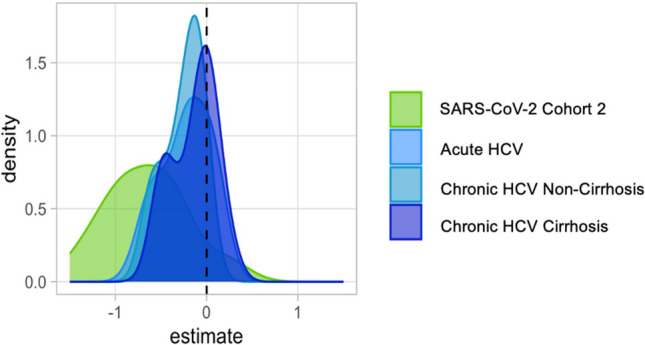
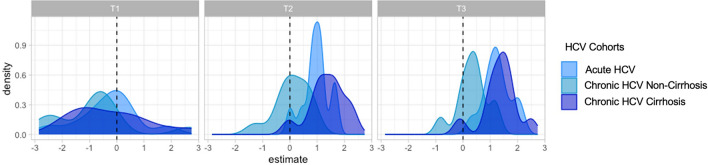
Viral infections can be acute or chronic, with the immune system pivotal in immunopathogenesis. The potential reversibility of inflammation post-viral elimination is of current interest. This study compares the dynamics of soluble inflammatory mediators (SIM) during and after respiratory infections with SARS-CoV-2 and blood-borne acute and chronic hepatitis C virus (HCV) infections. The study included patients with acute HCV (n = 29), chronic HCV (n = 54), and SARS-CoV-2 (n = 39 longitudinal, n = 103 cross-sectional), along with 30 healthy controls. Blood samples were collected at baseline, end of treatment/infection, and during follow-up (up to 9 months). SIMs were quantified using the HD-SP-X Imaging and Analysis System™. At baseline, SIM profiles in acute SARS-CoV-2 and HCV infections were significantly elevated compared with controls. During follow-up, SIM decline was less pronounced in acute and chronic HCV infections after successful therapy than in SARS-CoV-2 infections. Most SIM in the SARS-CoV-2 cohort normalized within 3 months. In chronic HCV, SIM were higher in cirrhotic than noncirrhotic patients post-HCV elimination. Dynamics of SIM after viral elimination vary between blood-borne acute and chronic HCV infections and respiratory SARS-CoV-2 infections. Immunological imprints 3-9 months after HCV elimination appear more pronounced than after SARS-CoV-2 infection.

Keywords: COVID-19; Chemokines; Cirrhosis; Cytokines; Direct-acting antiviral; Hepatitis C virus; Immune mediators; Inflammation; Long-COVID; Proteomics; SARS-CoV-2 infection; Sustained virological response.


Conflict of interest statement

Declarations. Competing interests: The authors declare no competing interests.

Figures

Fig. 1
Fig. 1
Soluble inflammatory mediators (SIM) over time in SARS-CoV-2 and HCV cohorts. A logarithmic scale heatmap illustrating the concentrations of individual cytokines and chemokines relative to the corresponding median concentrations at different time points (T1-4). Dark blue represents decreased SIM concentrations, while dark brown indicates increased SIM concentrations. Healthy donor levels at T1 are maintained across all time points. T1 corresponds to baseline (start of therapy/positive PCR result), T2 = 3 months, T3 = 6 months, and T4 = 9 months. Notably, data for the long-term follow-up (T5) are presented for the chronic HCV cohort with cirrhosis, as T4 data is missing.
Fig. 2
Fig. 2
Decline of selected SIM levels across all cohorts except chronic HCV with cirrhosis. IL-10, IL-22, TNFα, IFNγ, and IL-6 displayed normalization in SARS-CoV-2 cohort 2. Acute HCV patients exhibited overall increased SIM levels. Non-cirrhotic HCV patients returned to healthy levels after achieving sustained virologic response (SVR). However, chronic cirrhotic HCV patients showed persistent SIM levels with no significant change compared to T1. Measurements are presented as the mean with standard error. The Kruskal–Wallis test with Dunn’s correction was applied for comparisons between healthy donors and the different cohorts at T1 and the last follow-up. Two-tailed p-values were considered significant at < 0.05 (*), < 0.01 (**), < 0.001 (***) and < 0.0001 (****).
Fig. 3
Fig. 3
Normalization of selected SIM levels across most cohorts, persistent elevation in chronic HCV with cirrhosis. IL-8 and IP-10/CXCL10 levels normalize to healthy levels in SARS-CoV-2, acute HCV, and non-cirrhotic HCV patients. However, chronic HCV patients with cirrhosis show an initial decrease, followed by persistent elevation, without full recovery. Measurements are shown as the mean with the standard error of the mean. The Kruskal–Wallis test with Dunn’s correction was applied to compare healthy donors and the different cohorts at T1 and the last follow-up. Two-tailed P values < 0.05 (*), < 0.01 (**), < 0.001 (***) and < 0.0001 (****) were considered significant.
Fig. 4
Fig. 4
Prolonged elevation of chemokines MCP1, ITAC, and MIP-3β in SARS-CoV-2 and HCV patients. In SARS-CoV-2 cohort 2, MCP1, ITAC and MIP-3β levels initially decline, before increasing again. In HCV patients, SIM levels decrease compared to healthy controls but remain elevated, with significant discrepancies in concentration levels depending on the stage of HCV infection. Measurements are shown as mean with its standard error. Kruskal–Wallis with Dunn’s correction has been used for the healthy donors and the different cohorts at T1 and the last follow-up. Two-tailed P values < 0.05 (*), < 0.01 (**), < 0.001 (***) and < 0.0001 (****) were considered significant.
Fig. 5
Fig. 5
Time-adjusted distribution of Log2-transformed SIM estimates across cohorts, evaluated with age and sex as covariates. Distribution of estimate for the SIM evaluated for each cohort per time. All the SIM measurements were log2 transformed. For each cohort, linear models were fitted for each SIM, where SIM expression was evaluated with age, sex, and time as covariates. Time was taken as a continuous covariate. A density plot estimate for time variable for each cohort was plotted.
Fig. 6
Fig. 6
Density plots of Log2-transformed SIM estimates at T1, T2, and T3 across HCV cohorts compared to SARS-CoV-2 Cohort 2 baseline. Distribution of estimate for SIM for each time point evaluated across cohorts, with SARS-CoV-2 cohort 2 as baseline cohort. All the SIM measurements were log2 transformed. For each of the three-time points evaluated (T1, T2, T3), linear models were fitted for each SIM, where SIM expression was evaluated with age, sex and cohort as covariates. Each HCV cohort for each time point was evaluated, with SARS-CoV-2 cohort 2 samples were taken as a baseline for comparison. A density plot estimate was plotted for each time point and for the three HCV cohorts evaluated against the SARS-CoV-2 cohort 2.

References

    1. Narasimhan, H., Wu, Y., Goplen, N. P. & Sun, J. Immune determinants of chronic sequelae after respiratory viral infection. Sci. Immunol.7, eabm7996 (2022). - PubMed
    1. Davis, H. E., McCorkell, L., Vogel, J. M. & Topol, E. J. Long COVID: major findings, mechanisms and recommendations. Nat. Rev. Microbiol.21, 133–146 (2023). - PMC - PubMed
    1. Altmann, D. M., Whettlock, E. M., Liu, S., Arachchillage, D. J. & Boyton, R. J. The immunology of long COVID. Nat. Rev. Immunol.10.1038/s41577-023-00904-7 (2023). - PubMed
    1. Ballering, A. V., van Zon, S. K. R., Olde Hartman, T. C., Rosmalen, J. G. M., Lifelines Corona Research Initiative. Persistence of somatic symptoms after COVID-19 in the Netherlands: an observational cohort study. Lancet400, 452–461 (2022). - PMC - PubMed
    1. Oberfeld, B. et al. SnapShot: COVID-19. Cell181, 954-954.e1 (2020). - PMC - PubMed

Substances