. 2025 Feb;22(2):348-357.
doi: 10.1038/s41592-024-02513-1. Epub 2024 Nov 22.

CelloType: a unified model for segmentation and classification of tissue images

Affiliations

CelloType: a unified model for segmentation and classification of tissue images

Minxing Pang et al. Nat Methods. 2025 Feb.

Abstract

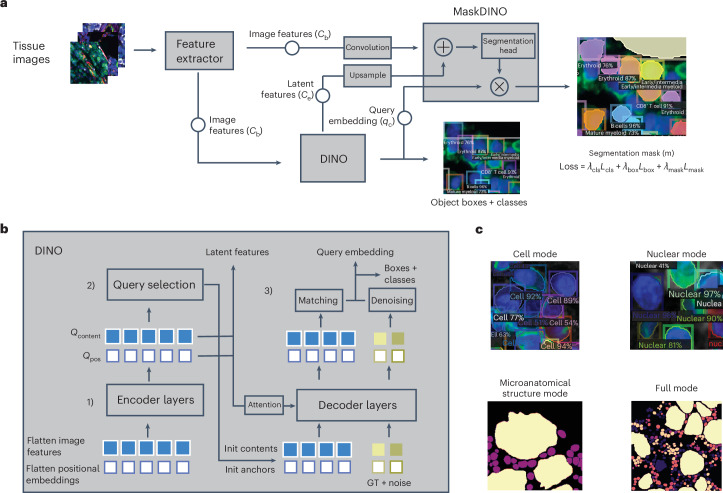
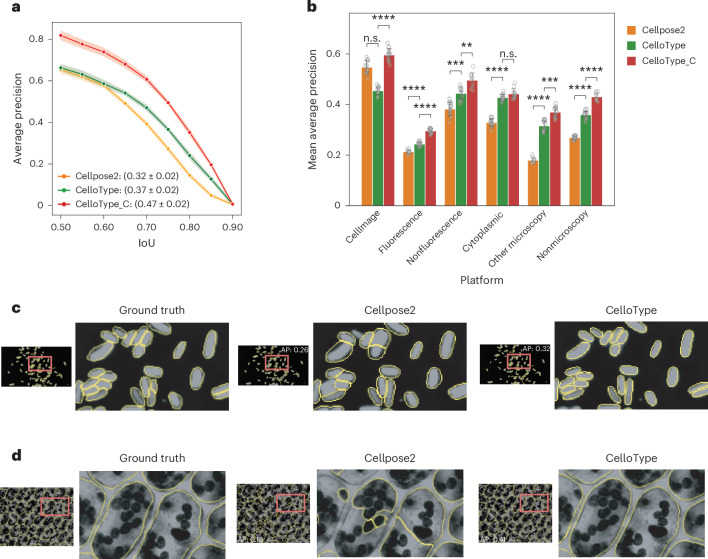
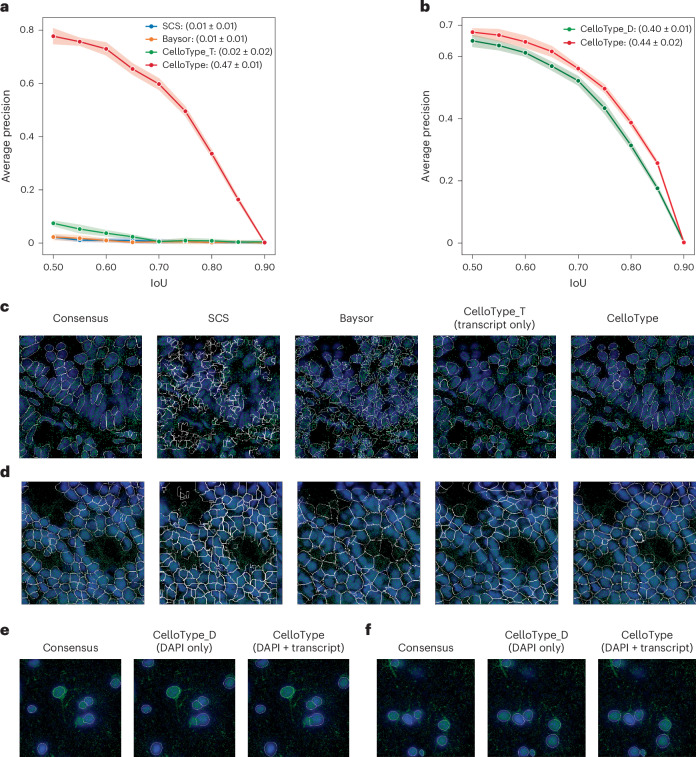
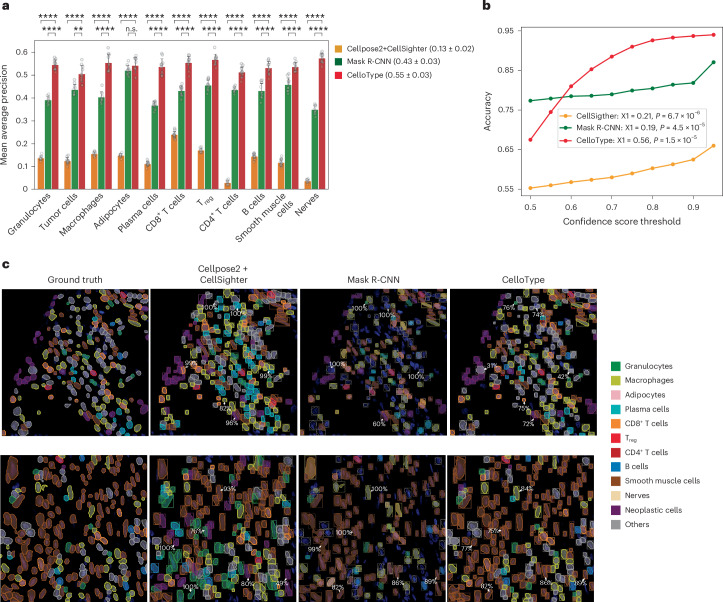
Cell segmentation and classification are critical tasks in spatial omics data analysis. Here we introduce CelloType, an end-to-end model designed for cell segmentation and classification for image-based spatial omics data. Unlike the traditional two-stage approach of segmentation followed by classification, CelloType adopts a multitask learning strategy that integrates these tasks, simultaneously enhancing the performance of both. CelloType leverages transformer-based deep learning techniques for improved accuracy in object detection, segmentation and classification. It outperforms existing segmentation methods on a variety of multiplexed fluorescence and spatial transcriptomic images. In terms of cell type classification, CelloType surpasses a model composed of state-of-the-art methods for individual tasks and a high-performance instance segmentation model. Using multiplexed tissue images, we further demonstrate the utility of CelloType for multiscale segmentation and classification of both cellular and noncellular elements in a tissue. The enhanced accuracy and multitask learning ability of CelloType facilitate automated annotation of rapidly growing spatial omics data.


Conflict of interest statement

Competing interests: The authors declare no competing interests.

Figures

Fig. 1
Fig. 1. Overview of CelloType.
a, The overall architecture, input and output of CelloType. First, a Transformer-based feature extractor is employed to derive multiscale features (Cb) from the image. Second, using a Transformer-based architecture, the DINO object detection module extracts latent features (Ce) and query embeddings (qc) that are combined to generate object detection boxes with cell type labels. Subsequently, the MaskDINO module integrates the extracted image features with DINO’s outputs, resulting in detailed instance segmentation and cell type classification. During training, the model is optimized on the basis of an overall loss function (Loss) that considers losses based on cell segmentation mask (λmaskLmask), bounding box (λboxLbox) and cell type label (λclsLcls). b, The input, output and architecture of the DINO module. The DINO module consists of a multilayer transformer and multiple prediction heads. DINO starts by flattening the multiscale features from the transformer-based feature extractor. These features are merged with positional embeddings to preserve spatial context (step 1). DINO then employs a mixed query selection strategy, initializing positional queries (Qpos) as anchor detection boxes and maintaining content queries (Qcontent) as learnable features, thus adapting to the diverse characteristics of cells (step 2). The model refines these anchor boxes through decoder layers using deformable attention mechanism and employs contrastive denoising training by introducing noise to ground-truth (GT) labels and boxes to improve robustness and accuracy. Then, a linear projection acts as the classification branch to produce the classification results for each box (step 3). c, The multiscale ability of CelloType. CelloType is versatile and can perform a range of end-to-end tasks at different scales, including cell segmentation, nuclear segmentation, microanatomical structure segmentation and full instance segmentation with corresponding class annotations.
Fig. 2
Fig. 2. Evaluation of segmentation accuracy using TissueNet datasets.
a, A line plot showing AP across IoU thresholds for cell segmentation by Mesmer, Cellpose2, CelloType and CelloType_C (CelloType with confidence score). Each data point represents the average AP from a 10-fold cross-validation experiment. Band width around each line represents the standard deviation. The mean and standard deviation of average AP values across IoU thresholds are shown in the parentheses. b, AP across IoU thresholds for nuclear segmentation. The band width around each line represents the standard deviation. c, The performance of methods stratified by imaging platform and tissue type. Each grouped barplot is overlaid with ten data points, representing the results of a 10-fold cross-validation. The error bar represents the standard deviation. The top left grouped barplot shows mean AP values for cell segmentation stratified by imaging platform, including CODEX, CyCIF, IMC, MIBI, MxIF and Vertra. The top right grouped barplot shows mean AP values for cell segmentation stratified by tissue type, including breast, gastrointestinal, immune, pancreas and skin. The second row of grouped barplots shows mean AP values for nuclear segmentation. Statistical significance is indicated as follows: ****P < 1 × 10−4, ***P < 1 × 10−3, **P < 1 × 10−2, *P < 0.05. P values were computed using one-sided Student’s t-test (Supplementary Tables 5–8). d, Representative examples of cell segmentation of immune tissue imaged using Vectra platform. Blue, nuclear signal; green, cell membrane signal; white, cell boundary. The red box highlights a representative region that the methods perform differently. A zoomed-in view of the highlighted image area is shown to the right of the full image. The image-level AP scores are shown on the images. e, Representative examples of nuclear segmentation of gastrointestinal tissue using the IMC platform.
Fig. 3
Fig. 3. Evaluation of segmentation accuracy using the Cellpose Cyto dataset.
a, A line plot showing AP across IoU thresholds for cell segmentation for Cellpose2, CelloType and CelloType_C (CelloType with confidence score). Each data point represents the average AP from a 10-fold cross-validation experiment. The band width around each line represents the standard deviation. The mean and standard deviation of average AP values across IoU thresholds are shown in the parentheses. b, The performance of methods stratified by image type. The mean AP values of Cellpose2, CelloType and CelloType_C are stratified by imaging modality and cell type. Each grouped barplot is overlaid with ten data points, representing the results of a 10-fold cross-validation. The error bar represents the standard deviation. The test dataset comprises microscopy and nonmicroscopy images from the Cellpose Cyto dataset that comprises six subsets, including cells (Cell Image Library), cells (fluorescence), cells (nonfluorescence), cells (membrane), other microscopy and nonmicroscopy. Statistical significance is indicated as follows: ****P < 1 × 10−4, ***P < 1 × 10−3, **P < 1 × 10−2, *P < 0.05. P values were computed using one-sided Student’s t-test (Supplementary Table 10). c, Representative examples of cell segmentation of a microscopy image by the compared methods. The red boxes highlight a representative region that the methods perform differently. A zoomed-in view of the highlighted image area is shown to the right of the full image. Image-level AP scores are shown on the images. d, Representative examples of cell segmentation of a nonfluorescence image by the compared methods.
Fig. 4
Fig. 4. Evaluation of segmentation accuracy on spatial transcriptomics data.
a, A line plot showing AP across IoU thresholds for cell segmentation using Xenium data by SCS, Baysor, CelloType_T (use transcript signal only) and CelloType (use transcript plus DAPI signals). Each data point represents the average AP from a 10-fold cross-validation experiment. The band width around each line represents the standard deviation. The mean and standard deviation of average AP values across IoU thresholds are shown in the parentheses. b, A line plot showing AP values across IoU thresholds for nuclear segmentation using MERFISH data. CelloType_D (use DAPI signal only) and CelloType (use transcript plus DAPI signals). c, Representative results of cell segmentation of human lung tissue imaged using Xenium protocol. Blue, nuclear signal (DAPI); green, transcripts signal; white, cell boundary. d, Representative results of cell segmentation of mouse colon tissue imaged using the MERFISH protocol. e,f, Two representative results of nuclear segmentation of human brain tissue imaged using the MERFISH protocol.
Fig. 5
Fig. 5. CelloType performs joint segmentation and cell type classification.
a, A grouped barplot showing mean AP values for cell type predictions by the compared methods. The bar height represents mean values for each cell type from a 10-fold cross-validation experiment. Each grouped barplot is overlaid with ten data points, representing the results of a 10-fold cross-validation. The error bar represents the standard deviation. The average values across cell types are shown in the parentheses. Statistical significance is indicated as follows: ****P < 1 × 10−4, ***P < 1 × 10−3, **P < 1 × 10−2, *P < 0.05. P values were computed using one-sided Student’s t-test (Supplementary Table 13). b, A line plot showing the relationship between classification accuracy and confidence score threshold by the compared methods. X1, fitted coefficient for linear regression between classification accuracy and confidence score; pval, P value for the coefficient. c, Representative examples of cell segmentation and classification results using the colorectal cancer CODEX dataset. Each row represents a 200 × 200 pixel FOV of a CODEX image. Each FOV shows predicted cell segmentation masks (boxes) and cell types (colors). Ground truth, manually annotated cell types; Cellpose2 + CellSighter, cell segmentation by Cellpose2 followed by cell type classification by CellSighter. Randomly selected confidence scores for cell classification computed by the compared methods are displayed next to the predicted instances.
Fig. 6
Fig. 6. CelloType supports joint multiscale segmentation and classification.
a, A grouped barplot showing AP stratified by cell and microanatomic structure type. Each grouped barplot is overlaid with five data points, representing the results of a 5-fold cross-validation. The bar height represents mean values from a 5-fold cross-validation experiment. The error bar represents the standard deviation. pDCs, plasmacytoid dendritic cells. b, A line plot showing the relationship between classification accuracy and confidence score threshold. X1, fitted coefficient for linear regression between classification accuracy and confidence score; pval, P value for the coefficient. c, Representative examples of multiscale segmentation and classification using human bone marrow CODEX data. The first row of images shows an example of bone marrow area consisting of various types of smaller hematopoietic cella and much larger adipocytes. The second row of images shows an example of bone marrow area consisting of various hematopoietic cell types and microanatomic structures such as trabecula bone fragments. Randomly selected confidence scores for cell classification are displayed next to the predicted instances.
Extended Data Fig. 1
Extended Data Fig. 1. Image level segmentation performance of compared methods.
a) Boxplots of image-level mean average precision (AP) for cell segmentation (left panel) and nuclear segmentation (right panel) stratified by experimental platforms. The box represents the interquartile range (IQR), with its lower bound indicating the 25th percentile and the upper bound indicating the 75th percentile. Whiskers extend from the box to show the range of the data, with the lower whisker extending to the minimum value (or to the smallest data point within 1.5 times the IQR) and the upper whisker extending to the maximum value (or to the largest data point within 1.5 times the IQR). The number of images in the test dataset for each platform is as following: CODEX (397), CycIF (322), IMC (16), MIBI (248), MxIF (87), and Vectra (179). Statistical significance is indicated as following: **** p-value < 1e-4, *** p-value < 1e-3, ** p-value < 1e-2, * p-value < 0.05. P-valued were computed using one-sided Student’s t-test (Supplementary Table 5). b-c) Scatter plots of image-level relationship between cell size and segmentation accuracy. Each data point represents an image. X-axis, average diameter of cells in an image. Y-axis, ratio of the number of predicted cells to the number of true cells in the dataset (n_pred/n_cell). d-e) Scatter plots of image-level relationship between cell size and segmentation recall rate. Each data point represents an image. X-axis, average diameter of cells in an image. Y-axis, mean recall rate across the IoU threshold range (0.5–0.9).
Extended Data Fig. 2
Extended Data Fig. 2. Additional segmentation performance characteristics of compared methods.
a) CelloType performance using varying amount of training data. AP and AP50 values as a function of the amount of training data. CelloType was trained using various amounts of the training data from the TissueNet (left) and Cellpose Cyto (right) datasets. b) Memory usage and running time of the compared methods on the TissueNet (top) and Cellpose Cyto (bottom) datasets. Benchmarking experiments were run using a Dell workstation with an Intel Xeon 6342 CPU (24 cores) and 4 Nvidia A100 GPUs.
Extended Data Fig. 3
Extended Data Fig. 3. Performance benchmarking of Cellpose2 and CellSighter for separate task.
Each method was evaluated for its originally intended task, namely Cellpose2 for segmentation and CellSighter for cell classification. Colorectal cancer CODEX dataset was used for benchmarking purpose. a) AP value of segmentation across a range of IoU thresholds. Each data point represents the average AP from a 10-fold cross-validation experiment. Band width around each line represents the standard deviation. Mean and standard deviation of average AP values across IoU thresholds are shown in the parenthesis. b) Heatmap showing the confusion matrix of CellSighter cell type classification results. Ground truth cell segmentation masks were used as input to CellSighter. Each grid in the heatmap includes an accuracy score and the count of cells. c) Barplot showing the precision for each class identified by the CellSighter model based on the ground truth cell segmentation mask, with an overall mean precision of 0.53.
Extended Data Fig. 4
Extended Data Fig. 4. Additional classification performance characteristics of CelloType.
a) Mean average precision as a function of the number of classes in CODEX CRC (top) and bone marrow (bottom) datasets. b) Scatter plot of the number of cells for each cell type and AP performance using the CODEX CRC (top) and bone marrow (bottom) datasets. The linear regression line is shown with the 0.95 confidence interval bands. c) Memory usage and running time of the compared methods on the CODEX CRC dataset. d) Training time as a function of the number of classes in the CODEX CRC dataset. Seg, segmentation. Cla, classification. The linear regression line is displayed with 0.95 confidence interval bands. Benchmarking experiments were run using a HPC node with an Intel Xeon 6342 CPU (24 cores) and 4 Nvidia A100 GPUs.

Update of

References

    1. Bressan, D., Battistoni, G. & Hannon, G. J. The dawn of spatial omics. Science381, eabq4964 (2023). - PMC - PubMed
    1. Rozenblatt-Rosen, O. et al. The Human Tumor Atlas Network: charting tumor transitions across space and time at single-cell resolution. Cell181, 236–249 (2020). - PMC - PubMed
    1. Hu, B. C. et al. The human body at cellular resolution: the NIH Human Biomolecular Atlas Program. Nature574, 187–192 (2019). - PMC - PubMed
    1. Greenwald, N. F. et al. Whole-cell segmentation of tissue images with human-level performance using large-scale data annotation and deep learning. Nat. Biotechnol.40, 555–565 (2022). - PMC - PubMed
    1. He, K., Zhang, X., Ren, S. & Sun, J. I. Deep residual learning for image recognition. In 2016 IEEE Conference on Computer Vision and Pattern Recognition 770–778 (IEEE, 2016).

LinkOut - more resources