. 2024 Nov 22;7(1):1556.
doi: 10.1038/s42003-024-07256-5.

Claustrum modulation drives altered prefrontal cortex dynamics and connectivity

Affiliations

Claustrum modulation drives altered prefrontal cortex dynamics and connectivity

Ryan Zahacy et al. Commun Biol. .

Abstract

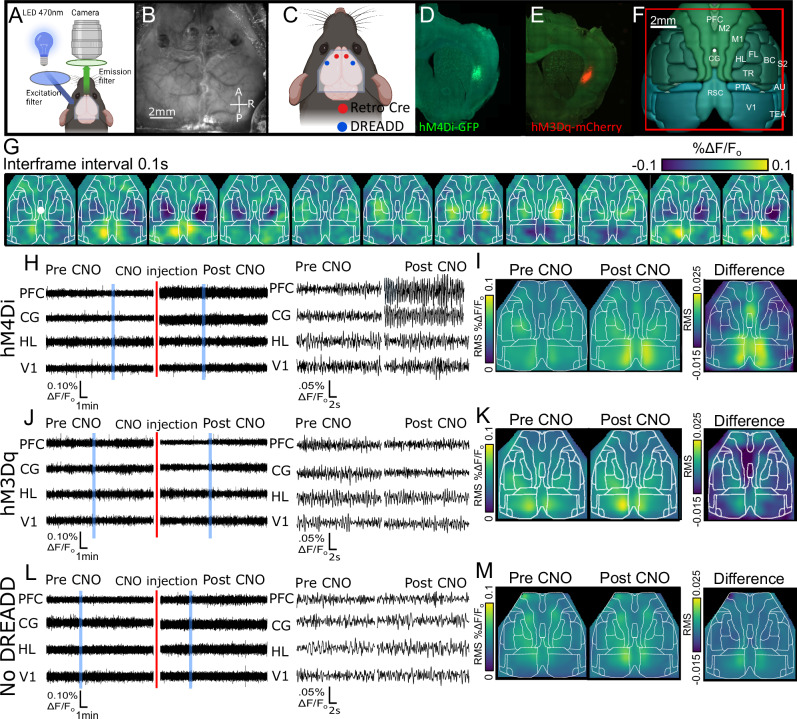
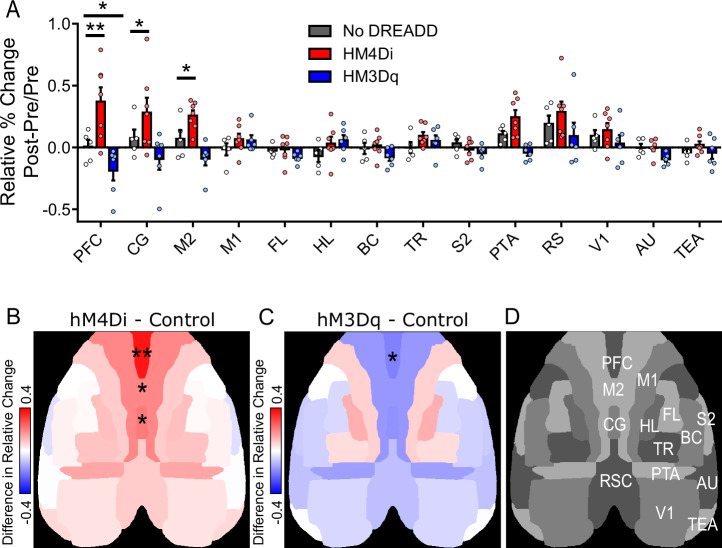
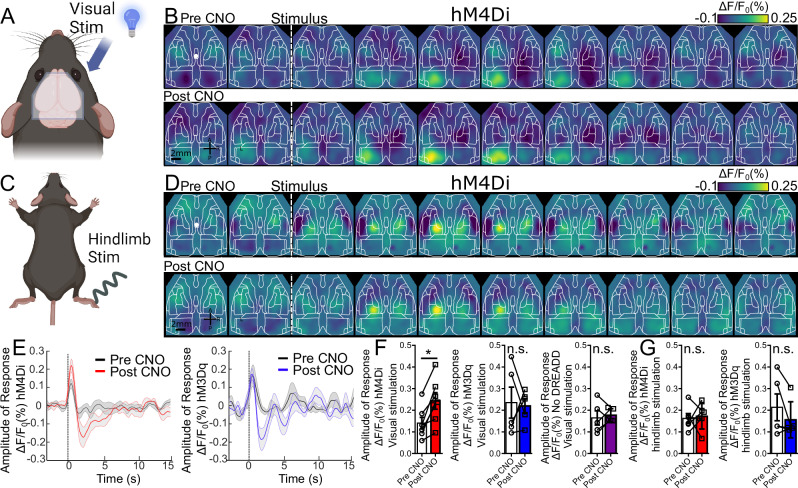
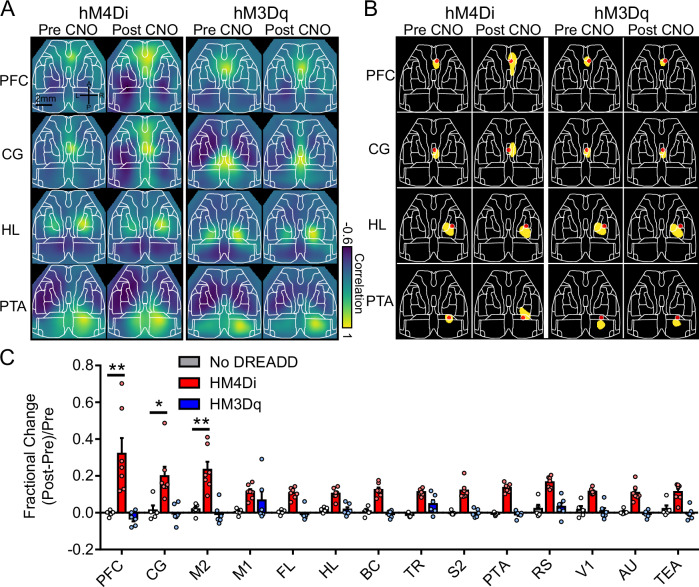
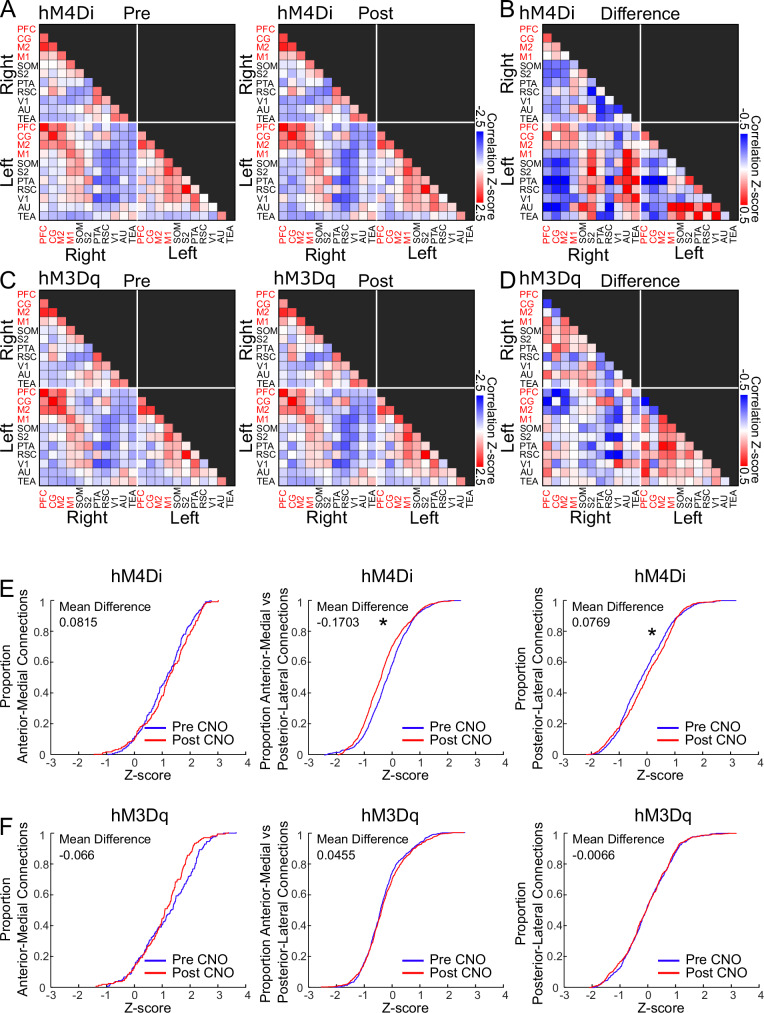
This study delves into the claustrum's role in modulating spontaneous and sensory-evoked network activity across cortical regions. Using mesoscale calcium imaging and Gi and Gq DREADDs in anesthetized mice, we show that decreasing claustral activity enhances prefrontal cortical activity, while activation reduces prefrontal cortical activity. This claustrum modulation also caused changes to the brain's large-scale functional networks, emphasizing the claustrum's ability to influence long-range functional connectivity in the cortex. Claustrum inhibition increased the local coupling between frontal cortex areas, but reduced the correlation between anterior medial regions and lateral/posterior regions, while also enhancing sensory-evoked responses in the visual cortex. These findings indicate the claustrum can participate in orchestrating neural communication across cortical regions through modulation of prefrontal cortical activity. These insights deepen our understanding of the claustrum's impact on prefrontal connectivity, large-scale network dynamics, and sensory processing, positioning the claustrum as a key node modulating large-scale cortical dynamics.


Conflict of interest statement

Competing interests: The authors declare no competing interests.

Figures

Fig. 1
Fig. 1. Chemogenetic modulation of claustrum activity alters spontaneous cortical activity.
A Schematic diagram of imaging apparatus. Created in BioRender. Chan, A. (2024) https://BioRender.com/q38p689. B Example of imaging field-of-view revealing the surface of the dorsal neocortex through glass coverslip. Compass directions are as follows: A: anterior, L: left, R: right, P: posterior. C Schematic diagram illustrating approximate DREADD (blue) and retro-Cre (red) injection locations. Created Created in BioRender. Chan, A. (2024) https://BioRender.com/q38p689 BioRender.com. D Coronal brain sections illustrating region-specific expression of the hM4Di DREADD injection locations indicated by GFP. E Coronal brain sections illustrating region-specific expression of the hM3Dq DREADD injection locations indicated by mCherry. F Schematic of cortical regions-of-interest (ROI) based on Allen Brain Institute 3D Brain Explorer. The red box indicates the approximate imaging field-of-view. The ROIs are labeled on the map and are as follows: Prefrontal cortex (PFC), Cingulate cortex (CG), Secondary motor cortex (M2), Primary motor cortex (M1), Forelimb (FL), Hindlimb (HL), Barrel cortex (BC), Trunk (TR), Secondary somatosensory cortex (S2), Parietal association cortex (PTA), Retrosplenial cortex (RS), Primary visual cortex (V1), Auditory cortex (AU), Temporal association cortex (TEA). G Montage illustrating cortex-spanning, regional spontaneous cortical calcium activity with an inter-frame interval of 0.1 s. The white overlay is an outline of the cortical regions identified in F. The white dot denotes position of the bregma. H Time course of a continuous 15-minute recording of spontaneous cortical activity from an hM4Di injected mouse showing activity from the PFC, CG, HL, and V1 regions. The vertical red line denotes the time point at which CNO (5 mg kg−1 i.p.) was administered, allowing observation of activity prior to and following CNO administration. The shaded blue areas indicate the segments of the recording incorporating Pre-CNO and Post-CNO activity which are expanded and shown in detail in the right panel. Note elevated activity in PFC and CG. I Mean cortical activity map created by computing the pixel-wise root-mean-square (RMS) values across hM4Di injected mice (n = 7), showing the topography of spontaneous activity in the imaging field of view before and after CNO (5 mg kg−1 i.p.) administration. The left panel represents pre-CNO activity, while the right panel shows post-CNO activity, highlighting changes in spontaneous activity. The rightmost panel indicates the difference in RMS values between the two conditions, with higher values indicating greater increases in RMS activity. J As in H, time course of a continuous 15-minute recording of spontaneous cortical activity from an hM3Dq injected mouse showing activity from the PFC, CG, HL, and V1 regions. The vertical red line denotes the time point at which CNO (5 mg kg−1i.p.) was administered, allowing observation of activity prior to and following CNO administration. The shaded blue areas indicate the segments of the recording incorporating Pre-CNO and Post-CNO activity which are expanded and shown in detail in the right panel. Note decreased activity in PFC and CG. K Mean cortical activity map created by computing the pixel-wise root-mean-square (RMS) values across hM3Dq injected mice (n = 6), showing the topography of spontaneous activity in the imaging field of view before and after CNO (5 mg kg−1 i.p.) administration. The left panel represents pre-CNO activity, while the right panel shows post-CNO activity, highlighting changes in spontaneous activity. The rightmost panel indicates the difference in RMS values between the two conditions, with higher values indicating greater increases in RMS activity. L As in H, time course of a continuous 15-minute recording of spontaneous cortical activity from a control, NoDREADD mouse showing activity from the PFC, CG, HL, and V1 regions. The vertical red line denotes the time point at which CNO (5 mg kg−1g i.p.) was administered, allowing observation of activity prior to and following CNO administration. The shaded blue areas indicate the segments of the recording incorporating Pre-CNO and Post-CNO activity which are expanded and shown in detail in the right panel. Note no change in activity PFC, CG, HL, and V1. M Mean cortical activity map created by computing the pixel-wise root-mean-square (RMS) values across No DREADD control mice (n = 5), showing the topography of spontaneous activity in the imaging field of view before and after CNO (5 mg kg−1 i.p.) administration. The left panel represents pre-CNO activity, while the right panel shows post-CNO activity, highlighting changes in spontaneous activity. The rightmost panel indicates the difference in RMS values between the two conditions, with higher values indicating greater increases in RMS activity.
Fig. 2
Fig. 2. Claustrum inhibition and activation cause bidirectional changes in frontal cortical activity.
A Summary of the fractional change in spontaneous cortical activity, shown as percent change of RMS, for selected ROIs comparing the Pre and Post CNO administration time points among control animals with no DREADDs (white, n = 5), hM4Di animals (red, n = 7), and hM3Dq animals (blue, n = 6). Error bars represent the standard error of the mean. Statistical analysis was performed using a two-way ANOVA with Dunnett’s Test for multiple comparisons. *P ≤ 0.05, **P ≤ 0.01. The No DREADD control condition refers to animals that were not injected with DREADDs but received CNO. Regions-of-interest depicted on the x-axis are as follows: Prefrontal cortex (PFC), Cingulate cortex (CG), Secondary motor cortex (M2), Primary motor cortex (M1), Forelimb (FL), Hindlimb (HL), Barrel cortex (BC), Trunk (TR), Secondary somatosensory cortex (S2), Parietal association cortex (PTA), Retrosplenial cortex (RS), Primary visual cortex (V1), Auditory cortex (AU), Temporal association cortex (TEA). B Cortical activity map showing increased regional changes in spontaneous cortical activity (RMS) in CNO-administered hM4Di animals (n = 7), calculated by subtracting the CNO-induced relative change in RMS values of the No DREADD control condition (n = 5). Red values indicate increases in activity, while blue values indicate decreases in activity following CNO administration. Asterisks denote regions with significant changes in activity (RMS), determined in A, using a two-way ANOVA with Dunnett’s Test for multiple comparisons. *P ≤ 0.05, **P ≤ 0.01. C As in B, cortical activity map showing regional changes in spontaneous cortical activity (RMS) in CNO-administered hM3Dq animals (n = 6), calculated by subtracting the relative change in RMS values of the No DREADD control condition (n = 5). Red values indicate increases in activity, while blue values indicate decreases in activity following CNO administration. Asterisk denotes region with significant changes in activity (RMS), determined in A, using a two-way ANOVA with Dunnett’s Test for multiple comparisons. *P ≤ 0.05. D Labeled right-hemisphere parcellated cortical regions of interest based on Allen Brain Institute 3D Brain Explorer ROIs - Prefrontal cortex (PFC), Cingulate cortex (CG), Secondary motor cortex (M2), Primary motor cortex (M1), Forelimb (FL), Hindlimb (HL), Barrel cortex (BC), Trunk (TR), Secondary somatosensory cortex (S2), Parietal association cortex (PTA), Retrosplenial cortex (RS), Primary visual cortex (V1), Auditory cortex (AU), Temporal association cortex (TEA).
Fig. 3
Fig. 3. Claustrum inhibition increases the amplitude of visual-evoked cortical response.
A Schematic of visual sensory stimulation; Visual stimulation delivered as a 5 ms blue light flash to the right eye. Created in BioRender. Chan, A. (2024) https://BioRender.com/t51h498. B Montage of mean (average of 20 trials) visual stimulation-evoked cortical activity in an hM4Di injected mouse, shown before (top, Pre CNO) and after (bottom, Post CNO) CNO injection. Note the region-specific activation in the contralateral visual cortex. Each frame represents a 200 ms interval. The white circle marks the position of the bregma, and the vertical dashed line indicates the timing of the stimulus event. C Schematic of hindlimb sensory stimulation delivered via piezoelectric actuator to the right hindlimb. Created in BioRender. Chan, A. (2024) https://BioRender.com/t51h498. D As in B, montage of mean (average of 20 trials) hindlimb stimulation-evoked cortical activity in an hM4Di injected mouse, shown before (top, Pre CNO) and after (bottom, Post CNO) CNO injection. Note the region-specific activation of the hindlimb representation in the contralateral primary somatosensory cortex. Each frame represents a 200 ms interval. The white circle marks the position of the bregma, and the vertical dashed line indicates the timing of the stimulus event. E Mean time courses for visual-evoked cortical activity measured from the contralateral primary visual cortex show elevated responses following CNO administration in hM4Di-injected mice (left, n = 7), but no change following CNO administration in hM3Dq-injected mice (right, n = 5). In the hM4Di group, pre-CNO condition is shown in black and post-CNO in red. In the hM3Dq group, pre-CNO condition is shown in black and post-CNO in blue. Shaded areas represent the standard error of the mean. F Summary of change in peak visual-evoked cortical responses, prior to (Pre) and following (Post) CNO administration in mice injected with hM4Di (left, n = 7), hM3Dq (centre, n = 5), and No DREADD control animals (right, n = 5). Error bars indicate the standard error of the mean. Student’s paired t-test was used to compare means. Asterisk denotes P ≤ 0.05. G Summary of change in peak hindlimb-stimulation evoked cortical responses, prior to (Pre) and following (Post) CNO administration in mice injected with hM4Di (left, n = 6) or hM3Dq (right, n = 5). Error bars indicate the standard error of the mean. Student’s paired t-test was used to compare means. ‘n.s.’ denotes no significant change.
Fig. 4
Fig. 4. Chemogenetic claustrum inhibition increases local functional connectivity in PFC and medial cortices.
A Seed pixel maps local, relative functional connectivity generated from spontaneous cortical activity of PFC, CG, HL, and PTA from the right hemisphere before and following CNO administration in hM4Di (left) and hM3Dq mice (right). B Threshold area of high correlation for each ROI in indicated in panel A The red dot indicates the approximate location of seed pixel for shown ROIs. C Fractional change in the area of high correlation for each ROI compared the area in the Pre CNO recording for hM4Di (red, n = 7), hM3Dq (blue, n = 6) and No DREADD control mice (white, n = 5). Correlation values were calculated on a pixel-wise basis as outlined in the Methods section. All measurements are from right hemisphere ROIs. Error bars represent the standard error of the mean. Statistics were calculated using a two-way ANOVA with a Dunnett’s Test to correct for multiple comparisons. The No DREADD control condition is animals not injected with DREADDs but received CNO. *P ≤ 0.05, **P ≤ 0.01. PFC (F (13, 210) = 1.691, p = <0.0001), CG (F (13, 210) = 1.691, p = 0.0339), M2 (F (13, 210) = 1.691, p = 0. 0033).
Fig. 5
Fig. 5. Claustrum inhibition induces decoupling of functional connectivity between long-range cortical regions.
A Functional connectivity matrix of mean z-score correlation values derived from spontaneous activity from hM4Di (n = 7) Pre CNO (left), and Post CNO (right) administration. Left and right denoted quadrants represent left and right cortical hemispheres, respectively. Anterior-medial ROIs are indicated by red font; posterior-lateral ROIs are indicated by black font. SOM refers to somatosensory regions (FL, HL, BC, TR). B Difference matrix calculated between mean hM4Di Post CNO and Pre CNO z-score correlation matrices. SOM refers to somatosensory regions (FL, HL, BC, TR). C Mean z-score correlation matrix from hM3Dq (n = 6) Pre CNO (left), and Post CNO (right). Anterior-medial ROIs are indicated by red font; posterior-lateral ROIs are indicated by black font. SOM refers to somatosensory regions (FL, HL, BC, TR). D Difference matrix calculated between mean hM3Dq Post CNO and Pre CNO z-score correlation matrices. SOM refers to somatosensory regions (FL, HL, BC, TR). E Cumulative distribution function for connections within the anterior-medial ROIs (left), between anterior-medial and posterior-lateral ROIs, and within posterior-lateral ROIs (right) in hM4Di injected mice. n = 7 mice. F Cumulative distribution function for connections within the anterior-medial ROIs (left), between anterior-medial and posterior-lateral ROIs, and within posterior-lateral ROIs (right) in hM3Dq injected mice. n = 6 mice.

Similar articles

References

    1. Wang, Q. et al. Organization of the connections between claustrum and cortex in the mouse: Connections between mouse claustrum and cortex. J. Comp. Neurol.525, 1317–1346 (2017). - PMC - PubMed
    1. Norimoto, H. et al. A claustrum in reptiles and its role in slow-wave sleep. Nature578, 413–418 (2020). - PubMed
    1. Torgerson, C. M., Irimia, A., Goh, S. Y. M. & Van Horn, J. D. The DTI connectivity of the human claustrum: Claustrum Connectivity. Hum. Brain Mapp.36, 827–838 (2015). - PMC - PubMed
    1. Wang, Q. et al. Regional and cell-type-specific afferent and efferent projections of the mouse claustrum. Cell Rep.42, 10.1016/j.celrep.2023.112118 (2023). - PMC - PubMed
    1. White, M. G. et al. The Mouse Claustrum Is Required for Optimal Behavioral Performance Under High Cognitive Demand. Biol. Psychiatry88, 719–726 (2020). - PMC - PubMed

LinkOut - more resources