. 2024 Dec;6(12):2281-2299.
doi: 10.1038/s42255-024-01170-0. Epub 2024 Nov 22.

Pathogenic role of acyl coenzyme A binding protein (ACBP) in Cushing's syndrome

Affiliations

Pathogenic role of acyl coenzyme A binding protein (ACBP) in Cushing's syndrome

Hui Pan et al. Nat Metab. 2024 Dec.

Abstract

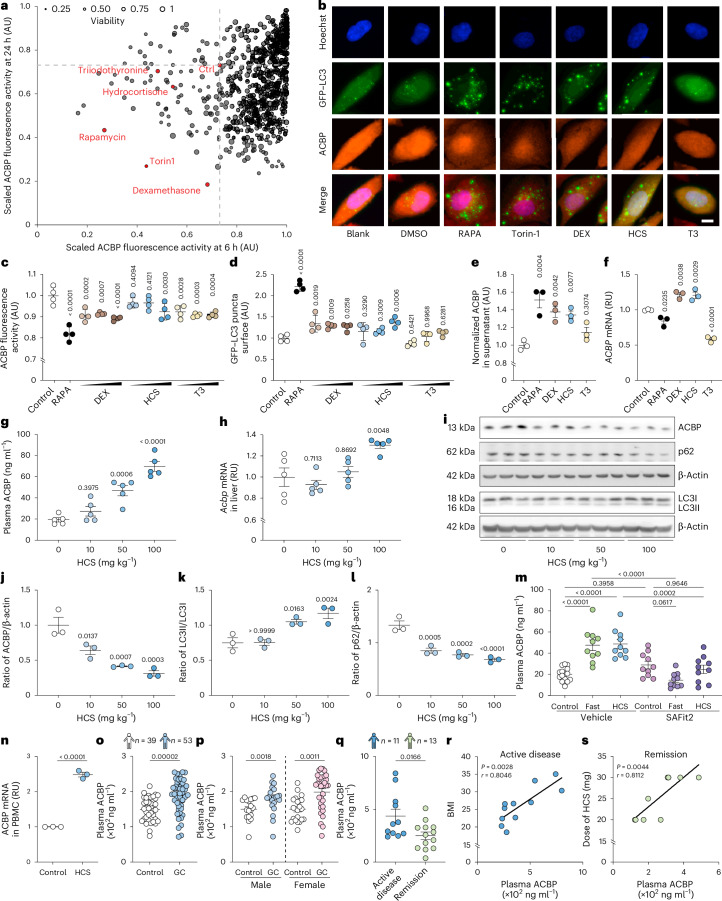
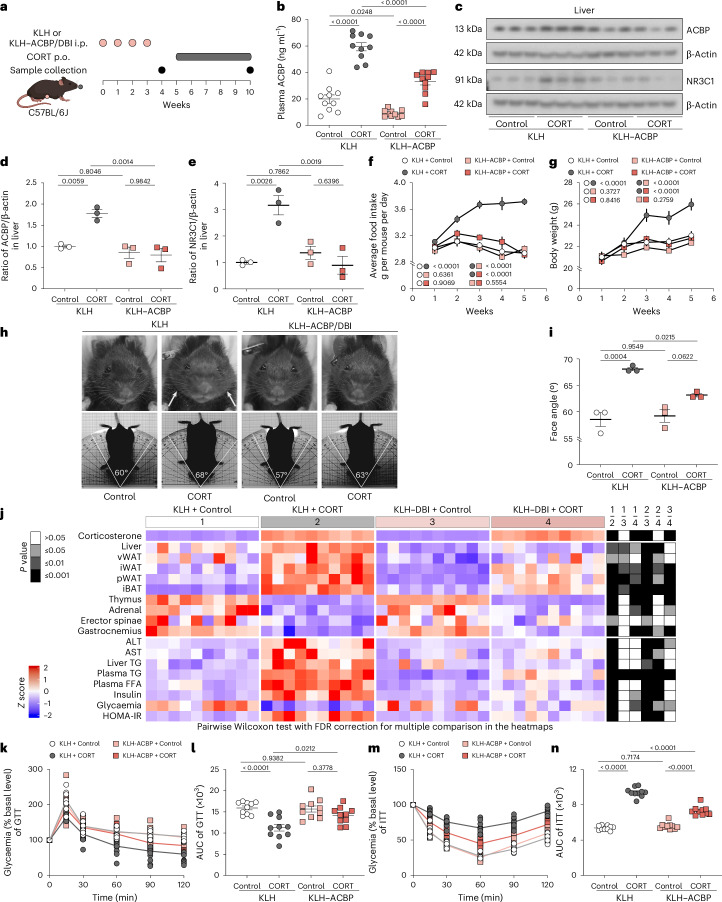
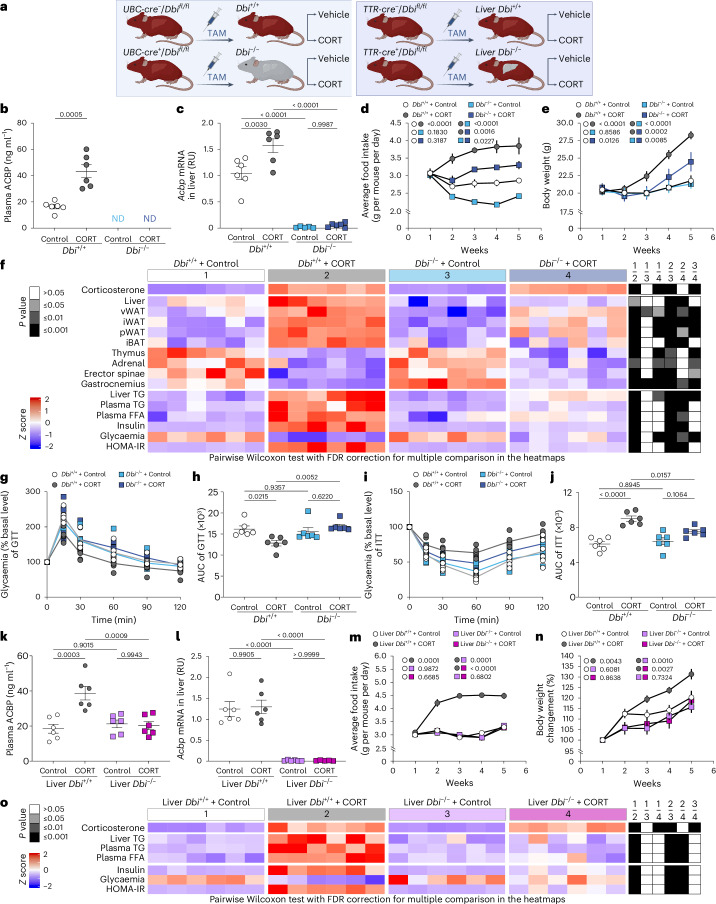
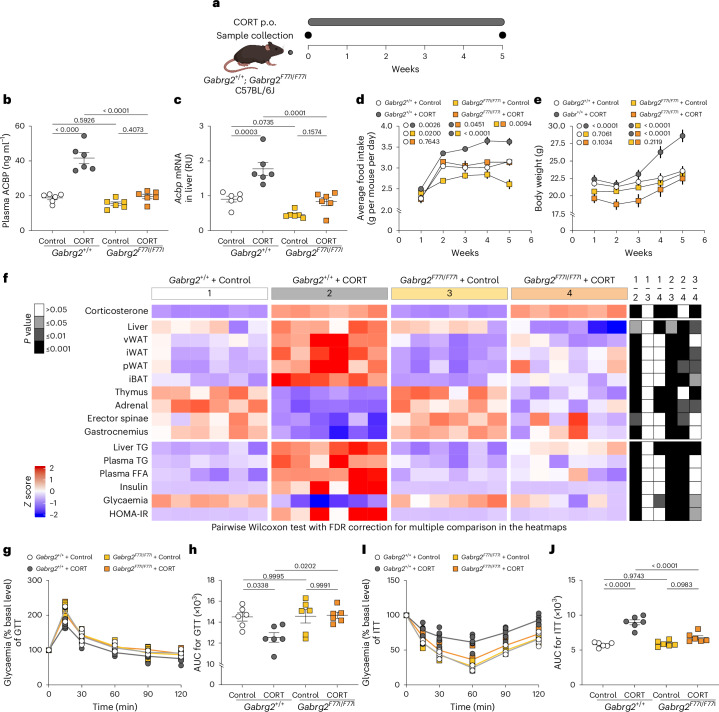
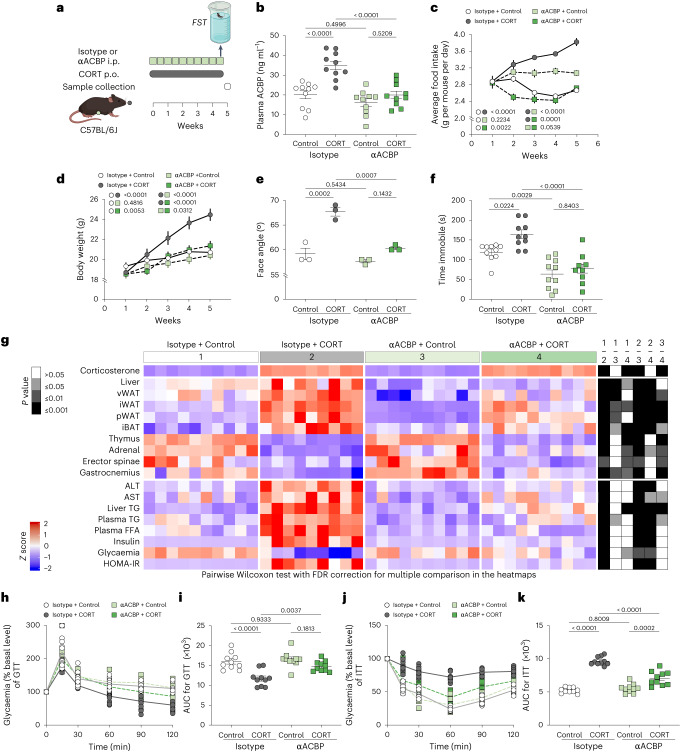
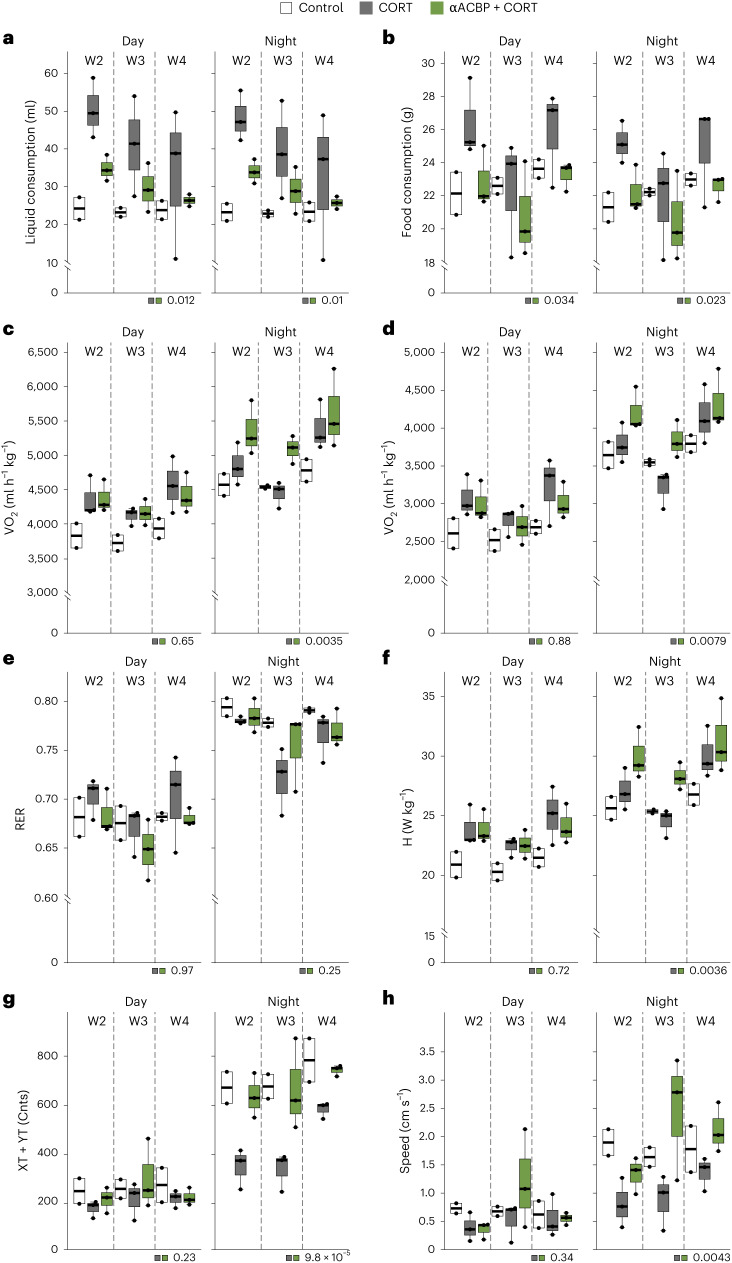
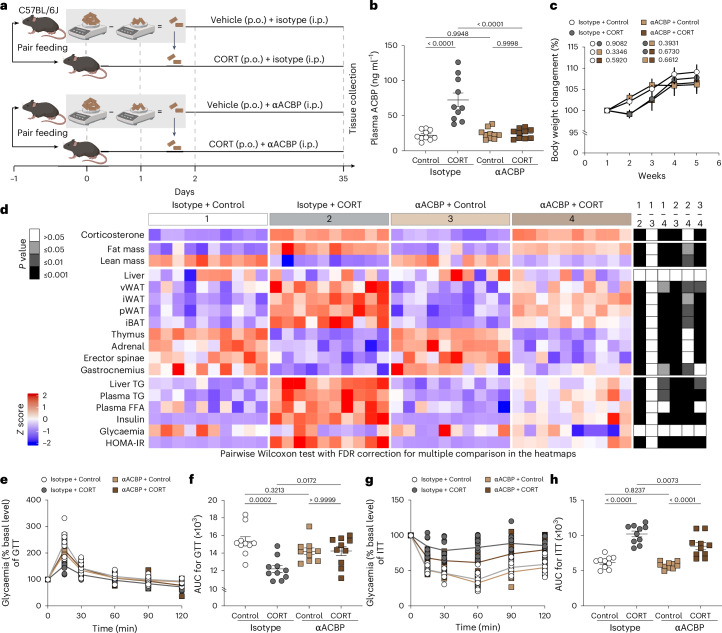
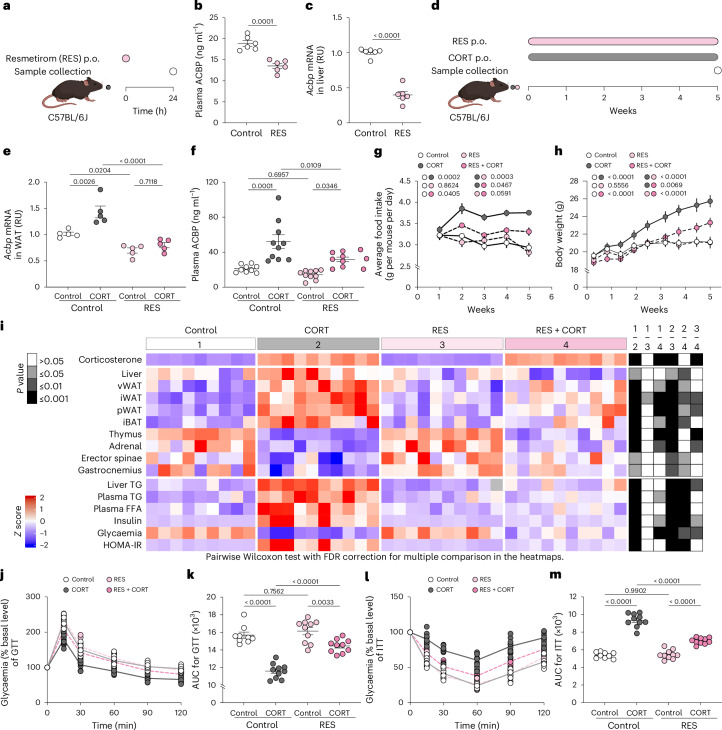
Cushing's syndrome is caused by an elevation of endogenous or pharmacologically administered glucocorticoids. Acyl coenzyme A binding protein (ACBP, encoded by the gene diazepam binding inhibitor, Dbi) stimulates food intake and lipo-anabolic reactions. Here we found that plasma ACBP/DBI concentrations were elevated in patients and mice with Cushing's syndrome. We used several methods for ACBP/DBI inhibition in mice, namely, (1) induction of ACBP/DBI autoantibodies, (2) injection of a neutralizing monoclonal antibody, (3) body-wide or hepatocyte-specific knockout of the Dbi gene, (4) mutation of the ACBP/DBI receptor Gabrg2 and (5) injections of triiodothyronine or (6) the thyroid hormone receptor-β agonist resmetirom to block Dbi transcription. These six approaches abolished manifestations of Cushing's syndrome such as increased food intake, weight gain, excessive adiposity, liver damage, hypertriglyceridaemia and type 2 diabetes. In conclusion, it appears that ACBP/DBI constitutes an actionable target that is causally involved in the development of Cushing's syndrome.


Conflict of interest statement

Competing interests: O.K. is a scientific co-founder of Samsara Therapeutics. I.M. consults for Osasuna Therapeutics. G.K. has been holding research contracts with Daiichi Sankyo, Eleor, Kaleido, Lytix Pharma, PharmaMar, Osasuna Therapeutics, Samsara Therapeutics, Sanofi, Sutro, Tollys and Vascage. G.K. is on the Board of Directors of the Bristol Myers Squibb Foundation France. G.K. is a scientific co-founder of everImmune, Osasuna Therapeutics, Samsara Therapeutics and Therafast Bio; is in the scientific advisory boards of Hevolution, Institut Servier, Longevity Vision Funds and Rejuveron Life Sciences; and is the inventor of patents covering therapeutic targeting of ageing, cancer, cystic fibrosis and metabolic disorders. Among these patents, one, ‘Methods for weight reduction’ (US11905330B1), is relevant to this study. G.K.’s brother, Romano Kroemer, was an employee of Sanofi and now consults for Boehringer-Ingelheim. G.K.’s wife, Laurence Zitvogel, has held research contracts with GSK, Incyte, Lytix, Kaleido, Innovate Pharma, Daiichi Sankyo, Pilege, Merus, Transgene, 9m, Tusk and Roche, was on the on the Board of Directors of Transgene, is a co-founder of everImmune and holds patents covering the treatment of cancer and the therapeutic manipulation of the microbiota. The funders had no role in the design of the study, in the writing of the manuscript or in the decision to publish the results. The other authors declare no competing interests.

Figures

Fig. 1
Fig. 1. Identification of corticosteroids and thyroid hormone as ACBP/DBI modulators.
a,b, H4 cells expressing GFP–LC3 were treated with agonists and antagonists of neurotransmitter and hormone receptors (5 µM). ACBP was assessed by immunohistochemistry. Scaled ACBP fluorescence intensity and viability are depicted (a) together with representative images (b). Rapamycin (RAPA; 10 µM), Torin-1 (0.3 µM) and DMSO (control) were used as controls. Scale bar, 5 µm. c,d, The plots show ACBP fluorescence (c) and GFP–LC3 puncta (d) (16 h; 0.01, 0.05 and 0.1 µM DEX, HCS and T3 in dialysed foetal bovine serum (AU, arbitrary units; mean ± s.d.). e,f, H4 cells were treated with DEX, HCS and T3 (0.1 µM) for 16 h. ACBP release was assessed by ELISA (e), and ACBP mRNA levels were measured by qRT–PCR (RU, relative units) (f). g,h, Female C57BL/6J (8-week-old) mice (n = 5 per group) were treated with HCS (10, 50 and 100 mg kg−1; i.p.) for 24 h. Plasma ACBP was measured by ELISA (g) and hepatic Acbp mRNA was assessed by qRT–PCR (h). il, ACBP abundance, LC3 conversion and p62 degradation were measured in liver tissue (representative blots in (i and quantifications of the ratios of the indicated proteins in jl) (n = 3 per group)). m, Mice were fasted or received HCS (100 mg kg−1; i.p.) for 24 h combined with SAFit2 (40 mg kg−1; i.p.) or vehicle, and plasma ACBP was measured by ELISA (n = 15, 10, 10, 10, 10 and 10 mice per group). n, PBMCs were treated with HCS (0.5 μM) for 16–18 h, and ACBP mRNA was assessed by qRT–PCR. o,p, Plasma ACBP levels were measured in dermatology patients receiving (n = 53) or not (n = 39) glucocorticoid treatment (o), and data were grouped by sex (p). The Wilcoxon test was used and P values were calculated according to a multivariate model including age and BMI. q, Plasma ACBP was measured in ACTH-dependent patients with Cushing’s syndrome with hypercortisolaemia (n = 11) or in remission (n = 13); an unpaired t-test was used for analysis. r,s, Plasma ACBP was plotted against BMI in the hypercortisolaemia group (n = 11) (r) and against daily HCS dose (in the case of corticotroph deficiency) in the remission group (n = 10) (s). The dot plots depict mean ± s.e.m., if not otherwise indicated. One-way ANOVA with Dunnet correction (ch and jm), Mann–Whitney test (two tailed) (o and p), unpaired t-test (two tailed) (q and n) and Pearson correlation (r and s) were used for statistical analysis (P values are indicated). Source data
Fig. 2
Fig. 2. Autoantibody-mediated neutralization of ACBP/DBI prevents Cushing’s syndrome.
a, The experimental schedule of CORT administration in auto-immunized C57BL/6J female mice against ACBP/DBI. Female C57BL/6J mice were treated with KLH–ACBP for autoimmunization or KLH alone, both administered intraperitoneally for 4 weeks (n = 10 mice per group). One week later, mice received CORT (100 μg ml−1) or vehicle control (control) in drinking water orally (p.o.) for an additional 5 weeks (n = 10 mice per group). b, Plasma levels of ACBP were measured by ELISA. ce, Hepatic ACBP and NR3C1 were analysed by immunoblot. Representative blots (c) and quantifications of the indicated protein ratios (d and e) are shown (n = 3 per group). β-Actin was used as a loading control. f,g, The average food intake (n = 4 cages per group) (f) and body weight (n = 10 mice per group) (g) was monitored in the indicated groups. The P value represents the comparison of areas under the curve. h,i, Representative frontal and longitudinal photographs of one mouse of each group are shown (h), and facial angles were measured (i) at the end of week 5 (n = 3 mice per group). The lines indicate the measurement of the facial angle in mice. j, The heatmap shows the standardized deviations (z scores) of tissue weights relative to body weight and the quantification of various biochemical parameters across the treatment groups (n = 10 per group). vWAT, visceral white adipose tissue; iWAT, inguinal white adipose tissue; pWAT, perigonadal white adipose tissue; iBAT, interscapular brown adipose tissue. Statistical comparisons were performed by pairwise (two-tailed) Wilcoxon test with false discovery rate correction for multiple comparisons (P values are indicated). kn, GTT (n = 10 mice per group) (k) and ITT (n = 10 mice per group) (m) were monitored in the indicated groups. The P value represents the comparison of areas under the curve (GTT (l) and ITT (n)). All dot plots depict mean ± s.e.m. The curves in f and g were longitudinally analysed with type II ANOVA and pairwise comparisons. The data in b, d, e, i, l and n were analysed using one-way ANOVA with Tukey correction. Source data
Fig. 3
Fig. 3. Genetic depletion of ACBP/DBI prevents Cushing’s syndrome.
a, A schematic representation of the different C57BL/6J lineages conditionally knocked out for the ACBP/DBI protein. The conditional knockout of Acbp/Dbi was achieved by administering repeated i.p. injections of tamoxifen (TAM) to mice with a floxed Acbp/Dbi gene (genotype: Dbifl/fl), combined with either a latent ubiquitous CRE recombinase (UBC-cre+) or a hepatocyte-specific CRE recombinase (TTR-cre+). bo, Female Dbi/ mice and their wild-type controls (Dbi+/+) as well as female liver-Dbi/ mice and their wild-type controls (liver-Dbi+/+) were treated with CORT (100 μg ml−1) or vehicle (control) in drinking water (p.o.) for 5 weeks: Plasma ACBP was quantified by ELISA (n = 6 per group) (b and k), and hepatic Acbp mRNA was assessed by qRT–PCR (n = 6 per group) (c and l); average food intake (n = 3 cages per group) (d and m) and body weight (n = 8 and 6 mice per group) (e and n) were monitored in the indicated groups (the P value represents the comparison of areas under the curve); the heatmap shows the standardized deviations (z scores) of tissue weights relative to body weight and the quantification of various biochemical parameters across the treatment groups (n = 6 mice per group) (f and o) (statistical comparisons were performed by pairwise (two-tailed) Wilcoxon test with false discovery rate (FDR) correction for multiple comparisons; P values are indicated); GTT (n = 6 mice per group) (g) and ITT (n = 6 mice per group) (i) were monitored in the indicated groups (the P value represents the comparison of areas under the curve; h and j). Statistical comparisons were performed by pairwise Wilcoxon test with FDR correction for multiple comparisons in the heatmaps (P values are indicated). All dot plots depict mean ± s.e.m. Two independently repeated experiments were conducted; only one representative result is shown. The curves in d, e, m and n were longitudinally analysed with type II ANOVA and pairwise comparisons. The data in b, c, h and jl were analysed using one-way ANOVA with Tukey correction. vWAT, visceral white adipose tissue; iWAT, inguinal white adipose tissue; pWAT, perigonadal white adipose tissue; iBAT, interscapular brown adipose tissue; ND, not detectable. Created with BioRender.com. Source data
Fig. 4
Fig. 4. Genetic inhibition of ACBP/DBI prevents Cushing’s syndrome.
a, A scheme showing the experimental schedule of CORT administration in female C57BL/6J mice (Gabrg2F77I/F77I) or wild-type controls (Gabrg2+/+). bj, Gabrg2F77I/F77I or Gabrg2+/+ mice were treated with CORT (100 μg ml−1 or vehicle control (control) in drinking water, p.o.) for 5 weeks (n = 10, 10, 9 and 10 mice per group): plasma ACBP was measured by ELISA (n = 6 per group) (b), and hepatic Acbp mRNA was assessed by qRT–PCR (n = 6 per group; AU, arbitrary units) (c); average food intake (n = 3 cages per group) (d) and body weight (n = 10, 10, 9 and 10 mice per group) (e) were monitored in the indicated groups (P values compare areas under the curve); the heatmap shows the standardized deviations (z scores) of tissue weights relative to body weight and the quantification of various biochemical parameters across the treatment groups (n = 6 mice per group) (f) (statistical comparisons were performed by pairwise (two-tailed) Wilcoxon test with false discovery rate (FDR) correction for multiple comparisons: P values are indicated); GTT (n = 6 mice per group) (g) and ITT (n = 6 mice per group) (i) were monitored in the indicated groups (the P value represents the comparison of areas under the curve; (GTT (h) and ITT (j)). Statistical comparisons were performed by pairwise Wilcoxon test with FDR correction for multiple comparison in the heatmaps (P values are indicated). All dot plots depict mean ± s.e.m. Two independent repeated experiments were conducted; only one representative result is shown. The curves in d and e were longitudinally analysed with type II ANOVA and pairwise comparisons. The data in b, c, h and j were analysed using one-way ANOVA with Tukey correction. vWAT, visceral white adipose tissue; iWAT, inguinal white adipose tissue; pWAT, perigonadal white adipose tissue; iBAT, interscapular brown adipose tissue. Created with BioRender.com. Source data
Fig. 5
Fig. 5. Passive immunization of mice by neutralizing monoclonal anti-ACBP/DBI mAb prevents the manifestation of Cushing’s syndrome.
a, The experimental schedule for passive immunization. Female C57BL/6J mice were treated with CORT (100 μg ml−1 or vehicle control (control) in drinking water, p.o.) for 5 weeks together with ACBP/DBI mAb (αACBP, 5 mg kg−1 body weight, i.p., semiweekly). Isotype was used as the control. Animals were subjected to FST in the fifth week. b, Plasma ACBP was measured by ELISA in the indicated treatment groups (n = 10 per group). c,d, The average food intake (n = 4 cages per group) (c) and body weight (n = 10 per group) (d) was monitored in the indicated groups. e, Facial angles of mice from the indicated groups were measured (n = 3 mice per group). f, Immobility time assessed by FST (n = 10 mice per group). g, The heatmap shows the standardized deviations (z scores) of tissue weight relative to body weight and the quantification of various biochemical parameters across the treatment groups (n = 10, 9, 10 and 10 mice per group). Statistical comparisons were performed by pairwise (two-tailed) Wilcoxon test with false discovery rate (FDR) correction for multiple comparisons (P values are indicated). hk, GTT (n = 10 mice per group) (h) and ITT (n = 10 mice per group) (j) were monitored in the indicated groups. The P value represents the comparison of areas under the curve (GTT (i) and ITT(k)). The P value represents the comparison of areas under the curve. Statistical comparisons were performed by pairwise Wilcoxon tests with FDR correction for multiple comparisons in the heatmaps (P values are indicated). All dot plots represent mean ± s.e.m. The curves in c and d were longitudinally analysed with type II ANOVA and pairwise comparisons. The data in b, e, f, i and k were analysed using one-way ANOVA with Tukey correction. vWAT, visceral white adipose tissue; iWAT, inguinal white adipose tissue; pWAT, perigonadal white adipose tissue; iBAT, interscapular brown adipose tissue. Created with BioRender.com. Source data
Fig. 6
Fig. 6. Metabolic effects of ACBP/DBI neutralization in mice undergoing glucocorticoid treatment.
Metabolic parameters in mice subjected to vehicle, CORT or a combination of CORT and ACBP/DBI mAb (αACBP, 5 mg kg−1 body weight, i.p., semiweekly) for 4 weeks. ah, Liquid consumption (a), food consumption (b), O2 consumption (VO2, c), CO2 production (VCO2, d), respiratory exchange rates (RER, e), heat production (H, f), sum of the ambulatory and fine movements (XT + YT yielding counts (Ctns), g), and speed (h) were measured in metabolic cages. Daily CORT exposure was adjusted to 500 µg. The data are presented as standard box plots (the centre line represents the median, box limits represent upper and lower quartiles, and whiskers represent minimum and maximum values) of metabolic parameters (n = 2, 3 and 3 mice per condition). Metabolic parameters are means evaluated over each 12 h period (night or day) and further averaged over every night and day period for each animal and for each week. For liquid and food consumption (a and b), cumulative values over 12 h periods are used instead of means. The P values were calculated by Fisher’s meta-analysis method. Source data
Fig. 7
Fig. 7. Mitigation of CORT-induced metabolic dysregulation in mice under pair feeding by ACBP/DBI neutralization.
a, The experimental schedule for the pair-feeding experiment in C57BL/6J female mice receiving anti-ACBP/DBI antibody, isotype control antibody and/or CORT. A pair-feeding protocol was implemented where the average daily food intake of vehicle groups was measured daily to limit the amount of food provided to the other groups. b, Plasma ACBP was measured by ELISA (n = 10 per group). c, Body weight modifications (n = 10 per group) were monitored. d, The heatmap shows the standardized deviations (z scores) of tissue weights relative to body weight and the quantification of various biochemical parameters across the treatment groups (n = 10 mice per group). Statistical comparisons were performed by pairwise (two-tailed) Wilcoxon test with false discovery rate (FDR) correction for multiple comparisons (P values are indicated). eh, GTT (n = 10 per group) (e and f) and ITT (n = 10 per group) (g and h) are shown (e and g) with the comparison of the areas under the curve (f and h). Statistical comparisons were performed by pairwise Wilcoxon tests with FDR correction for multiple comparison in the heatmaps. All dot plots depict mean ± s.e.m. The weight curves were longitudinally analysed with type II ANOVA and pairwise comparisons. The data in b, f and h were analysed using one-way ANOVA with Tukey correction. vWAT, visceral white adipose tissue; iWAT, inguinal white adipose tissue; pWAT, perigonadal white adipose tissue; iBAT, interscapular brown adipose tissue. Created with BioRender.com. Source data
Fig. 8
Fig. 8. The THR-β agonist RES inhibits ACBP/DBI and prevents Cushing’s syndrome.
a, The experimental schedule showing the treatment of female C57BL/6J mice with RES (0.033 mg ml−1 or vehicle control (control) per gavage). b,c, Plasma ACBP (b) and liver Acbp mRNA (c) were measured by ELISA and qRT–PCR, respectively (n = 6 per group; RU, relative units). d, The experimental schedule showing the treatment of mice with CORT (100 μg ml−1, p.o.) and RES (0.033 mg ml−1 in drinking water, p.o.) for 5 weeks. e,f, WAT Acbp mRNA (n = 5 per group) (e) and plasma ACBP (n = 9–10 per group) (f) were measured at the end of the fifth week in the indicated groups. g,h, The average food intake (n = 3 cages per group) (g) and body weight (n = 9–10 mice per group) (h) were monitored. P values refer to the comparison of areas under the curve. i, The heatmap shows the standardized deviations (z scores) of tissue weight relative to body weight and the quantification of various biochemical parameters across the treatment groups (n = 9, 10, 10 and 10 mice per group). Statistical comparisons were performed by pairwise (two-tailed) Wilcoxon test with false discovery rate (FDR) correction for multiple comparisons (P values are indicated). jm, GTT (n = 9–10 mice per group) (j) and ITT (n = 9–10 mice per group) (l) was monitored in the indicated groups. P values refer to the comparison of areas under the curve (GTT (k) and ITT (m)). Statistical comparisons were performed by pairwise Wilcoxon tests with FDR correction for multiple comparison in the heatmaps. All dot plots depict means ± s.e.m. Arbitrary units, AU. The data in b and c were analysed by unpaired t-test (two tailed). The curves in g and h were longitudinally analysed with type II ANOVA and pairwise comparisons. The data in e, f, k and m were analysed using one-way ANOVA with Tukey correction. Created with BioRender.com. Source data
Extended Data Fig. 1
Extended Data Fig. 1. Identification of corticosteroids and thyroid hormones as ACBP/DBI modulators.
(a-c) H4 cells were treated with dexamethasone (DEX), hydrocortisone (HCS), or corticosterone (CORT) (1 μM) for 6 h with/without bafilomycin A1 (BafA1, 100 nM, final 2 h). Rapamycin (RAPA, 10 μM) was used as positive control. Representative immunoblots of LC3 conversion are shown in (a) and quantifications in (b) (n=3/group). β-actin was used as a loading control. (c) Cells were transfected with siRNA targeting ATG5 and ATG7 or control siRNA (siCtrl) and then treated as indicated (n=3/group; RU, relative units). (d-g) Cells were transfected with siRNA targeting NR3C1 or siCtrl. ACBP release was assessed by ELISA. (d) Representative immunoblots show NR3C1 and ACBP levels in NR3C1 knockdowns with/without DEX (1 μM, 24 h). (e-f) Scatter plot shows the ratio of NR3C1/β-actin (e) and ACBP/β-actin (f) with the indicated treatments. (g) ACBP release from cells with the indicated treatments is shown in (d) (RU; n=3; One-way ANOVA; P-values are indicated). All dot plots depict means ± SEM. (h) Scheme shows the schedule of hydrocortisone (HCS, 10, 50, 100 mg/kg, i.p.) administration to female C57BL/6J mice (n=5/group). (i) Percentage of mouse thymus relative to body weight following HCS treatment at the specified doses (n=5/group). (j, k) Representative immunoblot (j) showing ACBP levels in WAT treated with HCS at different dose (n=5/group). Scatter plot (k) shows the ratio of ACBP/β-actin (k). (l) Scheme shows the schedule of hydrocortisone (HCS, 100 mg/kg, i.p.) administration to female C57BL/6J mice for the indicated duration. (m) Percentage of mouse thymus relative to body weight following HCS treatment at various time points (n=5/time point). (n) Plasma ACBP level under HCS treatments at various time points (n=5/time point). (o) Representative immunoblots show hepatic ACBP upon treatment with HCS at various time points (n=5/group). Scatter plots show the ratio of ACBP/β-actin (p). (h) Scheme shows the schedule of mifepristone (Mif, 120 mg/kg, i.g.) administration and fasting in female C57BL/6J mice for 24 h. (q, r) Scheme of the experiment (q) and plasma ACBP levels (r) upon Mif treatment and fasting for 24 h. One-way ANOVA with Dunnett correction was used for statistical analysis (i,k,m,n,p,r). Data in b,c,e,f,g were analyzed using two-way ANOVA with Tukey correction. (P-values are indicated). All dot plots depict means ± SEM. Source data
Extended Data Fig. 2
Extended Data Fig. 2. Effects of short-term triiodothyronine administration on ACBP/DBI expression.
(a-d) Cells were treated with siRNA targeting the thyroid hormone receptor (THR) α and β genes or control siRNA (siCtrl) and then cultured in the presence of triiodothyronine (T3). Then cells were subjected to the quantification of the mRNA coding for THRα, THRβ or ACBP (n=3/group; RU, relative units). (e) Scheme of T3 administration to female C57BL/6 mice for 16 h. (f) Plasma ACBP was assessed by ELISA after T3 treatment at different doses (n=6/group). (g) Liver Acbp mRNA levels (n=6/group; RU, relative units) after T3 treatment. (h) Representative immunoblot of ACBP after T3 treatment (n=3/group). β-actin was used as a loading control. (i) Scatter plot showing the ACBP/β-actin ratio. One-way ANOVA with Tukey correction was used for statistical analysis (P-values are indicated). All dot plots indicate means ± SEM. Source data
Extended Data Fig. 3
Extended Data Fig. 3. Attenuation of corticosterone-induced changes in hepatic morphology and adipose tissue by autoantibody-mediated neutralization of ACBP/DBI model.
(a) Representative hematoxylin and eosin stains of liver, white adipose tissue (WAT), and interscapular brown adipose tissue (iBAT) of female C57BL/6J mice treated with corticosterone (CORT; 100 μg/mL or vehicle control (Ctrl) in drinking water, p.o.) for 5 weeks together with KLH-ACBP for autoimmunization or KLH alone both administered i.p. Scale bar equals 40 µm. (b-f) Medium area of visceral WAT (vWAT), inguinal WAT (iWAT), perigonadal WAT (pWAT), iBAT and hepatocytes was assessed in the indicated groups (n=4-5 mice tissue sections/condition). One-way ANOVA with Tukey correction was used for statistical analysis (P-values are indicated). All dot plots depict means ± SEM. Source data
Extended Data Fig. 4
Extended Data Fig. 4. Attenuation of corticosterone-induced changes in hepatic morphology and adipose tissue by ACBP/DBI mAb-mediated neutralization of ACBP/DBI.
(a) Representative hematoxylin and eosin stains of liver, white adipose tissue (WAT), and interscapular brown adipose tissue (iBAT) of female C57BL/6J mice treated with corticosterone (CORT) (100 μg/mL, or vehicle (Ctrl) in drinking water, p.o.) with or without αACBP (5 mg/kg body weight, i.p.) semiweekly for 5 weeks. Scale bar equals 40 µm. (b-f) Medium area of visceral WAT (vWAT), inguinal WAT (iWAT), perigonadal WAT (pWAT), iBAT and hepatocytes was assessed in the indicated groups (n=4-5 mice tissue sections/condition). One-way ANOVA with Tukey correction was used for statistical analysis (P-values are indicated). All dot plots depict means ± SEM. Source data
Extended Data Fig. 5
Extended Data Fig. 5. Effect of corticosterone and anti-ACBP/DBI mAb on plasma hormone concentrations.
Female C57BL/6J mice were treated with corticosterone (CORT) (100 μg/mL, or vehicle (Ctrl) in drinking water, p.o.) with or without αACBP (5 mg/kg body weight, i.p.) semiweekly for 5 weeks. Abundance of plasma hormones was assessed by Luminex multiplex assay (n=10,10,9,10/group). The heatmap displays z-scores of the indicated metabolic hormones in the indicated treatment groups. Statistical comparisons were performed by pairwise (two tailed) Wilcoxon test with FDR correction for multiple comparisons. (P-values are indicated). Source data
Extended Data Fig. 6
Extended Data Fig. 6. Liver RNA sequencing analysis of anti-ACBP/DBI mAb model.
(a) At the end of the corticosterone (CORT) and anti-ACBP/DBI (αACBP) mAb experiment, liver tissue was collected for RNAseq analysis (n=5/group). Genes with a differential expression P-value ≤ 0.05 (Wald test) and abs (fold change) ≥ 2 were selected in (a). (b) Volcano plot of differential genes between isotype + CORT and isotype + Ctrl groups. (c) Volcano plot of differential genes between αACBP + CORT and isotype + CORT groups. Log2 (fold change)| ≥ 1, P-value < 0.05. (d,e) Venn diagrams illustrate overlaps of the transcriptomic CORT effects on isotype and αACBP mAb neutralization. (f) GO enrichment analysis of the genes obtained from the overlap in (d) (58 genes). (g) GO enrichment analysis of the genes obtained from the overlap in (e) (442 genes). Data were analyzed using R software with the DESeq2 package. Source data
Extended Data Fig. 7
Extended Data Fig. 7. Liver and plasma metabolomics of Cushing’s syndrome treated with anti-ACBP/DBI mAb.
(a) Heatmap showing metabolite profiling of liver from anti-ACBP/DBI (αACBP) mAb model. Student’s t test was used to compare isotype + corticosterone (CORT) versus αACBP + CORT, and metabolites which have less than 0.05 were kept for the heatmap. Data was Area Quality Control Corrected Log2 transformed and centered on the mean of all the biological samples. (b) Heatmap showing metabolite profiling of plasma from αACBP mAb treated mice. Student’s test was used to compare isotype + CORT Versus αACBP + CORT, and metabolites which have less than 0.05 were kept for the Heatmap. Data was Area Quality Control Corrected Log2 transformed and centered on the mean of all the biological samples. (c) Venn Diagram displaying the repartition across liver and plasma of the metabolites shown in E7a and E7b. Twenty-eight metabolites are common over the two biological matrices and are detailed in Supplementary Figs. 8,9. Data were analyzed using R software. Source data
Extended Data Fig. 8
Extended Data Fig. 8. A monoclonal anti-ACBP/DBI antibody prevents the manifestation of Cushing’s syndrome in male mice.
(a) Male C57BL/6J mice were treated with CORT (100 μg/mL) in drinking water (p.o.) for 5 weeks (n=10/group). (b) Plasma ACBP was quantified by ELISA (n=10/group). (c) Average food intake (n=3 cages/group) and (d) body weight (n=10 mice/group) were monitored. P-values compare areas under the curve. (e) The heatmap shows the standardized deviations (z-scores) of tissue weights relative to body weight and the quantification of various biochemical parameters across the treatment groups (n=10 mice/group). Statistical comparisons were performed by pairwise (two tailed) Wilcoxon test with FDR correction for multiple comparisons. (P-values are indicated). (f-i) Glucose tolerance tests (GTT) (n=10 mice/group) (f) and insulin tolerance tests (ITT) (n=10 mice/group) (h) were performed in the indicated groups. P-value refer to the comparison of areas under the curve (g,i). Statistical comparisons were performed by pairwise Wilcoxon tests with FDR correction for multiple comparison in the heatmaps. All dot plots depict means ± SEM. All curves were longitudinally analyzed with type II ANOVA and pairwise comparisons (c,d). One-way ANOVA with Tukey correction was used for statistical analysis (P-values are indicated) (d,g,i). Source data
Extended Data Fig. 9
Extended Data Fig. 9. Effects of triiodothyronine (T3) administration on ACBP expression and metabolic parameters in mice under corticosterone treatment.
(a) Scheme showing the experimental schedule of triiodothyronine (T3; i.p.) administration to female C57BL/6J mice treated with corticosterone (CORT) for 5 weeks. Liver (b) and WAT (c) Acbp mRNA levels (n=6/group; RU, relative units) were quantified. (d) Representative immunoblot shows ACBP level treated with different doses of T3 (n=3/group). β-actin was used as a loading control. Scatter plots show the ratio of ACBP/β-actin in liver (e) and in WAT (f). (g) Plasma ACBP were assessed by ELISA (n=10/group). (h) Average food intake (n=3 cages/group) and (i) body weight (n=10 mice/group) were monitored. (j) The heatmap shows the standardized deviations (z-scores) of tissue weights relative to body weight and the quantification of various biochemical parameters (n=10 mice/group). Statistical comparisons were performed by pairwise (two tailed) Wilcoxon test with FDR correction for multiple comparisons. (P-values are indicated). Statistical comparisons were performed by pairwise Wilcoxon tests with FDR correction for multiple comparison in the heatmaps (P-values are indicated). All dot plots indicate means ± SEM. All curves were longitudinally analyzed with type II ANOVA and pairwise comparisons (h,i). One-way ANOVA with Tukey correction was used for statistical analysis (P-values are indicated) (b,c,e-g). Source data

References

    1. Lacroix, A., Feelders, R. A., Stratakis, C. A. & Nieman, L. K. Cushing’s syndrome. Lancet386, 913–927 (2015). - PubMed
    1. Loriaux, D. L. Diagnosis and differential diagnosis of Cushing’s syndrome. N. Engl. J. Med.376, 1451–1459 (2017). - PubMed
    1. Pivonello, R. et al. Complications of Cushing’s syndrome: state of the art. Lancet Diabetes Endocrinol.4, 611–629 (2016). - PubMed
    1. Limumpornpetch, P. et al. The effect of endogenous Cushing syndrome on all-cause and cause-specific mortality. J. Clin. Endocrinol. Metab.107, 2377–2388 (2022). - PMC - PubMed
    1. Hasenmajer, V. et al. The immune system in Cushing’s syndrome. Trends Endocrinol. Metab.31, 655–669 (2020). - PubMed

Substances