. 2024 Nov 22;25(1):1132.
doi: 10.1186/s12864-024-11046-y.

Bioinformatics analysis of the Microsporidia sp. MB genome: a malaria transmission-blocking symbiont of the Anopheles arabiensis mosquito

Affiliations

Bioinformatics analysis of the Microsporidia sp. MB genome: a malaria transmission-blocking symbiont of the Anopheles arabiensis mosquito

Lilian Mbaisi Ang'ang'o et al. BMC Genomics. .

Abstract

Background: The use of microsporidia as a disease-transmission-blocking tool has garnered significant attention. Microsporidia sp. MB, known for its ability to block malaria development in mosquitoes, is an optimal candidate for supplementing malaria vector control methods. This symbiont, found in Anopheles mosquitoes, can be transmitted both vertically and horizontally with minimal effects on its mosquito host. Its genome, recently sequenced from An. arabiensis, comprises a compact 5.9 Mbp.

Results: Here, we analyze the Microsporidia sp. MB genome, highlighting its major genomic features, gene content, and protein function. The genome contains 2247 genes, predominantly encoding enzymes. Unlike other members of the Enterocytozoonida group, Microsporidia sp. MB has retained most of the genes in the glycolytic pathway. Genes involved in RNA interference (RNAi) were also identified, suggesting a mechanism for host immune suppression. Importantly, meiosis-related genes (MRG) were detected, indicating potential for sexual reproduction in this organism. Comparative analyses revealed similarities with its closest relative, Vittaforma corneae, despite key differences in host interactions.

Conclusion: This study provides an in-depth analysis of the newly sequenced Microsporidia sp. MB genome, uncovering its unique adaptations for intracellular parasitism, including retention of essential metabolic pathways and RNAi machinery. The identification of MRGs suggests the possibility of sexual reproduction, offering insights into the symbiont's evolutionary strategies. Establishing a reference genome for Microsporidia sp. MB sets the foundation for future studies on its role in malaria transmission dynamics and host-parasite interactions.

Keywords: Anopheles; Annotation; Biocontrol; Genome; Glycolytic pathway; Malaria; Microsporidia; RNA interference; Symbiosis; Transmission-blocking.


Conflict of interest statement

Declarations. Ethics approval and consent to participate: Not applicable. Consent for publication: Not applicable. Competing interests: The authors declare no competing interests.

Figures

Fig. 1
Fig. 1
Microsporidia sp. MB genome statistics. a The snail plot created using BlobToolKit highlights the genome metrics. A basic legend of the assembly statistics is provided in the top left corner. The outer blue rings highlight the GC content over the assembly, corresponding to each of the contigs in the grey ring. The overall GC content of the assembly is summarized at the bottom left corner. The light grey rings show the total length of the assembly. The red line highlights the longest scaffold, while the dark and light orange rings show the length of the contigs at which 50% and 90% of the total assembly is represented, respectively. b A pie-chart representation of the BUSCO gene completeness analysis shows a total of 81% single-copy core microsporidia genes present in Microsporidia sp. MB
Fig. 2
Fig. 2
Genome structure of Microsporidia sp. MB, showing contigs larger than 10 kb to focus on the significant portions of the assembly. The figure illustrates gene density and organization across these contigs, with the Y-axis representing the names of the contigs. Each gene is color-coded based on its functional classification, grouped into 12 distinct categories as indicated in the legend. The gene annotations are derived from GeneMark-ES and validated using BUSCO, ensuring high confidence in the predicted gene functions. This schematic helps visualize the distribution and functional diversity of genes across the larger contigs in the genome.The plot was created in RStudio [82] using the gggenes package (https://cran.r-project.org/web/packages/gggenes)
Fig. 3
Fig. 3
Phylogenomic analysis of common BUSCO orthogroups found in Enterocytozoonida (left) and their respective genome assembly completeness using BUSCO (right). Microsporidia sp. MB is bolded. Nosema granulosis was used as an outgroup. Alignments of common orthogroups were performed using MUSCLE and trimAl [83, 84]. The maximum likelihood tree (1000 bootstraps) was constructed using IQ-TREE v1.6.12 [85] based on the 92 single-copy orthologous genes (with the best model selection (LG + F + I + G4) from ModelFinder [86]. Bootstrap percentage values are shown on each node and the scale bar at the bottom of the tree indicates total changes per site
Fig. 4
Fig. 4
Protein family classification using InterProScan. a Seven main protein superfamily groups were identified, with most of the proteins classified as enzymes. b Zooming into the classification of the primary enzyme groups using InterProScan, hydrolases and transferases are highlighted as the most abundant enzyme classes in Microsporidia sp. MB. These two enzymes function in energy metabolism and transport of nutrients, respectively
Fig. 5
Fig. 5
Distribution of different enzyme classes and subclasses in Microsporidia sp. MB as predicted through InterProScan. “n =  denotes the number of proteins in each respective subclass while the x -axis represents the proportion of each subclass in their respective enzyme class in percentage
Fig. 6
Fig. 6
Sequence distribution of the different domains and repeats predicted using InterProScan. a A bar plot of the domains identified from the genome shows a large set of domains involved mainly in enzymatic activities. A zoomed image of the main domains excluding the outlier (where less than 10 sequences were represented in each domain) is shown on the right panel. b The distribution of repeat regions is depicted in this bar plot. Leucine-rich repeat regions (LRR) and WD40 were the most abundant. WD40 proteins named for their characteristic WD40 repeat motifs which consist of 40 amino-acids typically ending with tryptophan (W) and aspartic acid (D), are involved in a wide variety of cellular processes due to their ability to mediate protein–protein interactions
Fig. 7
Fig. 7
a Organization of leucine-rich repeats (LRR) across 9 contigs. MEME motif output showing conservation levels across the motif. Larger symbols indicate more common amino acids. Y-axis (bits) shows conservation levels—higher bits reflect higher conservation. X-axis denotes positions along the motif, with higher Y values indicating consistent amino acids at specific positions across analyzed sequences. Two LRR motifs, Motif 1 (red, 17 amino acids) and Motif 2 (blue, 20 amino acids), were identified using MEME Suite. Moreover, the prediction of signal peptides using TargetP v2.0 and SignalP v6.0 (green and brown respectively) in 2 of these sequences (NODE_405 and NODE_1665). b A 3D model of gene_679 (NODE_405) with motif mapping. The structure was modeled on PRIMO [99]. The identified LRR motifs are numbered based on MEME output
Fig. 8
Fig. 8
Gene Ontology Analysis. A highlight of the protein sequence distribution in each primary GO term (Biological Process, Cellular Component, and Molecular Function) shows that the bulk of the putative proteins are involved in metabolic processes, localized within the intracellular anatomical structure (nucleus and cytoplasm), and involved in enzymatic activities
Fig. 9
Fig. 9
KEGG metabolic pathway analysis. a A barplot representation of the main KEGG categories shows most of the pathways identified within the genome take part in the organismal systems and metabolism. b Sequence distribution in each KEGG pathway highlighting the top 25 pathways represented in the dataset. A large portion of the sequences were involved in purine and thiamine metabolism, cellular processes, and genetic information processing. “n” represents the total number of proteins in each category
Fig. 10
Fig. 10
Overview of the loss and retention of key genes involved in the glycolytic pathway genes across different microsporidia species. Retained genes are highlighted in light blue in the heatmap, while those that have been lost are highlighted in gray. Microsporidia sp. MB has retained most of the genes involved in glycolysis except for Pyruvate kinase, similar to V. corneae and N. granulosis. Comparatively, E. aedis, E. cuniculi, and E. hepatopenaei appear to have lost all these genes, suggesting a total reliance on the host for energy production. The maximum likelihood phylogenomic tree on the left was generated using IQ-TREE v1.6.12 [85] based on the 196 common BUSCO single-copy orthologous genes found in all species. Percent bootstrap support values are shown on each node and the branch length scale is bare at the bottom of the tree
Fig. 11
Fig. 11
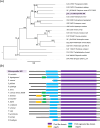
Analysis of argonaute orthologs. a A rooted phylogenetic tree of argonaute orthologs based on 17 microsporidian species. The tree was constructed on protein sequences of the argonaute orthologs based on maximum clade credibility with Mr Bayes. Percent bootstrap values are indicated at the nodes. The scale for the branch length is shown at the bottom. b A schematic representation of the position of conserved domains Piwi-like and PAZ are mapped onto the multiple sequence alignment
Fig. 12
Fig. 12
Analysis of the dicer ortholog in Microsporidia sp. MB. a A rooted phylogenetic tree of argonaute orthologs based on 20 microsporidian species. The maximum likelihood tree was constructed using IQTREE. The scale for the branch length is shown at the bottom and bootstrap support values shown on each node as a percentage (1000 bootstraps). b A schematic representation of the position of conserved domains in the multiple sequence alignment is shown. An insert was observed between the RIBOc and Rnc domains in 4 of the species including Microsporidia sp. MB, E. breve, P. epiphaga, and P. philotis
Fig. 13
Fig. 13
Analysis of the RNA-dependent RNA polymerase in Microsporidia sp. MB. a Phylogenetic analysis. Tree construction was done using IQTREE with 1000 bootstraps. Bootstrap support values are shown on each node and the branch length scale is indicated at the bottom of the tree. b The identified conserved domain, RdRP, is mapped onto the schematic representation of the multiple sequence alignment
Fig. 14
Fig. 14
Workflow for genome assembly, annotation, and comparative analysis of Microsporidia sp. MB. This flowchart outlines the step-by-step process used in the genome annotation pipeline. The workflow begins with sample collection and sequencing of Anopheles arabiensis mosquito ovaries using DNBSEQ technology, followed by genome assembly using SPAdes. The quality of the assembled genome was assessed using QUAST and visualized with BlobToolKit to check for contamination. Genome completeness was evaluated using BUSCO by identifying conserved single-copy orthologs specific to microsporidia. Repeat sequences in the genome were detected using RepeatMasker and RepeatModeler2 to annotate known and novel repeats. Gene prediction was performed using GeneMark-ES, optimized for eukaryotes with intronless genomes. Functional annotation of predicted genes was carried out with InterProScan, assigning proteins to families and domains from databases such as Pfam and CDD. Phylogenomic analysis of the genome was conducted using OrthoFinder for ortholog identification and IQ-TREE for maximum likelihood phylogenetic tree construction. Finally, predicted proteins were mapped to biological pathways using KEGG, and physicochemical properties, including transmembrane regions, were characterized using ProtParam and DeepTMHMM. This comprehensive workflow provides a detailed overview of the computational tools used in the experimental design and their roles in the analysis of the Microsporidia sp. MB genome

Similar articles

References

    1. World Health Organization. World malaria report 2022. 2023.
    1. Whittaker C, Hamlet A, Sherrard-Smith E, Winskill P, Cuomo-Dannenburg G, Walker PGT, et al. Seasonal dynamics of Anopheles stephensi and its implications for mosquito detection and emergent malaria control in the Horn of Africa. Proc Natl Acad Sci. 2023;120:1–9. - PMC - PubMed
    1. Ochomo EO, Milanoi S, Abong’o B, Onyango B, Muchoki M, Omoke D, et al. Molecular surveillance leads to the first detection of Anopheles stephensi in Kenya. Res Sq. 2023;v2:1–16. 10.21203/rs.3.rs-2498485/v2.
    1. Ojuka P, Boum Y, Denoeud-Ndam L, Nabasumba C, Muller Y, Okia M, et al. Early biting and insecticide resistance in the malaria vector Anopheles might compromise the effectiveness of vector control intervention in Southwestern Uganda. Malar J. 2015. 10.1186/s12936-015-0653-z. - PMC - PubMed
    1. Kleinschmidt I, Bradley J, Knox TB, Mnzava AP, Kafy HT, Mbogo C, et al. Implications of insecticide resistance for malaria vector control with long-lasting insecticidal nets: a WHO-coordinated, prospective, international, observational cohort study. Lancet Infect Dis. 2018;18:640–9. - PMC - PubMed

LinkOut - more resources