

The diagnositic value of dynamic contrast-enhanced ultrasound for evaluation of tissue oxygen status in rat hepatoma model
- PMID: 39578733
- PMCID: PMC11585086
- DOI: 10.1186/s12876-024-03523-1
The diagnositic value of dynamic contrast-enhanced ultrasound for evaluation of tissue oxygen status in rat hepatoma model
Abstract
Background: Hypoxia is a characteristic of solid tumors, but whether significant hypoxia exists in the hepatocellular carcinoma remains unclear. This animal study aims to explore the value of dynamic contrast-enhanced ultrasound (CEUS) quantitative parameters to evaluate the oxygen status in two rat hepatoma models.
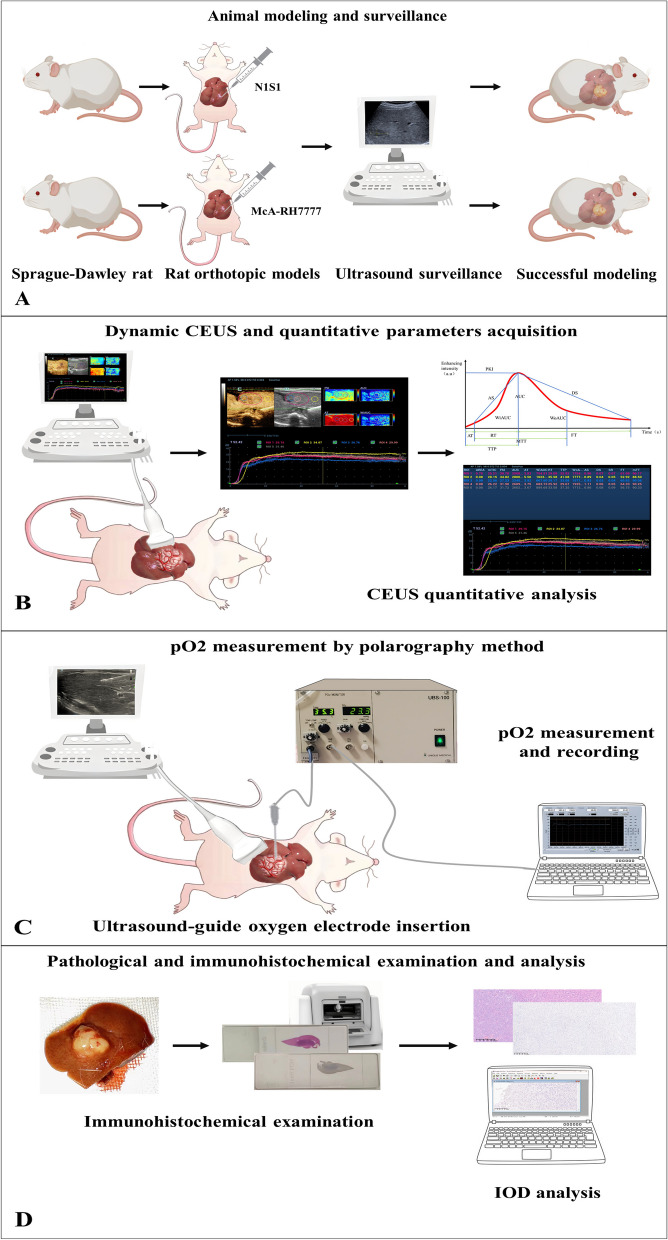
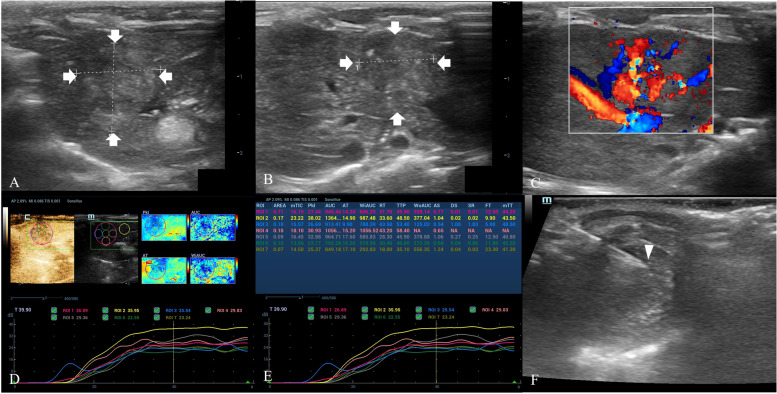
Materials and methods: N1S1 and McA-RH7777 S-D rat orthotopic hepatoma models were established. Once the tumors reached a diameter of 10-15 mm, CEUS and oxygen partial pressure (pO2) polarography were performed. Immunohistochemical staining for HIF-1α and pimonidazole was conducted after euthanizing the rats. Correlation between quantitative CEUS parameters, pO2, and the immunohistochemical integrated optical density (IOD) was analyzed to assess the predictive ability of CEUS quantitative parameters for the tissue oxygen environment.
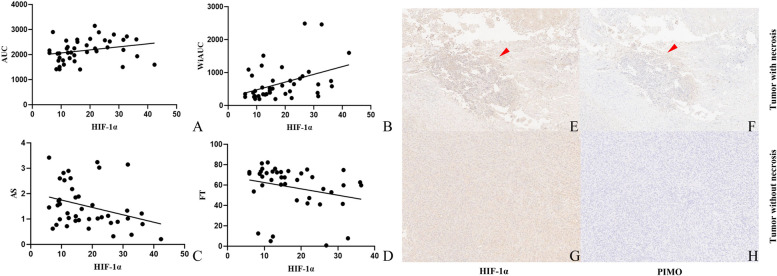
Result: Eleven N1S1 models and ten McA-RH7777 models were established successfully. There was no significant difference in pO2 (35.5 mmHg vs 32.2 mmHg, P = 0.917), IOD of HIF-1α (13.4 vs 20.0, P = 0.159) and pimonidazole (0.70 vs 1.30, P = 0.926) between the tumor and the peritumoral liver tissue. The pO2 values were correlated with CEUS quantitative parameters including mean time-intensity curves (mTIC) (P = 0.003), peak intensity (PKI) (P = 0.010), area under the curve (AUC) (P = 0.009), area under the wash-in curve (WiAUC) (P = 0.006), and arrival time (AT) (P = 0.033). The IOD of HIF-1α correlated with AUC (P = 0.022), WiAUC (P = 0.009), ascending slope (AS) (P = 0.044), and falling time (FT) (P = 0.009). Multiple linear regression indicated that the "short AT" was an independent protective factor for hypoxia (β = -2.347, 95% CI: -4.948, -0.394, P = 0.022), and CEUS had the ability to predict the tumor pO2 (P = 0.003).
Conclusion: No evidence of significant hypoxia was identified in two rat orthotopic hepatoma models. Quantitative CEUS parameters correlated with the oxygen status of the tumor, which could be utilized to predict the tumor tissue pO2.
Keywords: Hypoxia; Liver neoplasm; Ultrasonography.
© 2024. The Author(s).
Conflict of interest statement
Declarations. Ethics approval and consent to participate: This animal study was approved by Animal Care and Ethics Committee of the First Medical Center of PLA General Hospital (No. 2023-X19-90). Consent for publication: Not applicable. Competing interests: The authors declare no competing interests.
Figures

References
-
- Yau T, Kaseb A, Cheng AL, Qin S, Zhu AX, Chan SL, Melkadze T, Sukeepaisarnjaroen W, Breder V, Verset G, et al. Cabozantinib plus atezolizumab versus sorafenib for advanced hepatocellular carcinoma (COSMIC-312): final results of a randomised phase 3 study. Lancet Gastroenterol Hepatol. 2024;9(4):310–22. - DOI - PubMed
-
- Abou-Alfa GK, Geyer SM, Nixon AB, Innocenti F, Shi Q, Kumthekar P, Jacobson S, El Dika I, Yaqubie A, Lopez J, et al. CCALGB 80802 (Alliance): Impact of Sorafenib with and without Doxorubicin on Hepatitis C infection in Patients with advanced hepatocellular carcinoma. Cancer Res Commun. 2024;4(3):682–90. - DOI - PMC - PubMed
MeSH terms
Substances
LinkOut - more resources
Full Text Sources
Research Materials
