. 2024 Nov 23;30(1):227.
doi: 10.1186/s10020-024-00990-w.

Co-culture of human AT2 cells with fibroblasts reveals a MUC5B phenotype: insights from an organoid model

Affiliations

Co-culture of human AT2 cells with fibroblasts reveals a MUC5B phenotype: insights from an organoid model

Yiwen Yao et al. Mol Med. .

Abstract

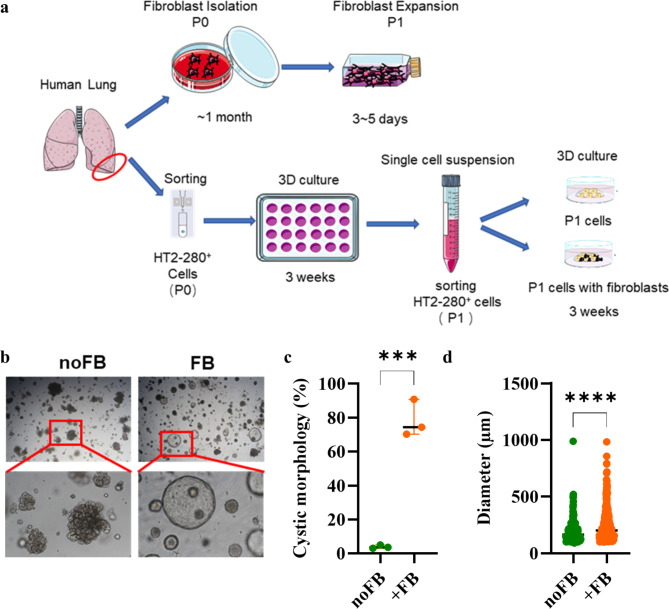
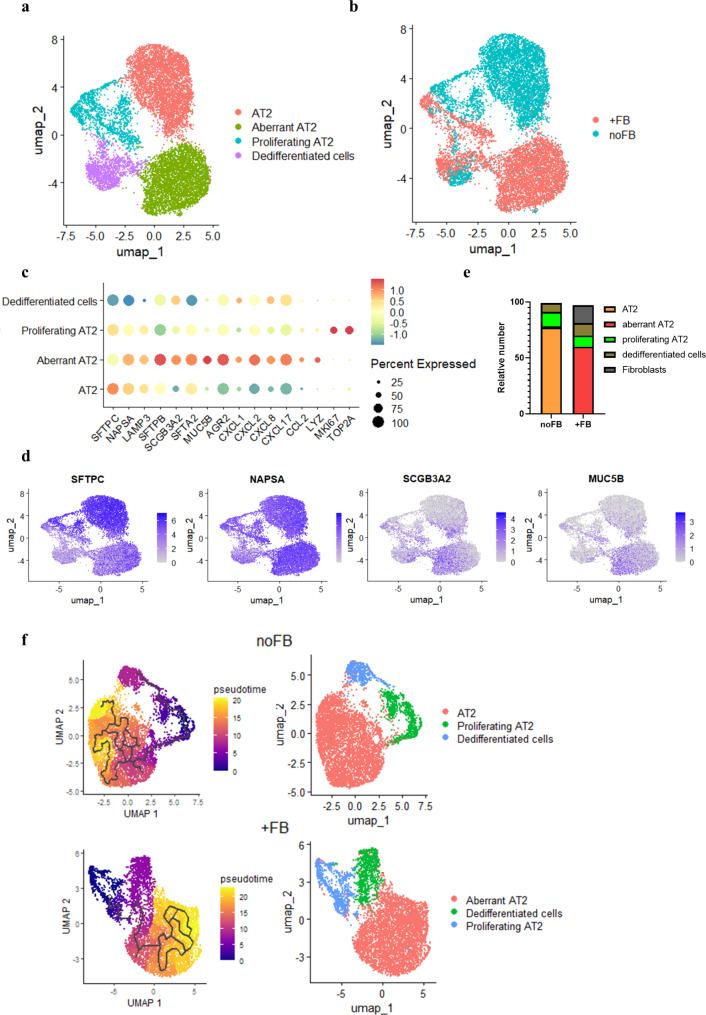
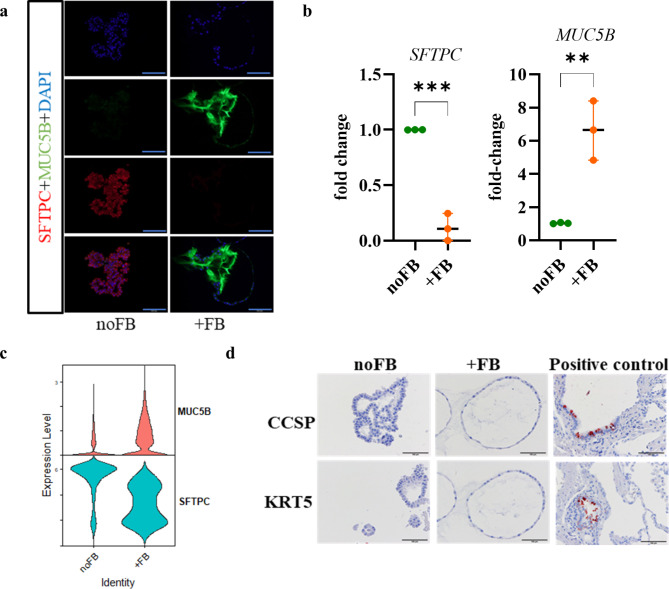
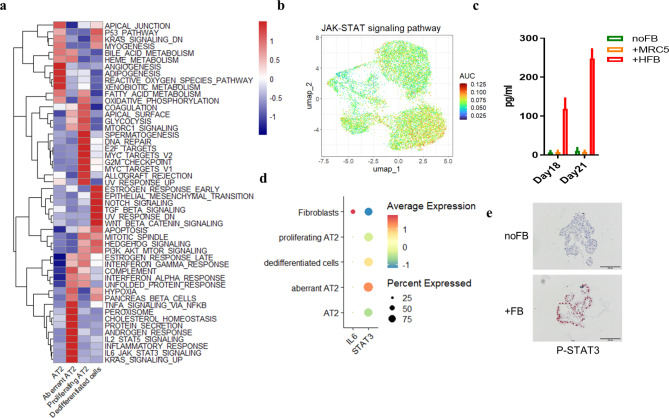
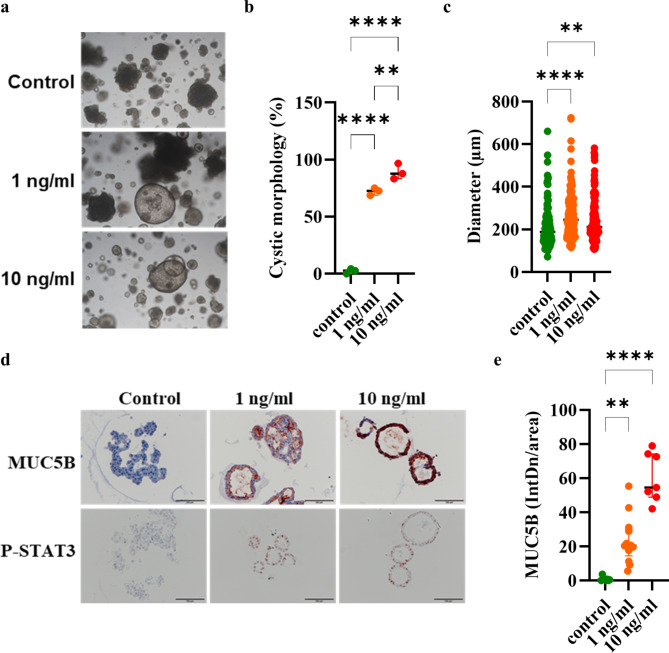
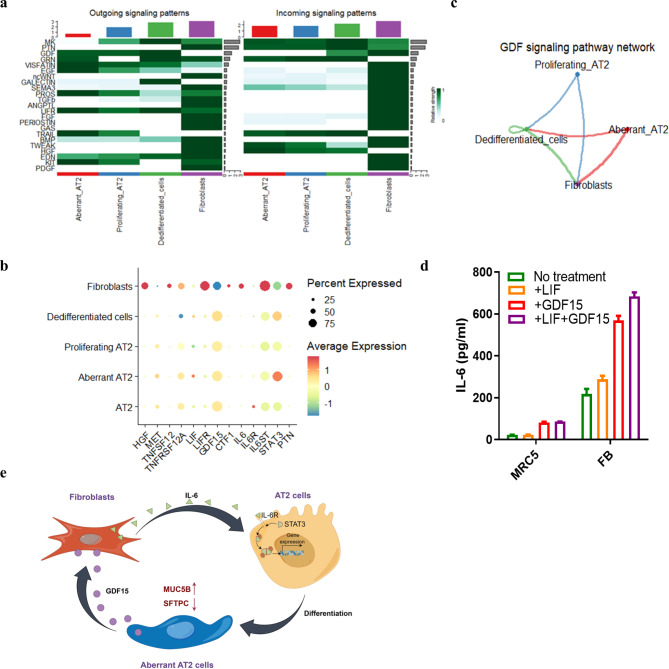
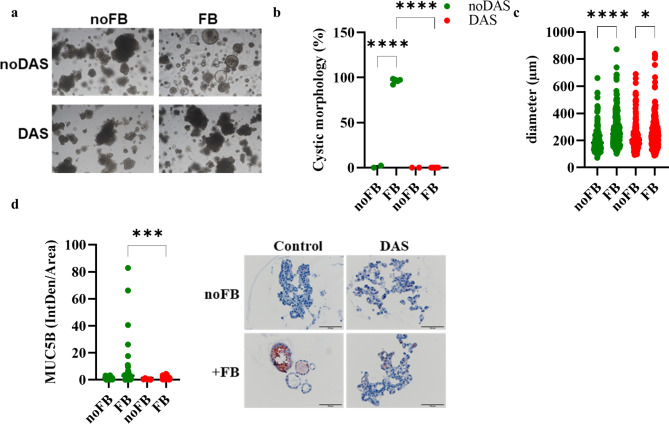
Impaired interaction of fibroblasts with pneumocytes contributes to the progression of chronic lung disease such as idiopathic pulmonary fibrosis (IPF). Mucin 5B (MUC5B) is associated with IPF. Here we analyzed the interaction of primary fibroblasts and alveolar type 2 (AT2) pneumocytes in the organoid model. Single-cell analysis, histology, and qRT-PCR revealed that fibroblasts expressing high levels of fibrosis markers regulate STAT3 signaling in AT2 cells, which is accompanied by cystic organoid growth and MUC5B expression. Cystic growth and MUC5B expression were also caused by the cytokine IL-6. The PI3K-Akt signaling pathway was activated in fibroblasts. The drug dasatinib prevented the formation of MUC5B-expressing cystic organoids. MUC5B associated with AT2 cells in samples obtained from IPF patients. Our model shows that fibrotic primary fibroblasts induce impaired differentiation of AT2 cells via STAT3 signaling pathways, as observed in IPF patients. It can be used for mechanistic studies and drug development.

Keywords: Fibroblast; IPF; Organoid; Pneumocyte; STAT3.


Conflict of interest statement

Declarations. Ethics approval and consent to participate: The protocol for isolation of human cells was approved by the Institutional Review Board (ethics committee, Nr-34/18) of the Saarland State Medical Association and informed consent was obtained from the patients. Consent for publication: Not applicable. Statistics: Graph Prism software (GraphPad Software (version 8.0), San Diego, CA) was used for statistical analysis. Comparisons between groups were analyzed by one-way ANOVA, unpaired t-test or Mann-Whitney test as indicated in the figure legends. The results were considered statistically significant for p < 0.05. Competing interests: The authors declare no competing interests.

Figures

Fig. 1
Fig. 1
Fibroblasts induce cystic organoid growth. (a) Scheme of the experimental layout. (b) Representative phase contrast images of organoids cultured for 21 days (noFB: AT2 cells cultured without fibroblasts (FB); FB: AT2 cells cultured in the presence of fibroblasts, P1: passage 1). (c) Quantification of the morphology of the alveolar organoids. Data were compared by unpaired t-test (***p < 0.001). Each data point represents an independent experiment. (d) Quantification of the diameter of the alveolar organoids. Pooled results from 3 independent experiments. Data were compared by Mann-Whitney test (****p < 0.0001)
Fig. 2
Fig. 2
Fibroblasts show a pro-fibrotic phenotype. (a) Violin plots showing the expression levels of fibrosis markers for the three donors (F1-3). (b) Heatmap for markers of pathogenic fibroblasts. Key pro-fibrotic genes are highlighted
Fig. 3
Fig. 3
Fibroblasts drive the differentiation of AT2 cells toward a secretory phenotype. (a) UMAP visualization of different cell types. (b) UMAP visualization colored by groups (noFB: AT2 cells cultured without fibroblasts; +FB: AT2 cells cultured in the presence of fibroblasts). (c) Dot plot showing expression of epithelial cell type markers and secretory factors markers. (d) Feature plots showing the expression of representative markers for AT2 and secretory cells. (e) Proportion of the different cell clusters. (f) Pseudotime trajectory analysis by Monocle 3 of the two groups
Fig. 4
Fig. 4
Fibroblasts induce the expression of MUC5B. (a) Organoids were stained for SFTPC and MUC5B by immunofluorescence (Scale bar = 100 μm). (b) The expression of SFTPC and MUC5B was confirmed by semi-quantitative RT-PCR. Data were compared by unpaired t test (**p < 0.01, ***p < 0.001). Each data point represents an independent experiment. (c) Violin plots showing expression of SFTPC and MUC5B. (d) Immunohistochemistry was performed for CCSP and KRT5 (positive control: human lung tissue; scale bar = 100 μm)
Fig. 5
Fig. 5
Strong expression of MUC5B in fibrotic lesions in lungs of IPF patients. MUC5B and SFTPC were detected by immunofluorescence in human lung samples obtained from a healthy donor and two IPF patients (scale bar = 100 μm)
Fig. 6
Fig. 6
Fibroblasts activate IL-6/STAT3 pathways. Signaling pathways were analyzed by (a) GSVA and (b) AUCell. (c) IL-6 was measured in supernatants of the cultures at day 18 and 21. (d) Dot plot showing expression of IL-6 and STAT3. (e) Immunohistochemistry was performed for P-STAT3 (scale bar = 100 μm)
Fig. 7
Fig. 7
IL-6 induces the differentiation of AT2 cells towards a MUC5B+ cystic phenotype. The organoid cultures were stimulated with IL-6 from the day of seeding. (a) Representative phase contrast images of organoids cultured for 21 days. (b) Quantification of the morphology of the alveolar organoids. (c) Quantification of the diameter of the alveolar organoids. (d) Immunohistochemistry was performed for MUC5B and P-STAT3 (scale bar = 100 μm). (e) Quantification of MUC5B staining. Data were compared by one-way ANOVA (**p < 0.01, ****p < 0.0001)
Fig. 8
Fig. 8
Fibroblasts activate IL-6/STAT3, TNF-α and HGF pathways in aberrant AT2 cells. (a) Heatmap (prediction of the CellChat algorithm) with outgoing and incoming signals in the different cell types. (b) Dot plot showing expression of selected ligands and receptors. (c) Signaling activity of GDF15 between epithelial cells and fibroblasts predicted by CellChat algorithm. (d) Primary fibroblasts and the cell line MRC5 were incubated for 24 h with GDF15 (200 ng/ml) and LIF (100 ng/ml) and IL-6 concentrations were measured in the supernatants. (e) Proposed schematic diagram of fibroblast-epithelial cell interaction.
Fig. 9
Fig. 9
Dasatinib reduces cystic organoid formation. The organoid cultures were incubated with dasatinib (200 nM) from the day of seeding. (A) Representative phase contrast images of organoids cultured for 21 days. (B) Quantification of the morphology of the alveolar organoids. Each data point represents an independent experiment. (C) Quantification of the diameter of the alveolar organoids. (D) Immunohistochemistry was performed for MUC5B (scale bar = 100 μm). (E) Quantification of MUC5B staining. Pooled results from 3 independent experiments. Data were compared by one-way ANOVA (*p < 0.05, ***p < 0.01, ****p < 0.0001)

References

    1. Adams TS, et al. Single-cell RNA-seq reveals ectopic and aberrant lung-resident cell populations in idiopathic pulmonary fibrosis. Sci Adv. 2020;6:eaba1983. - PMC - PubMed
    1. Alsafadi HN, et al. An ex vivo model to induce early fibrosis-like changes in human precision-cut lung slices. Am J Physiol Lung Cell Mol Physiol. 2017;312:L896–902. - PubMed
    1. Alysandratos KD, et al. Culture impact on the transcriptomic programs of primary and iPSC-derived human alveolar type 2 cells. JCI Insight; 2022. - PMC - PubMed
    1. Aros CJ, Pantoja CJ, Gomperts BN. Wnt signaling in lung development, regeneration, and disease progression. Commun Biol. 2021;4:601. - PMC - PubMed
    1. Barkauskas CE, et al. Type 2 alveolar cells are stem cells in adult lung. J Clin Invest. 2013;123:3025–36. - PMC - PubMed

LinkOut - more resources