. 2024 Nov 22;22(1):552.
doi: 10.1186/s12916-024-03769-2.

Estimation of physiological aging based on routine clinical biomarkers: a prospective cohort study in elderly Chinese and the UK Biobank

Affiliations

Estimation of physiological aging based on routine clinical biomarkers: a prospective cohort study in elderly Chinese and the UK Biobank

Ziwei Zhu et al. BMC Med. .

Abstract

Background: Chronological age (CA) does not reflect individual variation in the aging process. However, existing biological age predictors are mostly based on European populations and overlook the widespread nonlinear effects of clinical biomarkers.

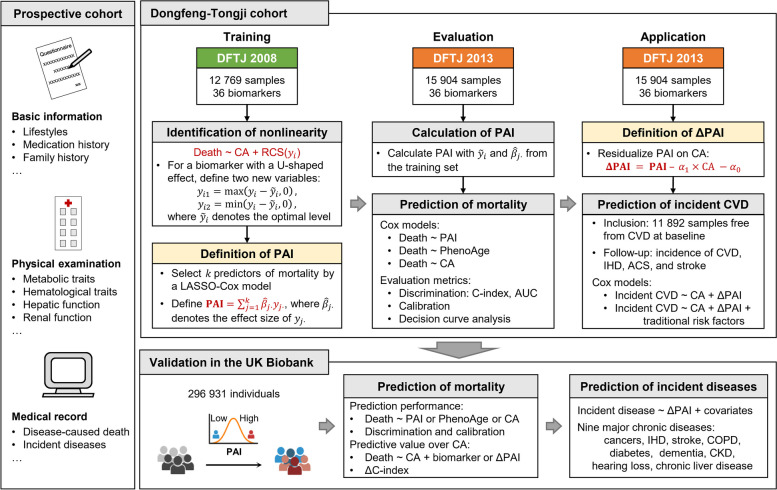
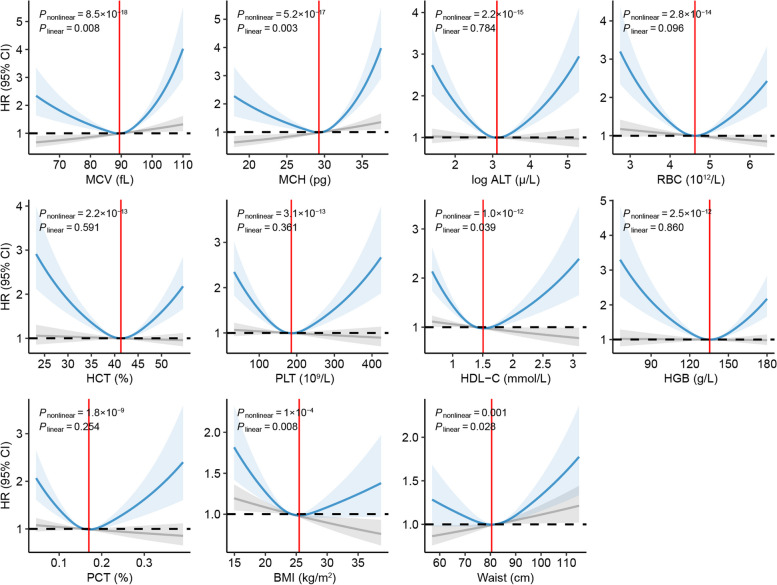
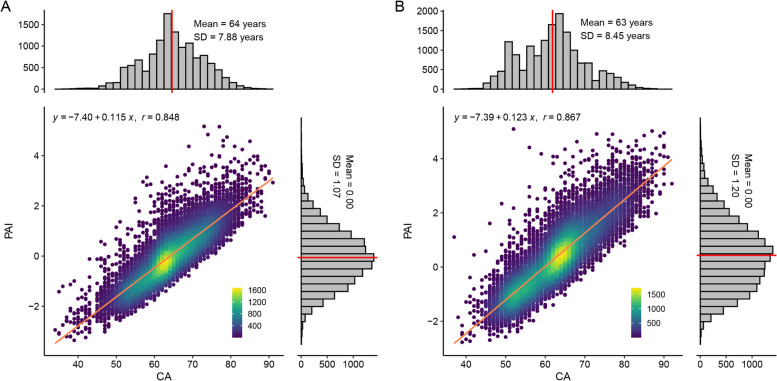
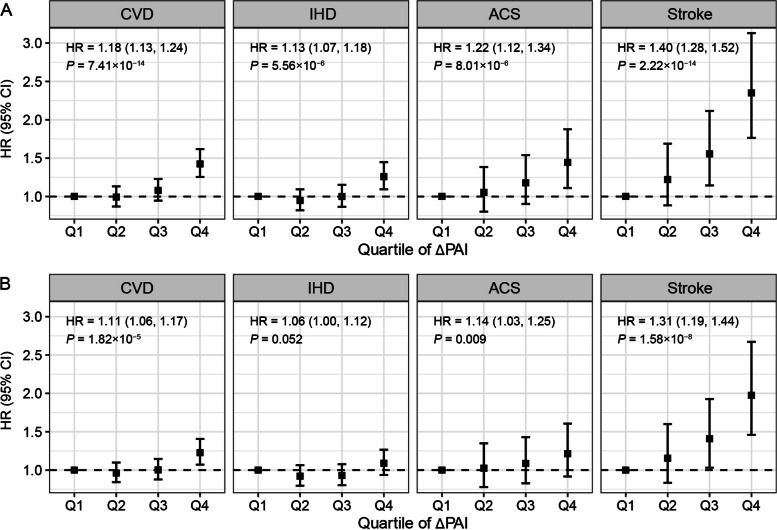
Methods: Using data from the prospective Dongfeng-Tongji (DFTJ) cohort of elderly Chinese, we propose a physiological aging index (PAI) based on 36 routine clinical biomarkers to measure aging progress. We first determined the optimal level of each biomarker by restricted cubic spline Cox models. For biomarkers with a U-shaped relationship with mortality, we derived new variables to model their distinct effects below and above the optimal levels. We defined PAI as a weighted sum of variables predictive of mortality selected by a LASSO Cox model. To measure aging acceleration, we defined ΔPAI as the residual of PAI after regressing on CA. We evaluated the predictive value of ΔPAI on cardiovascular diseases (CVD) in the DFTJ cohort, as well as nine major chronic diseases in the UK Biobank (UKB).

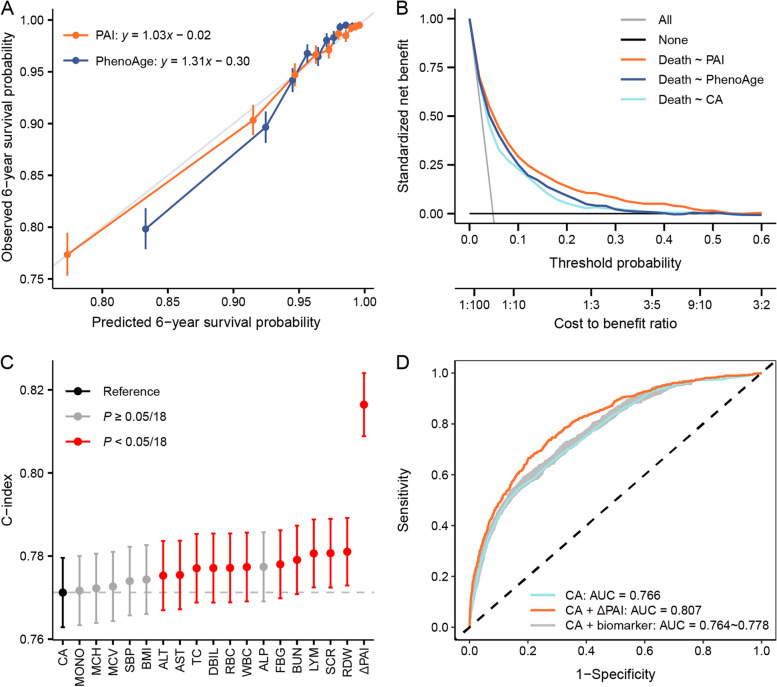
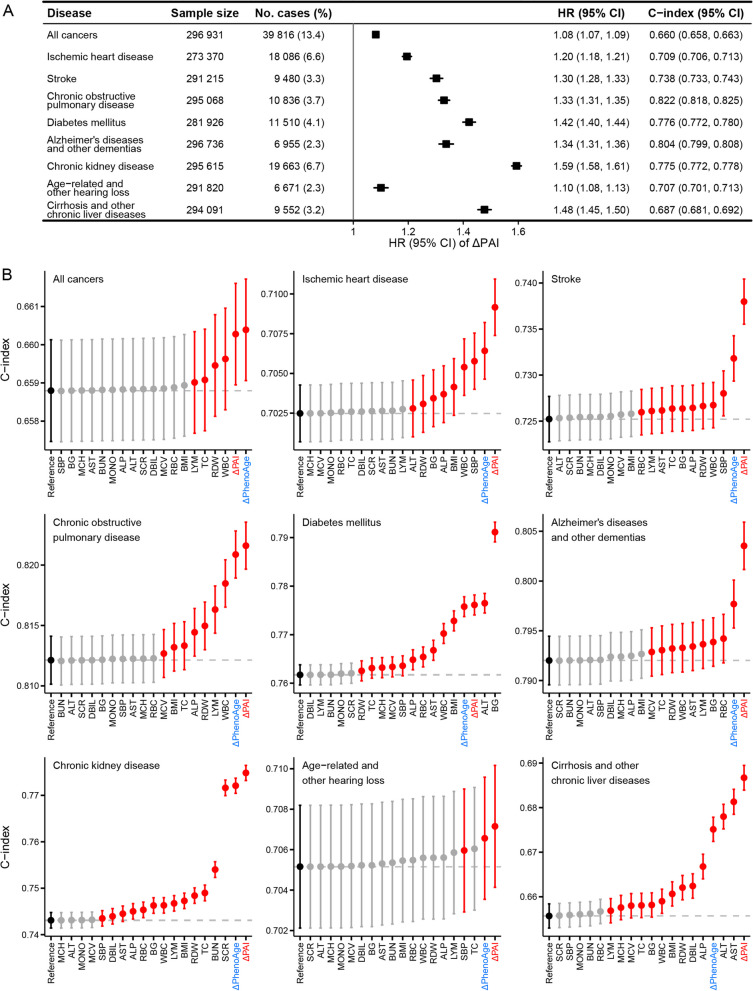
Results: In the DFTJ training set (n = 12,769, median follow-up: 10.38 years), we identified 25 biomarkers with significant nonlinear associations with mortality, of which 11 showed insignificant linear associations. By incorporating nonlinear effects, we selected CA and 17 clinical biomarkers to calculate PAI. In the DFTJ testing set (n = 15,904, 5.87 years), PAI predict mortality with a concordance index (C-index) of 0.816 (95% confidence interval, [0.796, 0.837]), better than CA (C-index = 0.771 [0.755, 0.788]) and PhenoAge (0.799 [0.784, 0.814]). ΔPAI was predictive of incident CVD and its subtypes, independent of traditional risk factors. In the external validation set of UKB (n = 296,931, 12.80 years), PAI achieved a C-index of 0.749 (0.746, 0.752) to predict mortality, remaining better than CA (0.706 [0.702, 0.709]) and PhenoAge (0.743 [0.739, 0.746]). In both DFTJ and UKB, PAI calibrated better than PhenoAge when comparing the predicted and observed survival probabilities. Furthermore, ΔPAI outperformed any single biomarker to predict incident risks of eight age-related chronic diseases.

Conclusions: Our results highlight the potential of PAI and ΔPAI as integrative biomarkers to evaluate aging acceleration and facilitate the development of targeted intervention strategies for healthy aging.

Keywords: Aging; Biological age; Clinical biomarker; Mortality; Nonlinear association.


Conflict of interest statement

Declarations. Ethics approval and consent to participate: All participants from the Dongfeng-Tongji cohort provided written informed consent. The study protocol was approved by the Medical Ethics Committee of Tongji Medical College, Huazhong University of Science and Technology (2012–10). Consent for publication: Not applicable. Competing interests: The authors declare no competing interests.

Figures

Fig. 1
Fig. 1
Overall study design
Fig. 2
Fig. 2
Associations with mortality for biomarkers with significant nonlinear but insignificant linear relationships. HRs and CIs in linear associations, represented by grey and the shaded areas, were estimated using Cox regressions. HRs and CIs in nonlinear associations, represented by blue and the shaded areas, were estimated using Cox models with cubic splines, adjusted for CA. The mean value of each biomarker was set as the reference to calculate HR. The vertical red line indicates the optimal level corresponding to the lowest HR in the RCS curve. P values from both nonlinear and linear models were listed at every panel
Fig. 3
Fig. 3
Joint distribution of PAI and CA. A Training set. B Testing set. Distributions of CA and standardized PAI are shown on the top side and in the right of each panel, respectively. The point density is represented by color. The red line represents the mean value of CA or PAI. The orange line represents the linear fitting line of PAI on CA
Fig. 4
Fig. 4
Prediction of mortality using PAI and ΔPAI in the DFTJ testing set. A Calibration plot of the predicted and mean observed 6-year survival probability within each decile group, defined by the predicted 6-year survival probability. Vertical lines show the 95% CIs of the observed 6-year survival probability. Calibration slopes and intercepts are labeled in the equations in the legend. The grey line shows a perfect calibration scenario along the diagonal (y = x). B Decision curve analysis of mortality prediction models based on PAI, PhenoAge, and CA. For comparison, the grey and black lines indicate strategies assuming all or no individuals are treated. C C-index of models with CA as the only covariate (reference), as well as CA and biomarker/ΔPAI as covariates. Each dot indicates the C-index estimate, with vertical lines showing one standard error. The dashed line represents the C-index of the reference model. Models showing significant improvement over the reference model (P < 0.05/18) are highlighted in red. D The ROC curves at 6-year interval of models with CA (blue), CA and ΔPAI (orange), or CA and single biomarker (grey) as covariates
Fig. 5
Fig. 5
HRs of ΔPAI on incident CVD and its subtypes. A Base model with only CA as a covariate. B Full model with CA and other traditional risk factors of CVD as the covariates. The black squares represent dot estimates of HRs, and the vertical lines represent 95% CIs. HR per SD increases in ΔPAI and the corresponding P values are listed at the top-left of each panel
Fig. 6
Fig. 6
Prediction value of ΔPAI, ΔPhenoAge, and single biomarker on mortality risk in the UKB. A HRs per SD increase of ΔPAI on nine major chronic diseases in the UKB. HRs of ΔPAI were estimated in Cox models with CA, smoking, drinking, obesity status, and the Townsend index as covariates. No. cases (%) indicates the number of cases (percentage) for each disease. B Model comparison for predicting nine major chronic diseases in the UKB. The reference model, which includes CA, sex, smoking, drinking, obesity status, and the Townsend index, is colored in black. Dots represent the C-index estimates, and vertical lines denote one standard error. The dashed line illustrates the C-index of the reference model. Models that show significant increases of C-index over the reference model are colored in red (P < 0.05/19)

References

    1. Beard JR, Officer A, de Carvalho IA, Sadana R, Pot AM, Michel JP, et al. The world report on ageing and health: a policy framework for healthy ageing. Lancet. 2016;387:2145–54. - PMC - PubMed
    1. Partridge L, Deelen J, Slagboom PE. Facing up to the global challenges of ageing. Nature. 2018;561:45–56. - PubMed
    1. Lu AT, Quach A, Wilson JG, Reiner AP, Aviv A, Raj K, et al. DNA methylation GrimAge strongly predicts lifespan and healthspan. Aging (Albany NY). 2019;11:303–27. - PMC - PubMed
    1. Levine ME, Lu AT, Quach A, Chen BH, Assimes TL, Bandinelli S, et al. An epigenetic biomarker of aging for lifespan and healthspan. Aging (Albany NY). 2018;10:573–91. - PMC - PubMed
    1. Belsky DW, Caspi A, Arseneault L, Baccarelli A, Corcoran DL, Gao X, et al. Quantification of the pace of biological aging in humans through a blood test, the DunedinPoAm DNA methylation algorithm. Elife. 2020;9:e54870. - PMC - PubMed

Publication types

LinkOut - more resources