. 2024 Nov 23;12(1):247.
doi: 10.1186/s40168-024-01964-0.

Ileal microbial microbiome and its secondary bile acids modulate susceptibility to nonalcoholic steatohepatitis in dairy goats

Affiliations

Ileal microbial microbiome and its secondary bile acids modulate susceptibility to nonalcoholic steatohepatitis in dairy goats

Yue Wang et al. Microbiome. .

Abstract

Background: Liver damage from nonalcoholic steatohepatitis (NASH) presents a significant challenge to the health and productivity of ruminants. However, the regulatory mechanisms behind variations in NASH susceptibility remain unclear. The gut‒liver axis, particularly the enterohepatic circulation of bile acids (BAs), plays a crucial role in regulating the liver diseases. Since the ileum is the primary site for BAs reabsorption and return to the liver, we analysed the ileal metagenome and metabolome, liver and serum metabolome, and liver single-nuclei transcriptome of NASH-resistant and susceptible goats together with a mice validation model to explore how ileal microbial BAs metabolism affects liver metabolism and immunity, uncovering the key mechanisms behind varied NASH pathogenesis in dairy goats.

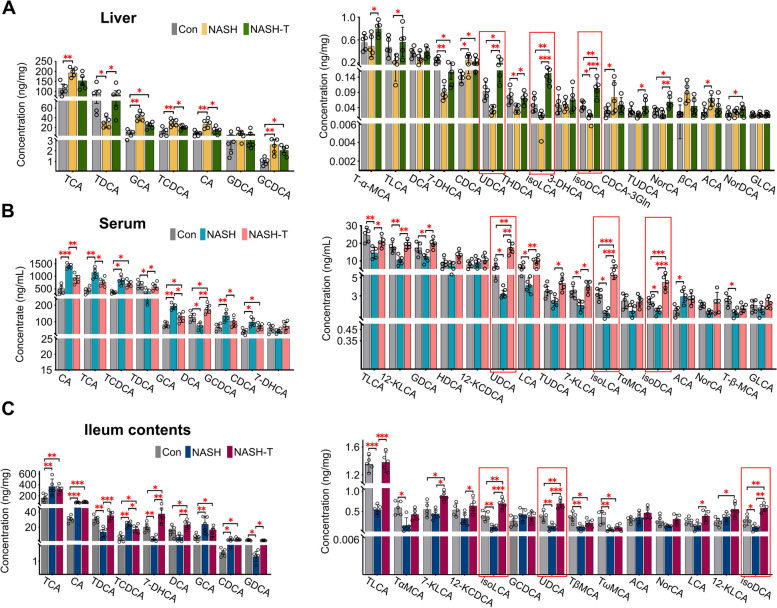
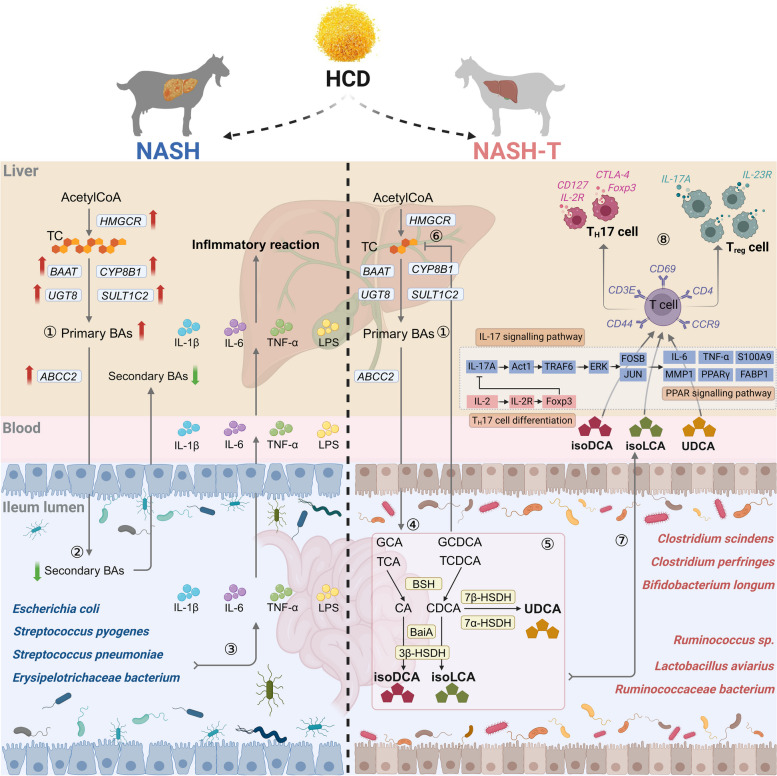
Results: In NASH goats, increased total cholesterol (TC), triglyceride (TG), and primary BAs and decreased secondary BAs in the liver and serum promoted hepatic fat accumulation. Increased ileal Escherichia coli, Erysipelotrichaceae bacterium and Streptococcus pneumoniae as well as proinflammatory compounds damaged ileal histological morphology, and increased ileal permeability contributes to liver inflammation. In NASH-tolerance (NASH-T) goats, increased ursodeoxycholic acid (UDCA), isodeoxycholic acid (isoDCA) and isolithocholic acid (isoLCA) in the liver, serum and ileal contents were attributed to ileal secondary BAs-producing bacteria (Clostridium, Bifidobacterium and Lactobacillus) and key microbial genes encoding enzymes. Meanwhile, decreased T-helper 17 (TH17) cells and increased regulatory T (Treg) cells proportion were identified in both liver and ileum of NASH-T goats. To further validate whether these key BAs affected the progression of NASH by regulating the proliferation of TH17 and Treg cells, the oral administration of bacterial UDCA, isoDCA and isoLCA to a high-fat diet-induced NASH mouse model confirmed the amelioration of NASH through the TH17 cell differentiation/IL-17 signalling/PPAR signalling pathway by these bacterial secondary BAs.

Conclusion: This study revealed the roles of ileal microbiome and its secondary BAs in resilience and susceptibility to NASH by affecting the hepatic Treg and TH17 cells proportion in dairy goats. Bacterial UDCA, isoDCA and isoLCA were demonstrated to alleviate NASH and could be novel postbiotics to modulate and improve the liver health in ruminants. Video Abstract.

Keywords: Dairy goats; Ileal microbiome; Intrahepatic TH17 cells and Treg cells; Nonalcoholic steatohepatitis susceptibility; Secondary bile acids.


Conflict of interest statement

Declarations. Ethics approval and consent to participate: All the experimental designs and protocols used in the present study were approved by the Institutional Animal Care and Use Committee (IACUC) of Northwest A&F University (Shaanxi, China, approval number: NWAFU-DK-2022020) and were in accordance with the recommendations of the university’s guidelines for animal research. Consent for publication: Not applicable. Competing interests: The authors declare no competing interests.

Figures

Fig. 1
Fig. 1
Phenotypes of NASH and NASH-T in dairy goats fed HCD. A The serum ALT, AST, TC and TG levels of goats in the LCD and HCD groups were continuously monitored on the last day of every 2 weeks (n = 15). B Representative Sirius red, H&E and Oil red O-stained sections of livers from Con, NASH and NASH-T goats (scale bar, 10 μm). In the HCD group, 10 dairy goats developed NASH, which was referred to as the NASH group. The other five goats from the HCD group did not present with NASH symptoms and were included in the NASH-tolerant (NASH-T) group. The LCD group served as the control group. C Proportion of fibrous tissue area, number of inflammatory cells and lipid droplet area in the livers of the Con, NASH and NASH-T groups. D The concentrations of IL-1β, IL-4, IL-6, IL-10, LPS, TNF-α, TC, TG, ALT and AST in the liver and serum of the Con, NASH and NASH-T groups (n = 5). Data of the serum ALT, AST, TC and TG (A) were analysed using repeated measures via a general linear model, followed by Tukey’s honestly significant difference (HSD) test. The proinflammatory cytokines are expressed as the mean ± SEM, and one-way ANOVA was performed, followed by Tukey’s HSD test. *P < 0.05, **P < 0.01, ***P < 0.001 indicate significance. Con, control group; HCD, high-concentrate diet; LCD, low-concentrate diet; NASH, nonalcoholic steatohepatitis; NASH-T, nonalcoholic steatohepatitis tolerance; ALT, alanine transaminase; AST, aspartate transaminase; TC, total cholesterol; TG, triglyceride; FDR, false discovery rate
Fig. 2
Fig. 2
Profiles of BAs in the serum, liver and ileum contents of Con, NASH and NASH-T goats. Targeted BAs metabolomic profiling of the A liver, B serum and C ileum contents. The data are expressed as the mean ± SEM, and one-way ANOVA was performed, followed by Tukey’s HSD test (E). *P < 0.05, **P < 0.01, ***P < 0.001 indicate significance. BAs, bile acids; Con, control group; NASH, nonalcoholic steatohepatitis group; NASH-T, nonalcoholic steatohepatitis tolerance group
Fig. 3
Fig. 3
Different ileum bacteria and altered secondary BAs biosynthesis functions among the Con, NASH and NASH-T groups. A The bacterial β-diversity and B α-diversity in the ileum contents of the Con, NASH and NASH-T groups. C LEfSE analysis revealed differential ileum bacteria among the Con, NASH and NASH-T groups from the phylum to the species level. D Co-occurrence network analysis of bacteria in the ileum of dairy goats in the Con, NASH and NASH-T groups. The node size indicates the abundance of a species. E Altered genes in the secondary BAs biosynthesis pathway. F Sankey diagram showing the bacteria whose genes encode the key enzymes in the secondary BAs biosynthesis pathway. BAs, bile acids; Con, control group; NASH, nonalcoholic steatohepatitis group; NASH-T, nonalcoholic steatohepatitis tolerance group
Fig. 4
Fig. 4
Single-nuclei RNA sequencing showed differences in liver cell types among Con, NASH and NASH-T goats. A UMAP plot visualization of seven liver cell types. B Differences in the proportions of liver cell types among the Con, NASH and NASH-T groups. C UMAP plot visualization of eight T-cell subsets. D Differences in the proportions of liver T-cell subsets among the Con, NASH and NASH-T groups. KEGG pathway enrichment of differentially expressed genes among the Con, NASH and NASH-T groups in E TH17 cells and F Treg cells. Con, control group; NASH, nonalcoholic steatohepatitis group; NASH-T, nonalcoholic steatohepatitis tolerance group; Con, control group; NASH, nonalcoholic steatohepatitis group; NASH-T, nonalcoholic steatohepatitis tolerance group
Fig. 5
Fig. 5
Immunofluorescence analysis of the marker genes of TH17 and Treg cells. A, C, E Immunofluorescence identification of marker genes of TH17 cells (IL-17A and IL-23R) and Treg cells (Foxp3, CTLA-4, CD127 and IL-2RA). B, D, F Differences in the antibody-positive areas among the Con, NASH and NASH-T groups. Con, control group; NASH, nonalcoholic steatohepatitis group; NASH-T, nonalcoholic steatohepatitis tolerance group
Fig. 6
Fig. 6
Effects of oral administration of isoDCA, isoLCA and UDCA on NASH amelioration. A A mouse model of NASH was induced via a high-fat diet. After the NASH model was successfully established, UDCA, isoDCA and isoLCA were orally administered to the mice. B Concentrations of serum ALT, AST, TC and TG in the different groups. Representative C H&E, D Oil red O and (E) Sirius red-stained sections of livers from the Con, NASH, isoDCA, isoLCA and UDCA consumption groups are shown (scale bar, 50 μm). Effects of isoDCA, isoLCA and UDCA supplementation on the differentiation of F TH17 and G Treg cells in the liver. H Representative Western blots of the IL-17A, Act1, TRAF6, ERK, JNK, FOSB, IL-6, TNF-α, S100A9, IL-23R, RORγt, MMP1, PPARγ, FABP1, IL-2R and Foxp3 signatures in the livers of mice in the Con, NASH, isoDCA, isoLCA and UDCA consumption groups. I The relative expression levels of IL-17A, Act1, TRAF6, ERK, JNK, FOSB, IL-6, TNF-α, S100A9, IL-23R, RORγt, MMP1, PPARγ, FABP1, IL-2R and Foxp3 in the different groups were determined (n = 3). The data are expressed as the mean ± SEM, and one-way ANOVA was performed, followed by Tukey’s HSD test. ALT, alanine transaminase; AST, aspartate transaminase; TC, total cholesterol; TG, triglyceride; H&E, haematoxylin‒eosin staining; NIC, number of inflammatory; LDEA, lipid droplet expression area; FTEA, fibrous tissue expression area; UDCA, ursodeoxycholic acid; isoDCA, isodeoxycholic acid; isoLCA and isolithocholic acid; Con, control group; NASH, nonalcoholic steatohepatitis group; NASH-T, nonalcoholic steatohepatitis tolerance group
Fig. 7
Fig. 7
Mechanism by which secondary BAs regulate liver TH17/Treg cell differentiation to maintain NASH tolerance. ① Long-term HCD feeding induces the expression of HMGCR to promote TC synthesis in the liver. More primary BAs are synthesized in large quantities from TC. ② In the livers of NASH goats, increased expression levels of SULT1C2, UGT8, ABCC2 and BAAT promote bile secretion, which results in the accumulation of primary BAs in the liver, serum and intestinal tract. ③ In the ileum contents of NASH goats, potential pathogenic microorganisms, such as Erysipelotrichaceae, Escherichia and Streptococcus, produce more proinflammatory cytokines, which enter the liver through the circulation and cause liver inflammation. ④ In NASH-T goats, liver-derived primary BAs are secreted into the intestinal tract. ⑤ More BAs-producing bacteria from the Bifidobacterium, Clostridium and Lactobacillus genera are enriched in the ileum contents of NASH-T goats, which produce a large number of secondary BAs, especially UDCA, isoLCA and isoDCA catalysed by BSH, BaiA, 7β-HSDH, 7α-HSDH and 3β-HSDH. ⑥ The production of secondary BAs accelerates cholesterol clearance. ⑦, ⑧ Moreover, the return of secondary BAs to the liver through the portal vein inhibits TH17 cell differentiation and promotes Treg cell proliferation in the liver by regulating the expression of genes involved in the TH17 cell differentiation/IL-17/PPAR signalling pathway, thereby preventing NASH occurrence. HCD, high-concentrate diet; TC, total triglycerides; BAs, bile acids; HMGCR, 3-hydroxy-3-methylglutaryl-CoA reductase; BAAT, bile acid-CoA amino acid N-acyltransferase; CYP8B1, cytochrome P450 family 8 subfamily B member 1; SULT1C2, sulfotransferase family 1C member 2, transcript variant X3; ABCC2, ATP-binding cassette subfamily C member 2. BSH, bile salt hydrolase; 7α-HSDH, 7α-hydroxysteroid dehydrogenase; BaiA, 3α-hydroxycholanate dehydrogenase (NADP +); 7β-HSDH, 7β-hydroxysteroid dehydrogenase (NADP +); 3β-HSDH, 3β-hydroxy-delta5-steroid dehydrogenase; NASH, nonalcoholic steatohepatitis; NASH-T, nonalcoholic steatohepatitis tolerance; NAFL, nonalcoholic fatty liver

References

    1. Soares RAN, Vargas G, Muniz MMM, Soares MAM, Cánovas A, Schenkel F, Squires EJ. Differential gene expression in dairy cows under negative energy balance and ketosis: a systematic review and meta-analysis. J Dairy Sci. 2021;104(1):602–15. - PubMed
    1. Chirivi M, Cortes-Beltran D, Munsterman A, O’Connor A, Contreras GA. Lipolysis inhibition as a treatment of clinical ketosis in dairy cows: a randomized clinical trial. J Dairy Sci. 2023;106(12):9514–31. - PubMed
    1. Du X, Chen M, Fang Z, Shao Q, Yu H, Hao X, Gao X, Ju L, Li C, Yang Y, Song Y, Lei L, Liu G, Li X. Evaluation of hepatic AMPK, mTORC1, and autophagy-lysosomal pathway in cows with mild or moderate fatty liver. J Dairy Sci. 2024;107(5):3269–79. - PubMed
    1. Chandra Roy A, Wang Y, Zhang H, Roy S, Dai H, Chang G, Shen X. Sodium butyrate mitigates iE-DAP induced inflammation caused by high-concentrate feeding in liver of dairy goats. J Agric Food Chem. 2018;66(34):8999–9009. - PubMed
    1. Zhang H, Shi H, Xie W, Meng M, Wang Y, Ma N, Chang G, Shen X. Subacute ruminal acidosis induces pyroptosis via the mitophagy-mediated NLRP3 inflammasome activation in the livers of dairy cows fed a high-grain diet. J Dairy Sci. 2024;24(S0022-0302):00042. - PubMed

Substances

LinkOut - more resources