

Epigenetic age and long-term cancer risk following a stroke
- PMID: 39578904
- PMCID: PMC11583382
- DOI: 10.1186/s13073-024-01408-2
Epigenetic age and long-term cancer risk following a stroke
Abstract
Background: The association between increased cancer risk following a cerebrovascular event (CVE) has been previously reported. We hypothesize that biological age (B-age) acceleration is involved in this association. Our study aims to examine B-age as a novel contributing factor to cancer development post-CVE.
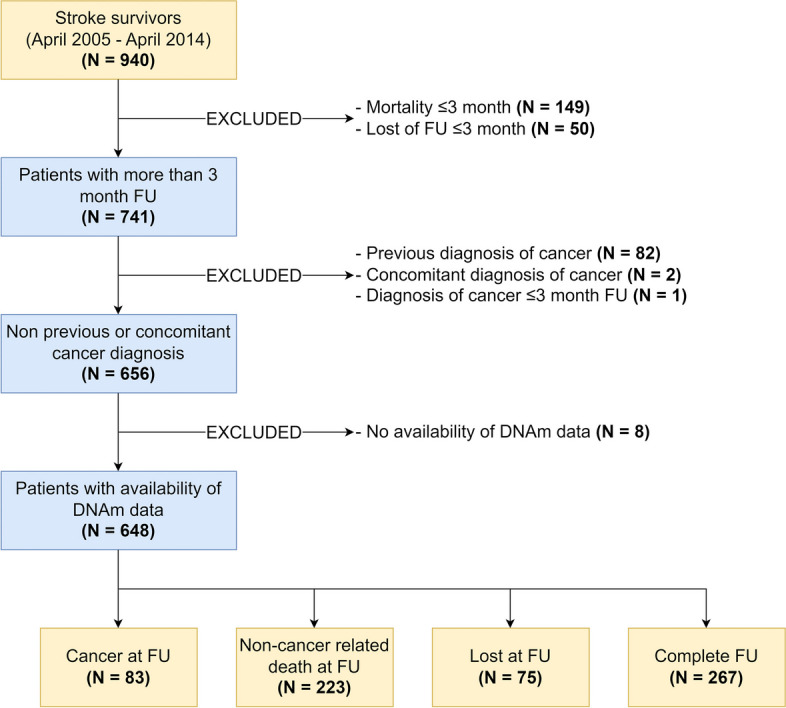
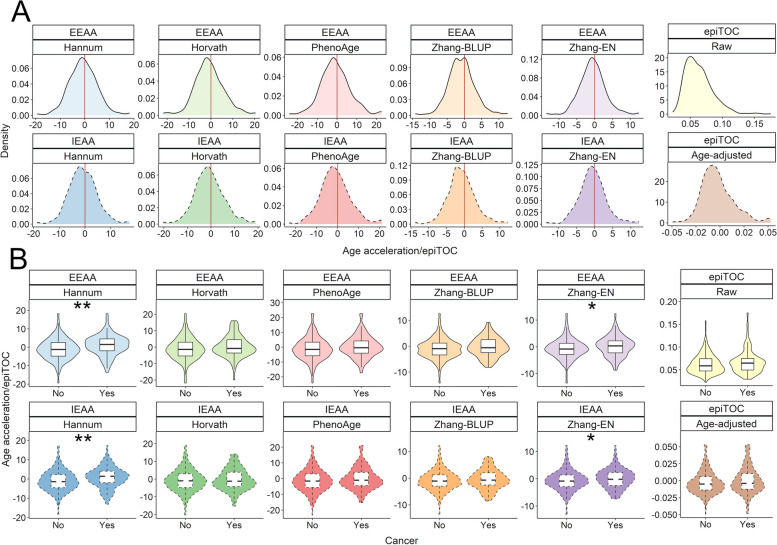
Methods: From our prospective stroke registry (BasicMar), we selected 940 cases with epigenetic data. For this study, we specifically analyzed 648 of these patients who had available data, no prior history of cancer, and a minimum follow-up of 3 months. The primary outcome was cancer incidence. B-age was estimated using DNA methylation data derived from whole blood samples obtained within 24 h of stroke onset, employing various epigenetic clocks (including Hannum, Horvath, PhenoAge, ZhangBLUP, ZhangEN, and the mitotic epiTOC). Extrinsic epigenetic age acceleration (EEAA) was calculated as the residuals from the regression of B-age against chronological age (C-age). For epiTOC, the age-adjusted values were obtained by regressing out the effect of age from the raw epiTOC measurements. Estimated white cell counts were derived from DNA methylation data, and these cell fractions were used to compute the intrinsic epigenetic age acceleration (IEAA). Subsequently, we evaluated the independent association between EEAA, IEAA, and cancer incidence while controlling for potential confounding variables.
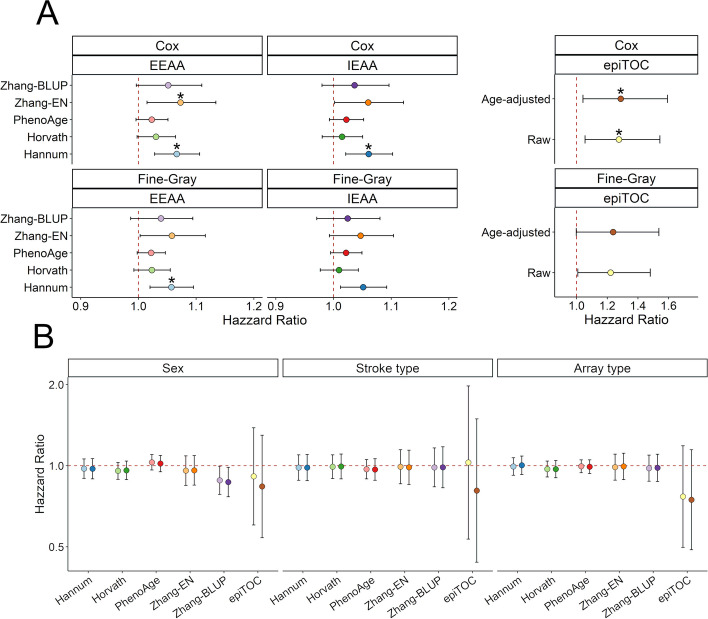
Results: Among 648 patients with a median follow-up of 8.15 years, 83 (12.8%) developed cancer. Cox multivariable analyses indicated significant associations between Hannum, Zhang, and epiTOC EEAA and the risk of cancer after CVE. After adjusting for multiple testing and competing risks, EEAA measured by Hannum clock maintained an independent association with cancer risk. Specifically, for each year increase in Hannum's EEAA, we observed a 6.0% increased incidence of cancer (HR 1.06 [1.02-1.10], p value = 0.002).
Conclusions: Our findings suggest that epigenetic accelerated aging, as indicated by Hannum's EEAA, may play a significant role in the increased cancer risk observed in CVE survivors.
Keywords: Aging; Cancer; DNA methylation; Epigenetic clock; Stroke.
© 2024. The Author(s).
Conflict of interest statement
Declarations. Ethics approval and consent to participate: All the cohorts and samples involved in the study followed the national and international guidelines (Deontological Code, Declaration of Helsinki) and complied with the current personal data protection regulations, The Regulation (EU) 2016/679 of the European Parliament, and Ley Orgánica 3/2018 on protection of digital rights (LOPDPGDD). Local Institutional Review Boards approved all study aspects (CEIm-PSMAR, 2008/3083/l). Informed written consent was obtained from all patients or their relatives to be included in the study. Consent for publication: Not applicable. Competing interests: The authors declare that they have no competing interests.
Figures


References
-
- Wang H, Naghavi M, Allen C, Barber RM, Carter A, Casey DC, et al. Global, regional, and national life expectancy, all-cause mortality, and cause-specific mortality for 249 causes of death, 1980–2015: a systematic analysis for the Global Burden of Disease Study 2015. Lancet. 2016;388:1459–544. - PMC - PubMed
-
- Tybjerg AJ, Skyhøj Olsen T, Andersen KK. Prevalence and risk of occult cancer in stroke. Acta Neurol Scand. 2020;141:204–11. - PubMed
MeSH terms
LinkOut - more resources
Full Text Sources
Medical
Research Materials
