. 2024 Dec 5;111(12):2735-2755.
doi: 10.1016/j.ajhg.2024.10.019. Epub 2024 Nov 22.

Primary cartilage transcriptional signatures reflect cell-type-specific molecular pathways underpinning osteoarthritis

Affiliations

Primary cartilage transcriptional signatures reflect cell-type-specific molecular pathways underpinning osteoarthritis

Georgia Katsoula et al. Am J Hum Genet. .

Abstract

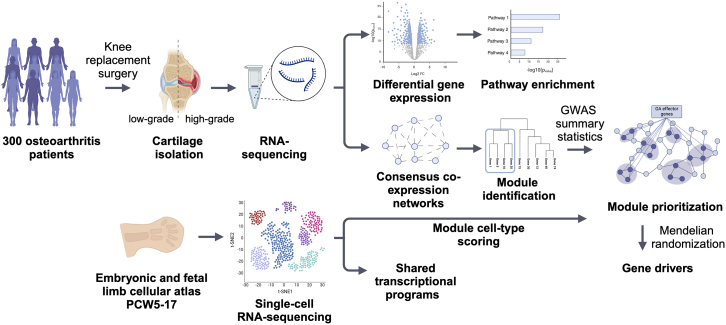
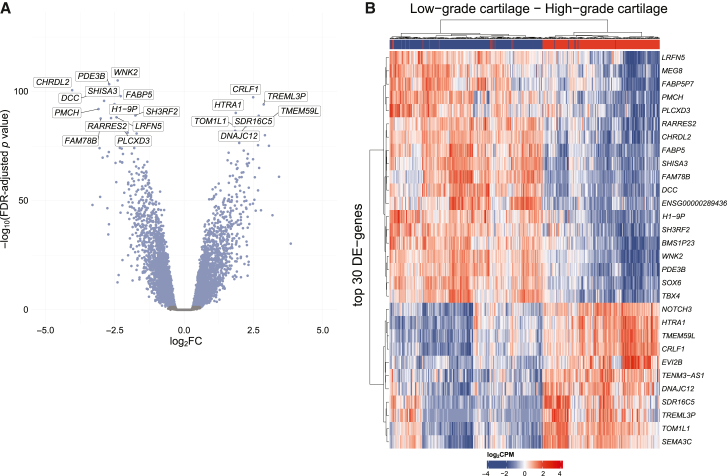
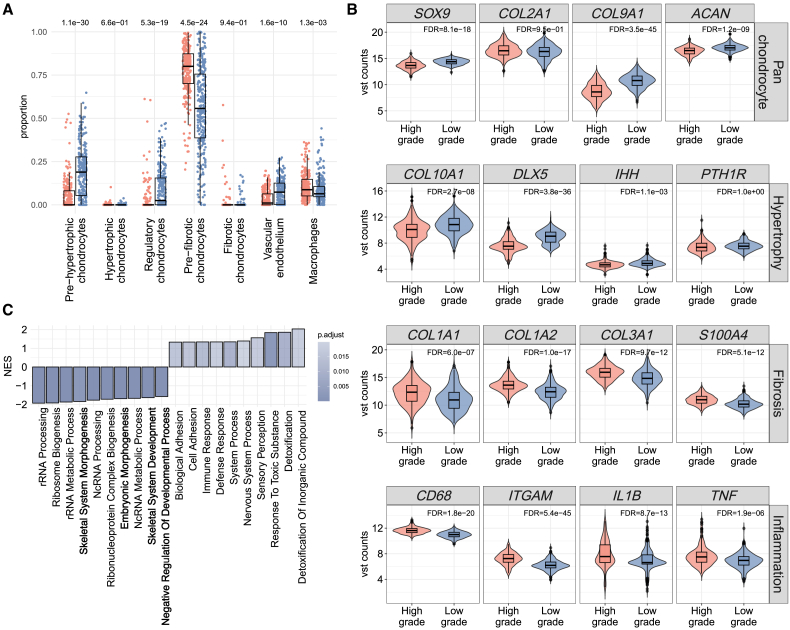
Translational efforts in osteoarthritis are hampered by a gap in our understanding of disease processes at the molecular level. Here, we present evidence of pronounced transcriptional changes in high- and low-disease-grade cartilage tissue, pointing to embryonic processes involved in disease progression. We identify shared transcriptional programs between osteoarthritis cartilage and cell populations in the human embryonic and fetal limb, pointing to increases in pre-hypertrophic chondrocytes' transcriptional programs in low-grade cartilage and increases in osteoblastic signatures in high-grade disease tissue. We find that osteoarthritis genetic risk signals are enriched in six gene co-expression modules and show that these transcriptional signatures reflect cell-type-specific expression along the endochondral ossification developmental trajectory. Using this network approach in combination with causal inference analysis, we present evidence of a causal effect on osteoarthritis risk for variants associated with the expression of ten genes that have not been previously reported as effector genes in genome-wide association studies in osteoarthritis. Our findings point to key molecular pathways as drivers of cartilage degeneration and identify high-value drug targets and repurposing opportunities.

Keywords: RNA sequencing; cell-type-specific expression; chondrocyte populations; disease pathways; endochondral ossification; gene co-expression networks; gene set analysis; osteoarthritis.


Conflict of interest statement

Declaration of interests In the last three years, S.A.T. has been a remunerated consultant for Sanofi, Foresite Labs. and Qiagen and is a consultant and equity holder of TransitionBio and EnsoCell Therapeutics.

Figures

Figure 1
Figure 1
Overview of the study design
Figure 2
Figure 2
Differential gene expression between low- and high-grade osteoarthritis cartilage (A) Volcano plot of differentially expressed (DE) genes between low- and high-grade osteoarthritis cartilage with respect to logarithmic fold change (log2FC) and significance (FDR-adjusted p value). Each dot represents a gene. Blue dots represent DE genes. Highlighted are the top 20 DE genes between low- and high-grade osteoarthritis cartilage. (B) Heatmap of gene expression (log2CPM) of the top 30 DE genes between low- and high-grade osteoarthritis cartilage.
Figure 3
Figure 3
Differential cell type abundance between low- and high-grade cartilage (A) Relative proportions of cell types present in bulk transcriptomes of high-grade and low-grade osteoarthritis cartilage samples obtained from deconvolution analysis (p values were generated using pairwise Wilcoxon rank-sum tests with FDR correction). (B) Expression of representative marker genes used for cell type classification between low- and high-grade osteoarthritis cartilage (variance-stabilized-transformed [vst] gene expression counts after regression of the known batch effect). (C) Bar plot of top 10 upregulated and top 10 downregulated Gene Ontology (GO) biological processes between low- and high-grade cartilage after adjustment for cell type proportions. Processes involved in skeletal system development and embryonic morphogenesis remain downregulated in high-grade cartilage after adjusting for cell type composition (top terms are highlighted in bold). p value is adjusted by FDR.
Figure 4
Figure 4
The relative contribution of single-cell-derived signals from fetal limb tissue in explaining the bulk transcriptomes of 226 high-grade and 272 low-grade osteoarthritis cartilage samples The relative contribution of each signal to each bulk RNA-seq sample is shown on the y axis. Each signal/sample combination is represented by a single point and boxplots showing the distribution with median (middle line), first and third quartiles (box limits), and 1.5 times the interquartile range (whiskers). p values generated by the two-sided Wilcoxon rank-sum test of significant difference between the contribution of cellular signals to low- and high-grade osteorthritis cartilage transcriptomes are displayed above each pair of cell type plots. Color scale represents mean expression within a cluster. ns, non-significant.
Figure 5
Figure 5
Network connectivity of genes encoding for transcription factors (A) Within-module (intramodular) and between-module (inter-modular) connectivity based on consensus co-expression networks; top 25 genes encoding for transcription factors with the highest intramodular connectivity are labeled. (B) Fold change of transcription factor genes shown in (A) between low- and high-grade cartilage. Highlighted in bold are known osteoarthritis effector genes.
Figure 6
Figure 6
Co-expression modules that show enrichment for osteoarthritis GWAS signals and their functional annotation (A) Significant enrichment is observed for knee osteoarthritis risk and total joint and total knee replacement surgery among 6 prioritized modules. (B) Top 5 Gene Ontology biological processes for the prioritized modules depicted in (A). (C) Module-level differential expression between low- and high-grade osteoarthritis cartilage. Bar plot of β values from linear mixed effect model of module eigengene association with disease status (FDR-corrected p < 0.05). (D) Total SNP-based heritability (h2: liability scale for osteoarthritis-relevant phenotypes) calculated from GWAS using LD score regression. Error bars represent the standard error of the mean (SEM) for total heritability. (E) Partitioned heritability for each osteoarthritis trait that can be assigned to prioritized co-expression modules FDR-corrected p < 0.05, ∗∗p < 0.01, and ∗∗∗p < 0.001. Error bars represent jackknife standard errors around the enrichment estimates. (F) Enrichment −log10(FDR) (one-tailed Fisher test) for osteoarthritis risk genes (high-confidence effector genes, putatively causal genes, gene with an eQTL in low- or high-grade cartilage), differentially expressed genes, protein-protein interactions, and genes with a mouse musculoskeletal phenotype for the prioritized modules depicted in (A).
Figure 7
Figure 7
Dot plot of mean expression values of marker genes and osteoarthritis gene modules among cells of the developing fetal skeleton Dot size corresponds to the percentage of cells with non-zero expression. The color scale represents the mean gene expression within a cluster. Exp, expression.

References

    1. Vos T., Lim S.S., Abbafati C., Abbas K.M., Abbasi M., Abbasifard M., Abbasi-Kangevari M., Abbastabar H., Abd-Allah F., Abdelalim A., et al. Global burden of 369 diseases and injuries in 204 countries and territories, 1990–2019: a systematic analysis for the Global Burden of Disease Study 2019. Lancet. 2020;396:1204–1222. doi: 10.1016/S0140-6736(20)30925-9. - DOI - PMC - PubMed
    1. Martel-Pelletier J., Barr A.J., Cicuttini F.M., Conaghan P.G., Cooper C., Goldring M.B., Goldring S.R., Jones G., Teichtahl A.J., Pelletier J.-P. Osteoarthritis. Nat. Rev. Dis. Primers. 2016;2 doi: 10.1038/nrdp.2016.72. - DOI - PubMed
    1. Arden N.K., Perry T.A., Bannuru R.R., Bruyère O., Cooper C., Haugen I.K., Hochberg M.C., McAlindon T.E., Mobasheri A., Reginster J.-Y. Non-surgical management of knee osteoarthritis: comparison of ESCEO and OARSI 2019 guidelines. Nat. Rev. Rheumatol. 2021;17:59–66. doi: 10.1038/s41584-020-00523-9. - DOI - PubMed
    1. Boer C.G., Hatzikotoulas K., Southam L., Stefánsdóttir L., Zhang Y., Coutinho de Almeida R., Wu T.T., Zheng J., Hartley A., Teder-Laving M., et al. Deciphering osteoarthritis genetics across 826,690 individuals from 9 populations. Cell. 2021;184:4784–4818.e17. doi: 10.1016/j.cell.2021.07.038. - DOI - PMC - PubMed
    1. Rice S.J., Tselepi M., Sorial A.K., Aubourg G., Shepherd C., Almarza D., Skelton A.J., Pangou I., Deehan D., Reynard L.N., Loughlin J. Prioritization of PLEC and GRINA as Osteoarthritis Risk Genes Through the Identification and Characterization of Novel Methylation Quantitative Trait Loci. Arthritis Rheumatol. 2019;71:1285–1296. doi: 10.1002/art.40849. - DOI - PMC - PubMed

LinkOut - more resources