. 2024 Dec 24;43(12):114945.
doi: 10.1016/j.celrep.2024.114945. Epub 2024 Nov 22.

PPARγ-dependent remodeling of translational machinery in adipose progenitors is impaired in obesity

Affiliations

PPARγ-dependent remodeling of translational machinery in adipose progenitors is impaired in obesity

Mirian Krystel De Siqueira et al. Cell Rep. .

Abstract

Adipose tissue regulates energy homeostasis and metabolic function, but its adaptability is impaired in obesity. In this study, we investigate the impact of acute PPARγ agonist treatment in obese mice and find significant transcriptional remodeling of cells in the stromal vascular fraction (SVF). Using single-cell RNA sequencing, we profile the SVF of inguinal and epididymal adipose tissue of obese mice following rosiglitazone treatment and find an induction of ribosomal factors in both progenitor and preadipocyte populations, while expression of ribosomal factors is reduced with obesity. Notably, the expression of a subset of ribosomal factors is directly regulated by PPARγ. Polysome profiling of the epididymal SVF shows that rosiglitazone promotes translational selectivity of mRNAs that encode pathways involved in adipogenesis and lipid metabolism. Inhibition of translation using a eukaryotic translation initiation factor 4A (eIF4A) inhibitor is sufficient in blocking adipogenesis. Our findings shed light on how PPARγ agonists promote adipose tissue plasticity in obesity.

Keywords: CP: Metabolism; adipocytes; adipose progenitors; adipose stem cells; diabetes; glucose; obesity; ribosomes; rosiglitazone; translation.


Conflict of interest statement

Declaration of interests The authors declare no competing interests.

Figures
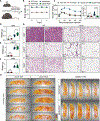
Figure 1.
Figure 1.. Adipose tissue remodeling after acute rosiglitazone treatment
(A) Schematic experimental design: lean (WT) and obese (ob/ob) mice were gavaged with either vehicle (Veh) or rosiglitazone (Rosi) (30 mg/kg) for 3 days. (B) Total body weight after treatment regimen. (C) Intraperitoneal glucose tolerance test with 1 g/kg of glucose. (D–F) Adipose tissue weight: brown adipose tissue (BAT), epididymal white adipose tissue (eWAT), and inguinal white adipose tissue (iWAT). (G) Histological analysis of BAT, eWAT, and iWAT (hematoxylin and eosin staining). (H) Visualization of adipose tissue by PET-CT 1 h after administration of [18F]-FDG (100 mCi) with 1 g/kg of glucose. Data represent the mean ± SEM (n = 8 mice per group). GraphPad (GP) p value style: *p = 0.0332, **p < 0.0021, ***p < 0.0002, and ****p < 0.0001 by one-way ANOVA, multiple comparisons followed by Tukey’s post hoc test, or (C) two-way ANOVA followed by Bonferroni’s post hoc test.
Figure 2.
Figure 2.. PPARγ-driven regulation of adipose tissue heterogeneity
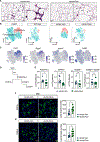
(A) Schematic overview of scRNA-seq: lean C57BL/6J (WT) and obese (ob/ob) mice were treated with either Veh or Rosi for 3 days (30 mg/kg). scRNA-seq was conducted on the stromal vascular fraction extracted from epididymal white adipose tissue (eWAT) and inguinal white adipose tissue (iWAT) separately. (B and C) Uniform manifold approximation and projection (UMAP) plots illustrate the cell clusters among 61,343 eWAT cells and 65,556 iWAT cells. The right three plots separately represent cells from WT-Veh, ob/ob-Veh, and ob/ob-Rosi. Each colored dot signifies a cell, with distinct colors indicating various cell types. The Louvain algorithm was utilized to determine cell clusters. (D and E) Cluster-specific expression of known cell markers.
Figure 3.
Figure 3.. Remodeling of epididymal adipocyte precursor cells in response to PPARγ agonist
(A) Histological analysis of epididymal white adipose tissue (hematoxylin and eosin stain) from either ob/ob-Veh- or ob/ob-Rosi-treated mice. (B) t-distributed stochastic neighbor embedding (t-SNE) plot illustrates two subclusters of adipocyte precursor cells in the eWAT: progenitors and preadipocytes. The right three plots separately represent cells from WT-Veh, ob/ob-Veh, and ob/ob-Rosi. Each color-coded dot represents a cell, with progenitors being represented by red and preadipocytes by cyan. The Louvain algorithm was utilized to determine cell clusters. (C) Individual gene t-SNE plots showing the expression and distribution of representative marker genes: Pi16 and Dpp4 for progenitors, Icam1 and Cd36 for preadipocytes. (D) Gate strategy to characterize progenitors and preadipocytes. (E) Absolute numbers of progenitors and preadipocytes from ob/ob-Veh and ob/ob-Rosi mice. (F and G) Images of confocal microscopy of sorted lineage-negative (CD45-, CD31-), PDGFRα+, DPP4+, and DPP4- cells differentiated for 4 days with DMI medium, with DAPI (nuclei, blue) and LipidTox (neutral lipids, green) staining. Data represent the mean ± SEM (n = 6 mice per group). Confocal images: four wells per condition, two representative images per well were acquired. GraphPad (GP) p value style: *p = 0.0332, **p < 0.0021, and ***p < 0.0002 by two-tailed Student’s t test.
Figure 4.
Figure 4.. Comparison of differently expressed genes and enriched pathways in response to obesity and rosiglitazone treatment in the eWAT
(A and B) UpSet plots illustrating the intersection of differentially expressed genes (DEGs) from eWAT progenitors (A) and eWAT preadipocytes (B), all at Benjamini-Hochberg adjusted p < 0.05. The four categories include upregulated DEGs in obese mice compared to lean mice (ob/ob_UP), downregulated DEGs in obese mice compared to lean mice (ob/ob_DOWN), upregulated DEGs in response to Rosi treatment compared to ob/ob-Veh (Rosi_UP), and downregulated DEGs in response to Rosi treatment compared to ob/ob-Veh (Rosi_DOWN) (see STAR Methods for details). (C and D) Dot plots illustrate the top enriched pathways in response to Rosi treatment, which acts to reverse the effects of obesity. All pathways displayed meet the cutoff for statistical significance at Benjamini-Hochberg-adjusted p < 0.05 (see STAR Methods for details). (C) Pathway enrichment from DEGs that are upregulated in eWAT obese mice and downregulated following Rosi treatment. (D) Represented pathways enriched from DEGs that are downregulated in eWAT obese mice and upregulated following Rosi treatment.
Figure 5.
Figure 5.. PPARγ-driven enhancement in the transcriptional network of ribosomal genes
(A) Dot plot showing differentially expressed ribosomal genes influenced by the ob/ob effect or Rosi effect in eWAT and iWAT progenitors or preadipocytes all at Benjamini-Hochberg-adjusted p < 0.05. The size of the dots reflects the -log10(false discovery rate [FDR]) of the DEGs and the color of the dots reflects the fold change (FC) of the DEGs. (B) Schematic describing proteomics analysis of iWAT SVF isolated from ob/ob mice that were differentiated with DMI + Veh or Rosi for 3 days. (C) Dot plot of proteomic analysis showing differentially expressed ribosomal proteins regulated by Rosi in iWAT using an adjusted p < 0.05 and |log2FC| > 0.25. (D) PPARγ ChIP-seq showing PPARγ binding sites in close proximity to ribosomal genes: Rpl11, Rpl19, Rpl23a, Rps3a1, Rps14, and Rps27a in eWAT, iWAT, and BAT. (E) PPARγ ChIP-qPCR performed in 3T3-L1 and 10T/12 cells after 5 days of adipocyte differentiation (n = 4).
Figure 6.
Figure 6.. PPARγ-driven translational selectivity in Rosi treated adipocytes
(A) Surface sensing of translation (SUnSET) scheme. (B) Immunoblots of eWAT and iWAT. Left: total protein in stain-free gel. Right: immunoblot anti-puromycin and puromycilation quantification. Student t test GraphPad (GP) p value style: *p = 0.0332. (C) Polysome profile scheme. Briefly, eWAT/iWAT SVF was differentiated for 4 days, and the cell lysate was applied to a sucrose gradient. 40S, 60S, 80S, and polysomes were separated by ultracentrifugation and fractionated. (D) Polysome profile of primary stromal vascular fraction (SVF) of eWAT after 4 days of adipocyte differentiation. (E) Experimental design for the polysome sequencing: fractions containing more than 3 ribosomes were pooled together for RNA extraction and sequencing. Control samples were input total RNA before samples were submitted to polysome fractionation. (F) Venn diagram illustrates the intersection of DEGs derived from total RNA sequencing and polysome sequencing. Both sets of DEGs satisfy the criteria of an adjusted p value of less than 0.05. The significance of overlap was assessed using Fisher’s exact test. (G) Dot plot visualizing the significant pathways that are enriched within the total RNA-sequencing DEG set, polysome-sequencing DEG set, and 85 shared DEG set considering all pathways at Benjamini-Hochberg-adjusted p < 0.05. The size of each dot corresponds to the enrichment score for each pathway, reflecting the ratio of overlapping genes to total genes within the cell-type-specific gene set, adjusted by the total number of genes detected by total RNA sequencing or polysome sequencing. Dot color represents the log2 (fold change), calculated based on the average fold change across all overlapping genes within a pathway. (H) Volcano plot of iWAT proteomics data shows differentially expressed proteins regulated by Rosi treatment at adjusted p < 0.05 and |log2FC| > 2. (I) Venn diagram illustrates the intersection of polysome DEGs in (F) and differentially expressed proteins in (H). The significance of overlap was assessed using Fisher’s exact test. (J) Immunoblot of FABP4 and VINCULIN from iWAT and eWAT SVF isolated from ob/ob mice and differentiated for 4 days in vitro with DMI plus Veh or Rosi. (K and L) Treatment of eIF4A inhibitor (CR-1-31-B) in 10T/12 clone #22 cells. Cells were differentiated with DMI + GW for 1 day and treated for 48 h with CR-1-31-B. Staining is DAPI (nuclei, blue) and LipidTox (neutral lipids, green) at low (10× bottom) and high magnifications (20× top). Confocal images: 2 wells per condition, 2 representative images per well were acquired.
Figure 7.
Figure 7.. Rosi-induced translation efficiency and identification of G-rich motifs in the 5′ UTR
(A) Schematic overview of polysome profiling and sequence feature analysis in the 5′ UTR under acute Rosi treatment. (B) Volcano plot illustrating the differentially translated transcripts between Rosi and Veh treatment. The x axis shows the log2 transformed fold change, while the y axis shows the adjusted p value. The red and blue dots label the up- and downregulated transcripts, respectively. (C) Boxplot shows the normalized read count on the Pnpla2 transcript between different treatments in total RNA and polysome fractions. (D) Sequence motif enriched in the 5′ UTR of upregulated transcripts. (E) The feature map of the 5′ UTR of selected upregulated transcripts. Each deep blue bar indicates a significant site with a p value lower than 0.05 calculated by the scan-matrix program.

References

    1. WHO, W.H.O. (2023). Health topics: Obesity.
    1. CDC (2023). Overweight & Obesity (Center for Disease Control and Prevention; ).
    1. Sakers A, De Siqueira MK, Seale P, and Villanueva CJ. (2022). Adipose-tissue plasticity in health and disease. Cell 185, 419–446. 10.1016/j.cell.2021.12.016. - DOI - PMC - PubMed
    1. Merrick D, Sakers A, Irgebay Z, Okada C, Calvert C, Morley MP, Percec I, and Seale P. (2019). Identification of a mesenchymal progenitor cell hierarchy in adipose tissue. Science 364, eaav2501. 10.1126/science.aav2501. - DOI - PMC - PubMed
    1. Henriques F, Bedard AH, Guilherme A, Kelly M, Chi J, Zhang P, Lifshitz LM, Bellvé K, Rowland LA, Yenilmez B, et al. (2020). Single-Cell RNA Profiling Reveals Adipocyte to Macrophage Signaling Sufficient to Enhance Thermogenesis. Cell Rep. 32, 107998. 10.1016/j.celrep.2020.107998. - DOI - PMC - PubMed

Publication types

Associated data