. 2025 Aug;44(8):1321-1330.
doi: 10.1016/j.healun.2024.11.017. Epub 2024 Nov 22.

Single-cell RNA-sequencing identifies unique cell-specific gene expression profiles in high-grade cardiac allograft vasculopathy

Affiliations

Single-cell RNA-sequencing identifies unique cell-specific gene expression profiles in high-grade cardiac allograft vasculopathy

Kaushik Amancherla et al. J Heart Lung Transplant. 2025 Aug.

Abstract

Background: Cardiac allograft vasculopathy (CAV) is the leading cause of late graft failure and mortality after heart transplantation (HT). Current strategies for early diagnosis and effective treatment of CAV are lacking. Using single-cell RNA-sequencing in peripheral blood mononuclear cells (PBMCs), we sought to investigate cell-specific gene expression profiles and T cell receptor repertoires in CAV that may inform novel biomarkers and pathways to interrupt CAV pathogenesis.

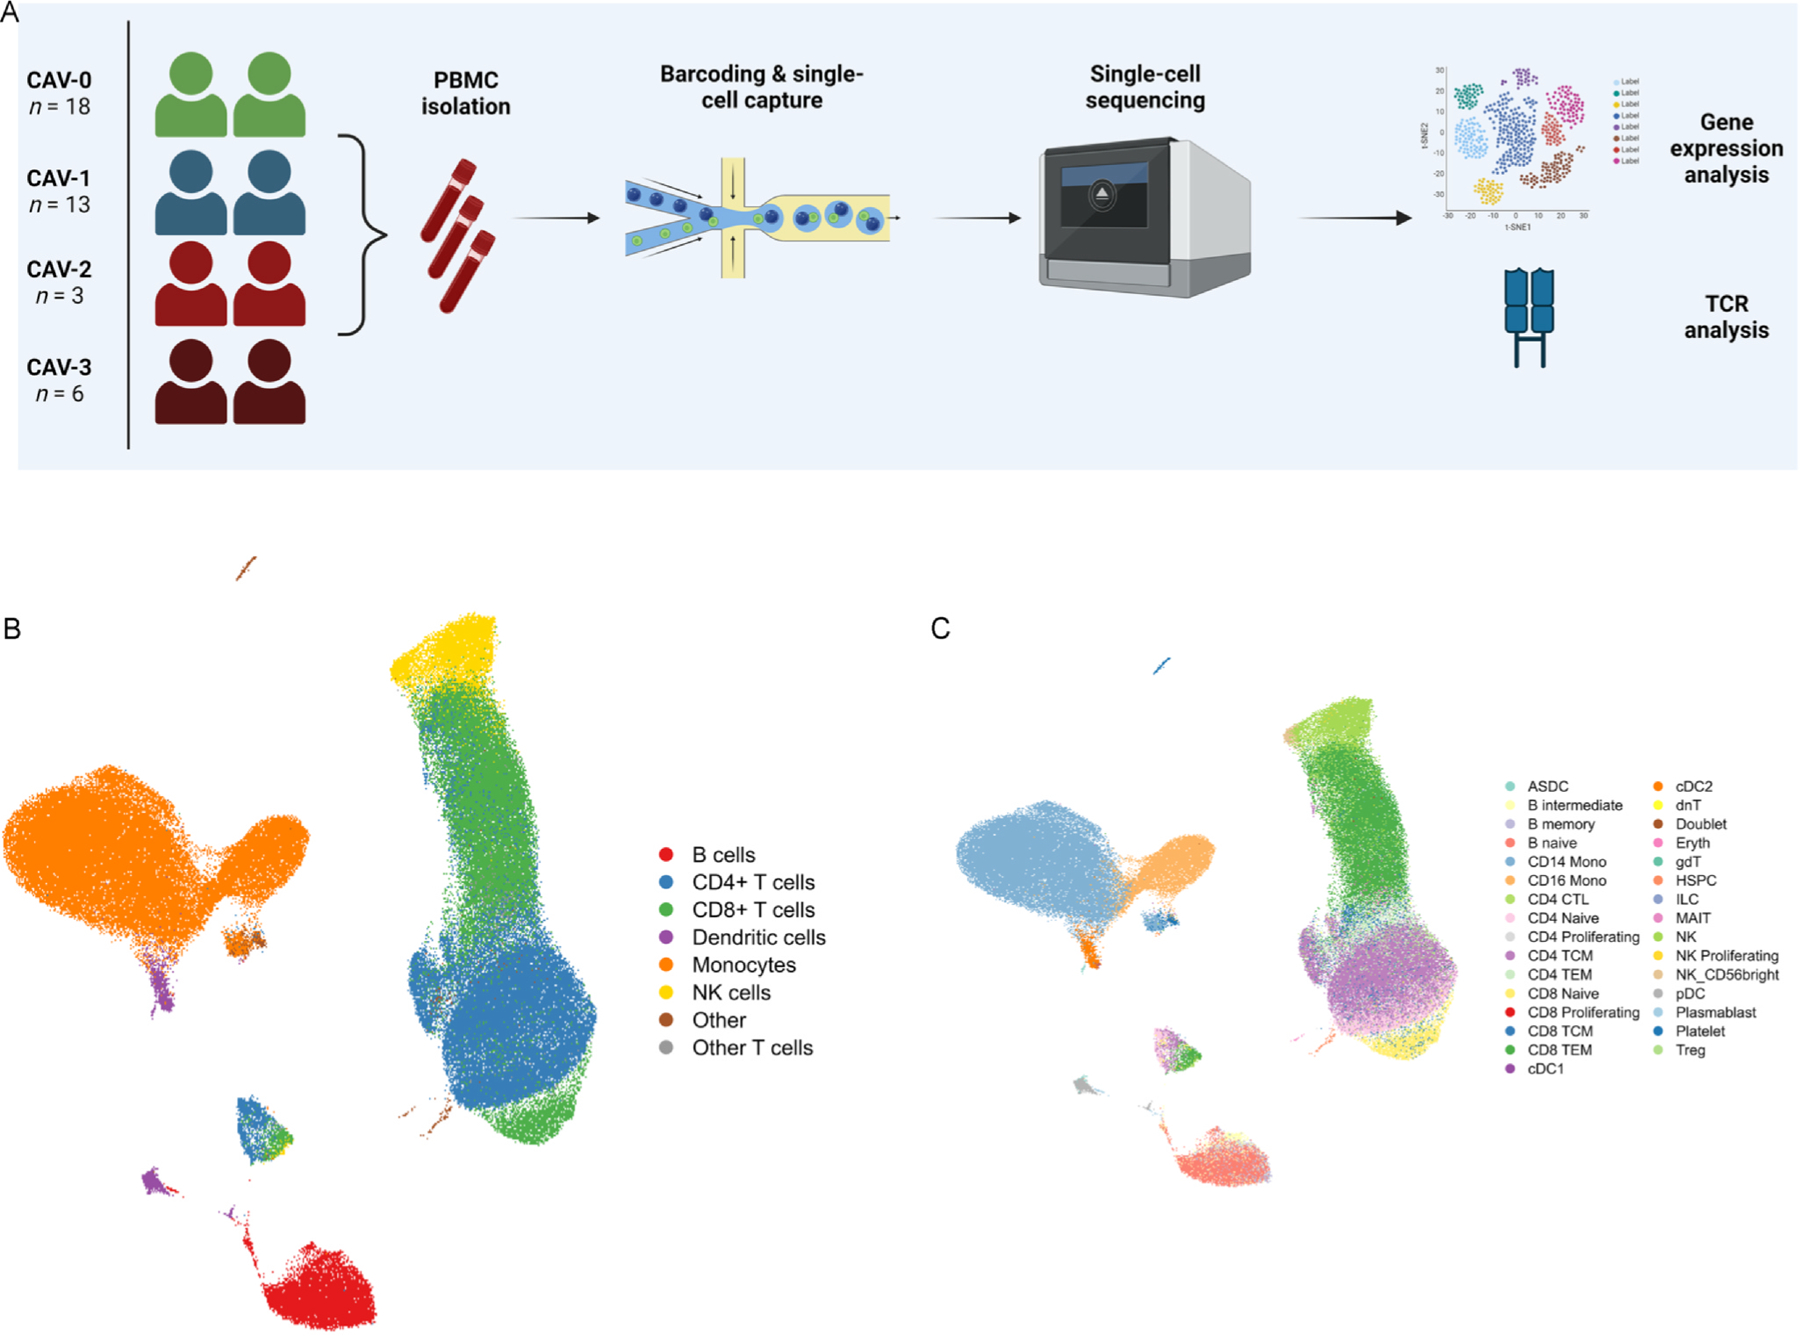
Methods: Whole blood was collected from 22 HT recipients with angiographically-confirmed CAV and 18 HT recipients without CAV. PBMCs were isolated and subjected to single-cell RNA-sequencing using a 10X Genomics microfluidic platform. Downstream analyses focused on differential expression of genes, cell compositional changes, and T cell receptor repertoire analyses.

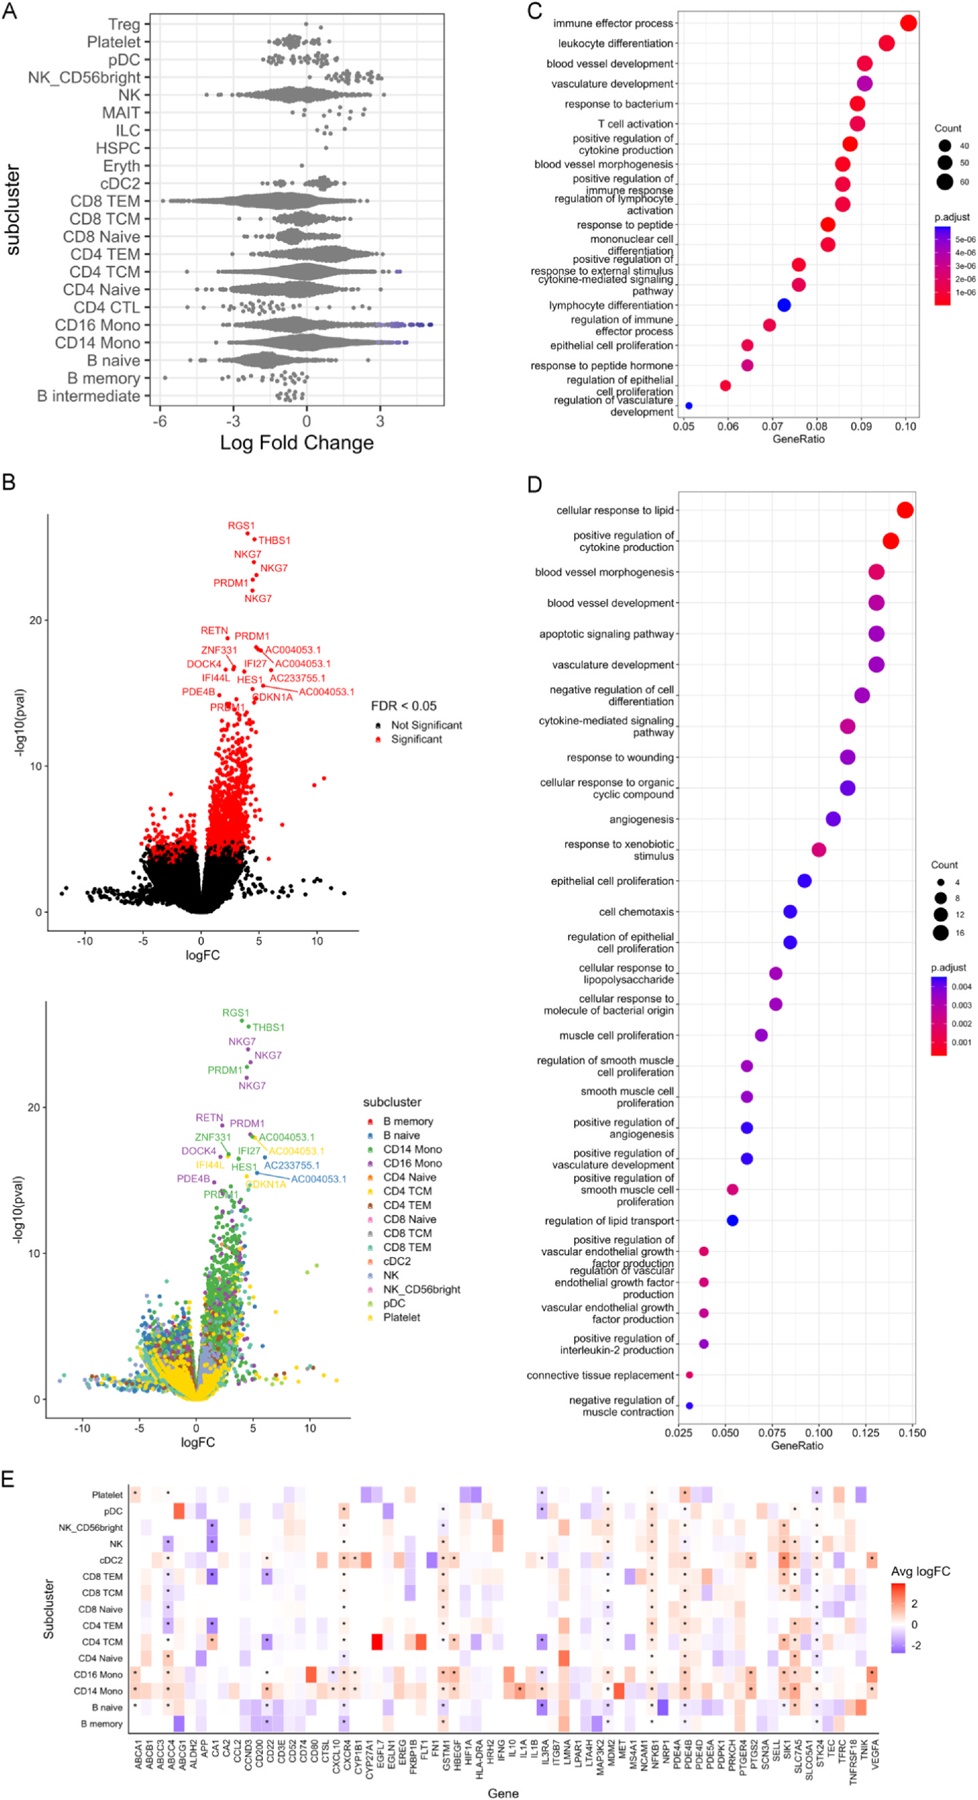
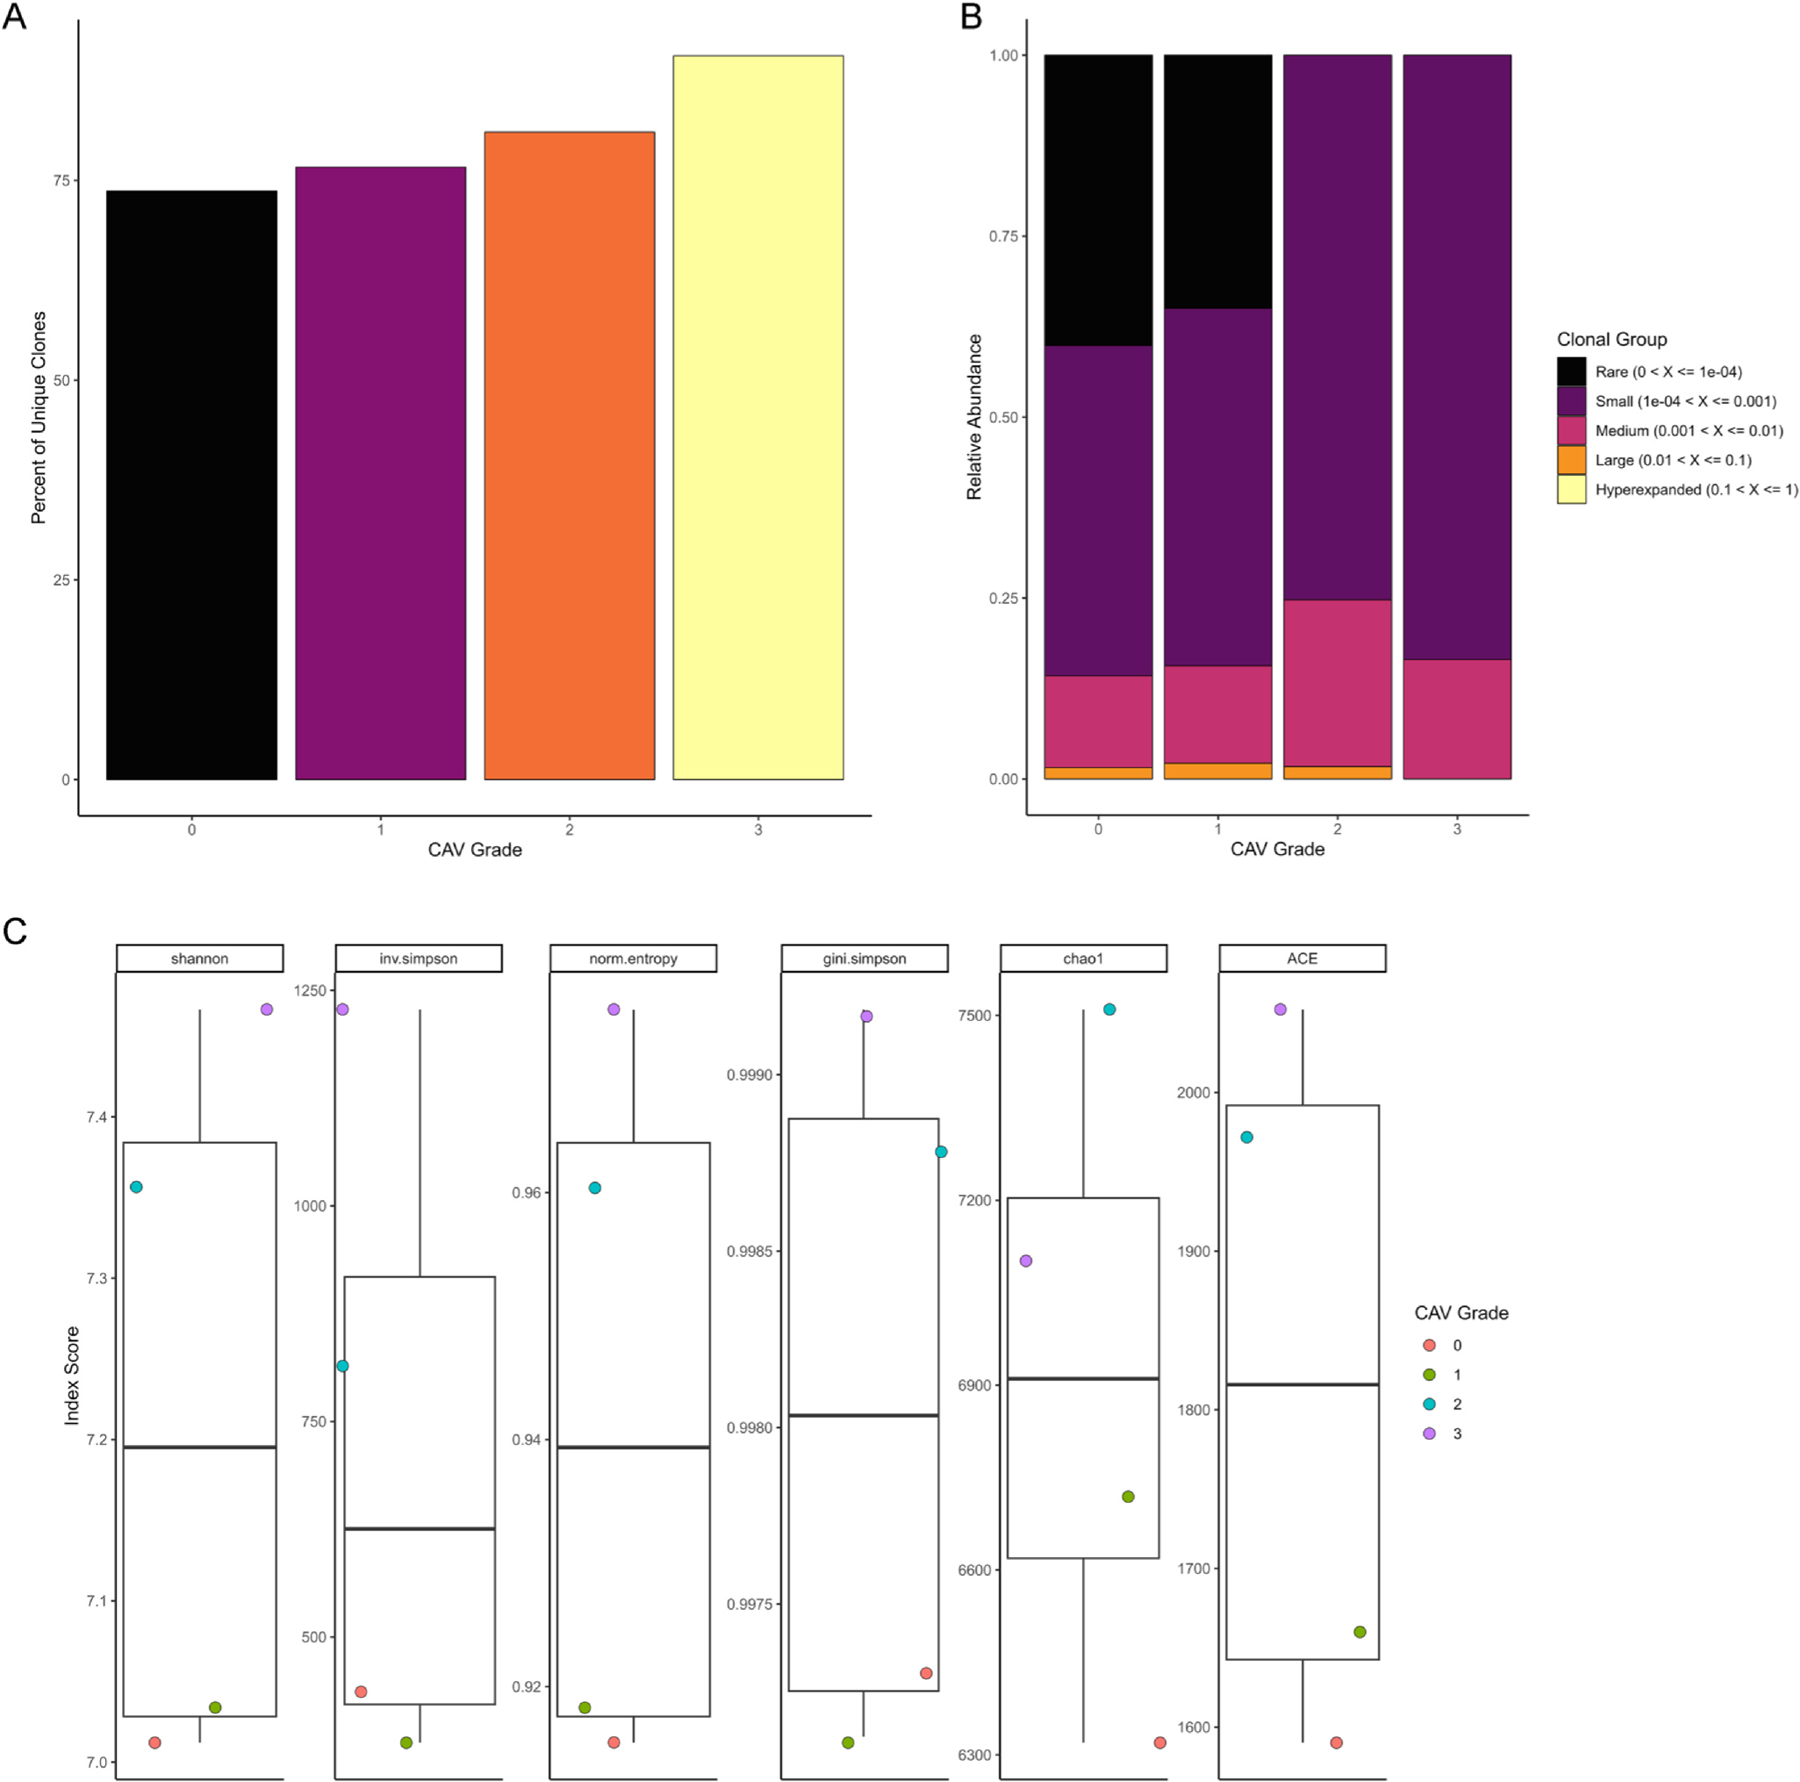
Results: Across 40 PBMC samples, we isolated 134,984 cells spanning 31 cell types. Compositional analyses showed subtle, but significant increases in CD4+ T central memory cells, and CD14+ and CD16+ monocytes in high-grade CAV (CAV-2 and CAV-3). 745 genes were differentially expressed in a cell-specific manner in high-grade CAV, enriched for putative pathways involved in inflammation and angiogenesis. Intersection with the druggable genome prioritized 68 targets, including targets with approved drugs in cardiovascular disease (e.g., canakinumab). There were no significant differences in T cell clonality or diversity with increasing CAV severity.

Conclusions: Unbiased whole transcriptomic analyses at single-cell resolution identify unique, cell-specific gene expression patterns in CAV, suggesting the potential utility of peripheral gene expression biomarkers in diagnosing CAV. Furthermore, precision targeting of these pathways may offer opportunities to mitigate CAV pathogenesis.

Keywords: Biomarkers; Cardiac allograft vasculopathy; Gene Expression; Heart transplant; Single-cell RNA-sequencing.


Conflict of interest statement

Conflict of interest statement

Dr. Rathmell is a founder and member of the scientific advisory board for Sitryx Therapeutics.

Figures

Figure 1
Figure 1
(A) Overview of the study design and samples collected. This figure was created using Biorender.com. (B) UMAP visualization of 134,984 cells passing quality control, as described. Using canonical markers and reference-mapping, 8 major clusters were defined. (C) 31 subclusters were further characterized. ASDC = AXL+ SIGLEC6+ dendritic cells; Mono = monocyte; CTL = cytotoxic T lymphocytes; TCM = T central memory cells; TEM = T effector memory cells; cDC = conventional dendritic cells; dnT = double negative T cells; gdT = γδ T cells; HSPC = hematopoietic stem and progenitor cells; ILC = circulating innate lymphoid cells; MAIT = mucosal-associated invariant T cells; NK = natural killer cells; pDC = plasmacytoid dendritic cells; Treg = T regulatory cells.
Figure 2
Figure 2
(A) Beeswarm plot of the distribution of log fold change between high-grade CAV (CAV-2 and CAV-3) and low-grade CAV (CAV-0 and CAV-1) according to neighborhoods within annotated subclusters. Neighborhoods are considered differentially abundant between conditions at an FDR < 0.1 and are colored blue if enriched in high-grade CAV and red if enriched in low-grade CAV. (B) Left: Volcano plot of differentially expressed genes between high-grade CAV and low-grade CAV. Positive logFC indicates higher expression in high-grade CAV while negative logFC indicates higher expression in low-grade CAV. Red color indicates genes that meet FDR < 0.05 after correction both within tested neighborhoods and across tested neighborhoods. Right: Volcano plot of differentially expressed genes between high-grade CAV and low-grade CAV. Positive logFC indicates higher expression in high-grade CAV while negative logFC indicates higher expression in low-grade CAV. Color of dots indicates the subcluster of the neighborhood within which each gene is differentially expressed. (C) Using all 745 differentially expressed genes in high-grade CAV, pathway enrichment analysis was performed for Biological Process terms using clusterProfiler (v4.6.2) with all tested genes as the background universe. (D) Module 7 in high-grade CAV, consists of 156 genes identified via single-cell WGCNA. These 156 genes were tested for pathway enrichment for Biological Process terms using all tested genes as the background universe. (E) Intersection of the 745 DE genes in high-grade CAV with the druggable genome prioritized 68 Tier 1 drugs (targets of approved drugs or those in clinical phase studies). This heatmap characterizes the cell-specific expression of these genes. * = genes that are DE in at least 2 neighborhoods within that subcluster.
Figure 3
Figure 3
TCRs were reconstructed using TRUST4 and analyzed using scRepertoire. Using barcode matching with scRNA-seq, as described in the Methods section, ensured that TCR analyses only included T cells that passed rigorous quality control. (A) Total number of unique TCR clones according to CAV grading did not show any significant differences between groups (Kruskal-Wallis P-value > 0.05). (B) TCR clonality across the spectrum of CAV grading showed no significant differences across groups (Kruskal-Wallis P-value > 0.05). (C) TCR diversity was measured by the following indices: Shannon, inverse Simpson, normalized entropy, Gini-Simpson, Chao1, and ACE. No significant differences in TCR diversity were observed amongst the groups (Kruskal-Wallis P-value > 0.05 for all indices).

Update of

References

    1. Khush KK, Cherikh WS, Chambers DC, et al. The International Thoracic Organ Transplant Registry of the International Society for Heart and Lung Transplantation: thirty-sixth adult heart transplantation report - 2019; focus theme: donor and recipient size match. J Heart Lung Transpl 2019;38:1056–66. 10.1016/j.healun.2019.08.004. - DOI - PMC - PubMed
    1. Mehra MR, Crespo-Leiro MG, Dipchand A, et al. International Society for Heart and Lung Transplantation working formulation of a standardized nomenclature for cardiac allograft vasculopathy-2010. J Heart Lung Transpl 2010;29:717–27. 10.1016/j.healun.2010.05.017. - DOI - PubMed
    1. Al-Hijji MA, Lennon RJ, Gulati R, et al. Safety and risk of major complications with diagnostic cardiac catheterization. Circ Cardiovasc Inter 2019;12:e007791. 10.1161/CIRCINTERVENTIONS.119.007791. - DOI - PubMed
    1. Pham MX, Teuteberg JJ, Kfoury AG, et al. Gene-expression profiling for rejection surveillance after cardiac transplantation. N Engl J Med 2010;362:1890–900. 10.1056/NEJMoa0912965. - DOI - PubMed
    1. Singh N, Heggermont W, Fieuws S, Vanhaecke J, Van Cleemput J, De Geest B. Endothelium-enriched microRNAs as diagnostic biomarkers for cardiac allograft vasculopathy. J Heart Lung Transpl 2015;34:1376–84. 10.1016/j.healun.2015.06.008. - DOI - PubMed

LinkOut - more resources