. 2025 Apr 7;74(5):714-727.
doi: 10.1136/gutjnl-2024-332901.

Spatial dissection of tumour microenvironments in gastric cancers reveals the immunosuppressive crosstalk between CCL2+ fibroblasts and STAT3-activated macrophages

Affiliations

Spatial dissection of tumour microenvironments in gastric cancers reveals the immunosuppressive crosstalk between CCL2+ fibroblasts and STAT3-activated macrophages

Sung Hak Lee et al. Gut. .

Abstract

Background: A spatially resolved, niche-level analysis of tumour microenvironments (TME) can provide insights into cellular interactions and their functional impacts in gastric cancers (GC).

Objective: Our goal was to translate the spatial organisation of GC ecosystems into a functional landscape of cellular interactions involving malignant, stromal and immune cells.

Design: We performed spatial transcriptomics on nine primary GC samples using the Visium platform to delineate the transcriptional landscape and dynamics of malignant, stromal and immune cells within the GC tissue architecture, highlighting cellular crosstalks and their functional consequences in the TME.

Results: GC spatial transcriptomes with substantial cellular heterogeneity were delineated into six regional compartments. Specifically, the fibroblast-enriched TME upregulates epithelial-to-mesenchymal transformation and immunosuppressive response in malignant and TME cells, respectively. Cell type-specific transcriptional dynamics revealed that malignant and endothelial cells promote the cellular proliferations of TME cells, whereas the fibroblasts and immune cells are associated with procancer and anticancer immunity, respectively. Ligand-receptor analysis revealed that CCL2-expressing fibroblasts promote the tumour progression via JAK-STAT3 signalling and inflammatory response in tumour-infiltrated macrophages. CCL2+ fibroblasts and STAT3-activated macrophages are co-localised and their co-abundance was associated with unfavourable prognosis. We experimentally validated that CCL2+ fibroblasts recruit myeloid cells and stimulate STAT3 activation in recruited macrophages. The development of immunosuppressive TME by CCL2+ fibroblasts were also validated in syngeneic mouse models.

Conclusion: GC spatial transcriptomes revealed functional cellular crosstalk involving multiple cell types among which the interaction between CCL2+ fibroblasts and STAT3-activated macrophages plays roles in establishing immune-suppressive GC TME with potential clinical relevance.

Keywords: gastric cancer.


Conflict of interest statement

Competing interests: None declared.

Figures

Figure 1
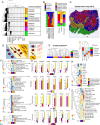
Figure 1. Classification of three gastric cancer (GC) subtypes. (A) A heatmap (left) and bar plots (middle) illustrate the cellular abundances of 12 cell types in nine GC cases (GC1–GC9). Hierarchical clustering categorised the nine GCs into three GC subtypes: epithelial, immunogenic and fibrotic, which are characterised by the dominance of malignant cells, immune cells and fibroblasts, respectively. Additional bar plots show the number of spots present in each case (right). (B) For the cases chosen to represent each subtype—immunogenic (GC1), epithelial (GC3) and fibrotic (GC4) GCs—histological annotations of spots determined by pathologists (left) are shown alongside the dominant cell types of individual spots determined by deconvolution (ie, cell types with the highest enrichment; middle). A correlative heatmap also demonstrates the relationships between cell types based on spot-level correlations of cellular abundances (right). DC, dendritic cell; EBV, Epstein-Barr virus; MSI-H, microsatellite instability-high; MSS, microsatellite stable; NK, natural killer; PC, plasma cell; Treg, regulatory T cell.
Figure 2
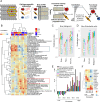
Figure 2. Spatial niche in gastric cancer (GC) tumour microenvironments (TME) and their associated transcriptional dynamics. (A) The cellular compositions of all GC spots obtained across nine cases (n=29 808) were subjected to hierarchical clustering, which segregated them into six niche categories. The six niches are annotated with respect to the level of TME infiltration and predominant cell types. (B) The distribution and proportion of cellular subtypes within each niche and their prevalence in the three GC subtypes. (C) The spatial representation of niches in GC1. (D) A schematic shows that malignant cells and fibroblasts are either isolated (left and right) or intermingled (middle) in three different niches (left, middle and right). Cell type-specific expression profiles can be inferred and compared with respect to niches, for example, malignant cell expressions inferred from the left and middle niches provide information about the transcriptional dynamics of malignant cells with fibroblast infiltration. (E) A high degree of lineage concordance was observed for the cell type-specific expression inferred across niches. The expression of four cell type-specific markers was also concordant for deconvoluted cell type-specific expression as shown in a heatmap. (F) Functional enrichment analyses for four cell types (malignant cells, fibroblasts, endothelial and immune cells) are shown in individual heatmaps as evaluated across different niches (Hallmark gene set, false discovery rate (FDR) <0.1). (G) Selected functions are indicated by arrows (eg, epithelial-to-mesenchymal transition (EMT) in malignant cells), and their relevant genes are shown to indicate their expression changes across niches. The niche colour schemes match those in panel (A). (H) and (I) show the expression of selected immune-related genes in immune cells and the CIBERSORT-estimated abundance of 22 immune cell types across niches, respectively. DC, dendritic cell; IFN, interferon; IL, interleukin; NFκB, nuclear factor-kappa B; NK, natural killer; PC, plasma cell; TNF, tumour necrosis factor; Treg, regulatory T cell.
Figure 3
Figure 3. Landscape of cellular crosstalk and its functional consequences in gastric cancer (GC) tumour microenvironments (TME). (A) The schematic illustrates the process of inferring cell type-specific expression at the individual spot level for the functional crosstalk analysis. Each spot, along with its neighbouring 18 spots (six nearest N1 and 12 next-nearest N2 spots, in orange and yellow, respectively), is analysed to deconvolute the cell type-specific expression of the five major cell types. The inferred cell type-specific expression was then subjected to a gene set enrichment analysis (GSEA) to develop the cell type-specific functional score profiles. Correlations between the functional scores of target cells and the abundance of regulator cells across spots indicate functional relationships between target and receptor cells. (B) Functional interactions among the four cell types of interest (malignant cells, endothelial cells, immune cells and fibroblasts) were analysed pairwise, resulting in 16 different functional consequences that are depicted in the heatmap as a landscape of cellular crosstalk in GC TMEs. This heatmap shows the correlation levels for various functional terms, with each column corresponding to a specific regulator and target cell pairing, as indicated in the top panels. For instance, the first column shows how endothelial cells as regulators might affect malignant cells as targets, possibly leading to increased MYC target expression in the latter. Three boxes highlight functional sets associated with the infiltration of malignant and endothelial cells (black), immune cells (green) and fibroblasts (red). (C) Spots were categorised into five bins based on the level of malignant cell infiltration, and the proliferation index was calculated using genes related to cellular proliferation across bins. An overall increase in the proliferation indexes of cells in the GC TME was observed to correlate with increasing levels of malignant cell infiltration. (D) The proliferation index was similarly calculated across bins representing the level of endothelial cell infiltration. (E) Across bins representing the level of fibroblast infiltration, the activity levels of eight immune-related functions are shown. (F) Similarly, the expression levels of immune-related genes are shown across the fibroblast bins. IL, interleukin; TNF, tumour necrosis factor.
Figure 4
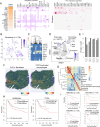
Figure 4. CCL2+ fibroblasts and STAT3-activated macrophages with spatial co-localisation and clinical outcomes. (A) A NicheNet analysis reveals the top ligands associated with cellular interactions between fibroblasts and immune cells as regulators and target cells, respectively. This analysis highlights CCL2 as having the top ligand activity in fibroblasts. The interacting target genes and receptor genes are also demonstrated. (B) A t-Distributed Stochastic Neighbour Embedding (tSNE) plot shows the distribution of CCL2 expression across 716 fibroblasts in the single-cell RNA sequencing (scRNA-seq) data. (C) A correlative heatmap shows the level of expression for ligands, including CCL2 (selected in figure 4A), and inflammatory cancer-associated fibroblast (iCAF) and myofibroblastic cancer-associated fibroblast (myCAF) scores with their cognate markers of IL6 and ACTA2, respectively. (D) All gastric cancer (GC) tumour microenvironment (TME) cells (n=23 477) in the scRNA-seq data are shown in a tSNE plot, which indicates that JAK-STAT3 signature scores are largely limited to myeloid cells. The inset shows that myeloid cells with JAK-STAT3 signature scores are further limited to macrophages. We define STAT3-activated macrophages as those with high JAK-STAT3 scores. (E) The number of significant ligand-receptor pairs in CellphoneDB analysis are shown in y-axis. CCL2+ represents those identified in CCL2+ fibroblasts and STAT3-activated macrophages. (F) In a GC1 spatial map, the spot-level scores representing the abundance of CCL2+ fibroblasts and STAT3-activated macrophages show a concordant pattern suggesting that the two cell types are co-localised. (G) A heatmap shows the correlation level across all spots for the cellular abundance of 12 cell types and the scores for CCL2+ fibroblasts and STAT3-activated macrophages. (H) In two public GC bulk-level transcriptome datasets (Asian Cancer Research Group (ACRG) and The Cancer Genome Atlas (TCGA)), patients whose samples were CCL2+ fibroblast high (CF-high) and STAT3-activated macrophage-high (SM-high) (shown in red) had substantially worse clinical outcomes than those whose samples were CCL2+ fibroblast low (CF-low) and STAT3-activated macrophage-low (SM-low) (shown in black). (I) Four additional GC cohorts showed similar results. DC, dendritic cell; NK, natural killer; PC, plasma cell; Treg, regulatory T cell.
Figure 5
Figure 5. CCL2+ cancer-associated fibroblasts (CAFs) recruit myeloid cells and activate the phosphorylation of STAT3 in macrophages. (A) A transwell migration assay showed that CAF-conditioned medium (CM) increased the migration ability of human monocyte cell line (THP-1) cells. Paired t-test. *P<0.05. (B–C) A transwell migration assay showed that 200 ng/mL anti-CCL2 neutralising antibody (B) and CCL2 knockdown CAF-CM (C) decreased the migration ability of THP-1 cells. Paired t-test. *P<0.05. (D) A gene set enrichment analysis showed that JAK-STAT3 signalling genes are upregulated in CAF-stimulated macrophages, compared with non-stimulated macrophages. (E) Various CAF cells activated STAT3 phosphorylation in phorbol 12-myristate 13-acetate (PMA)-induced macrophages (top). Treatment with recombinant CCL2 (100 ng/mL) activated STAT3 phosphorylation in PMA-induced macrophages in a time-dependent manner (bottom). (F) THP-1 cells were differentiated into macrophages for 48 hours and then co-cultured with CAFs. Jurkat cells were activated with PMA/ionomycin (P/I) treatment for 3 hours and then co-cultured with macrophages for 6 hours. (G) P/I-induced activation of Jurkat cells increased IFNG expression. However, co-culture with CAF-stimulated macrophages reduced IFNG expression in activated Jurkat cells. Kruskal-Wallis test, uncorrected Dunn’s post hoc test. *P<0.05, **p<0.01. FDR, false discovery rate; FWER, family wise error rate.
Figure 6
Figure 6. CCL2+ fibroblasts induce an immunosuppressive tumour microenvironments (TME) in vivo. (A) YTN3 cells with and without mouse gastric fibroblasts (MGFs) were subcutaneously injected into C57BL/6J mice. The established tumours were harvested on days 7, 14 and 26. (B) Weights of the harvested tumours. Mann-Whitney U test and t-test. **P<0.001. (C) Immunohistochemistry (IHC) for GFP (injected MGF) and α-smooth muscle actin (α-SMA) (total fibroblasts) in day 7 and day 14 tumours. Scale bar=50 μm. (D) IHC for F4/80 (macrophages), CD8α (CD8+ T cells) and granzyme B in mouse tumours. Positive cells per region of interest (ROI) were counted using QuPath (t-test, *p<0.05). Scale bar=50 μm. (E) Left panel: representative H&E (×200) and IHC (×400) images of the three gastric cancer (GC) subtypes. The epithelial group (n=226) showed a high density of GC cells in the H&E stain and high pan cytokeratin IHC expression. The immunogenic group (n=126), with enrichment of immune cells, was positive for CD45RB proteins. The fibrotic group (n=320) showed predominant fibrosis supported by high actin expression. Right panel: survival curves for each of the three GC subtypes in a patient cohort (Kaplan-Meier survival analysis with log-rank test, p=0.0023).
Figure 7
Figure 7. Cellular crosstalk mediated by cancer-associated fibroblasts (CAFs) leads to immunosuppressive tumour microenvironment (TME). The schematic depicts a gastric cancer (GC) TME in which CAFs facilitate the epithelial-to-mesenchymal transition (EMT) of malignant cells and recruit macrophages. The macrophages undergo in situ activation of STAT3, subsequently suppressing T cell activation and contributing to immune suppression in the GC TME.

References

    1. Yeoh KG, Tan P. Mapping the genomic diaspora of gastric cancer. Nat Rev Cancer. 2022;22:71–84. doi: 10.1038/s41568-021-00412-7. - DOI - PubMed
    1. Nakamura Y, Kawazoe A, Lordick F, et al. Biomarker-targeted therapies for advanced-stage gastric and gastro-oesophageal junction cancers: an emerging paradigm. Nat Rev Clin Oncol. 2021;18:473–87. doi: 10.1038/s41571-021-00492-2. - DOI - PubMed
    1. Bang Y-J, Van Cutsem E, Feyereislova A, et al. Trastuzumab in combination with chemotherapy versus chemotherapy alone for treatment of HER2-positive advanced gastric or gastro-oesophageal junction cancer (ToGA): a phase 3, open-label, randomised controlled trial. Lancet. 2010;376:687–97. doi: 10.1016/S0140-6736(10)61121-X. - DOI - PubMed
    1. Kim T-H, Kim I-H, Kang SJ, et al. Korean Practice Guidelines for Gastric Cancer 2022: An Evidence-based, Multidisciplinary Approach. J Gastric Cancer. 2023;23:3–106. doi: 10.5230/jgc.2023.23.e11. - DOI - PMC - PubMed
    1. Zhang P, Yang M, Zhang Y, et al. Dissecting the Single-Cell Transcriptome Network Underlying Gastric Premalignant Lesions and Early Gastric Cancer. Cell Rep. 2019;27:1934–47. doi: 10.1016/j.celrep.2019.04.052. - DOI - PubMed