. 2024 Nov 23;23(1):357.
doi: 10.1186/s12936-024-05155-y.

Screening the Global Health Priority Box against Plasmodium berghei liver stage parasites using an inexpensive luciferase detection protocol

Affiliations

Screening the Global Health Priority Box against Plasmodium berghei liver stage parasites using an inexpensive luciferase detection protocol

Gia-Bao Nguyen et al. Malar J. .

Abstract

Background: Malaria, a disease caused by parasites of the genus Plasmodium, continues to impact many regions globally. The rise in resistance to artemisinin-based anti-malarial drugs highlights the need for new treatments. Ideally, new anti-malarials will kill the asymptomatic liver stages as well as the symptomatic blood stages. While blood stage screening assays are routine and efficient, liver stage screening assays are more complex and costly. To decrease the cost of liver stage screening, a previously reported luciferase detection protocol requiring only common laboratory reagents was adapted for testing against luciferase-expressing Plasmodium berghei liver stage parasites.

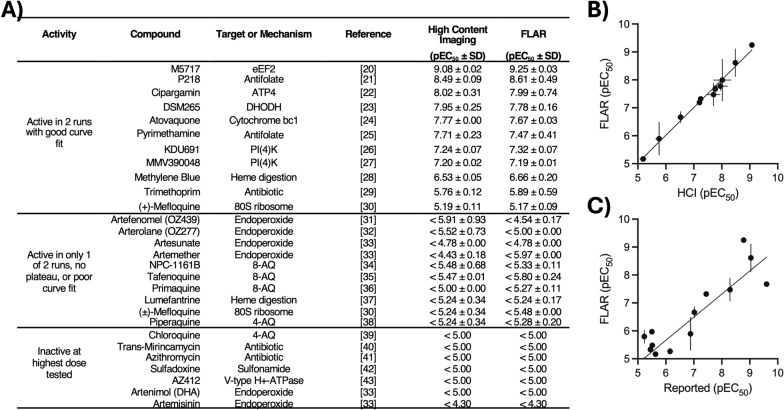
Methods: After optimizing cell lysis conditions, the concentration of reagents, and the density of host hepatocytes (HepG2), the protocol was validated with 28 legacy anti-malarials to show this simple protocol produces a stable signal useful for obtaining quality small molecule potency data similar to that obtained from a high content imaging endpoint. The protocol was then used to screen the Global Health Priority Box (GHPB) and confirm the potency of hits in dose-response assays. Selectivity was determined using a galactose-based, 72 h HepG2 assay to avoid missing mitochondrial-toxic compounds due to the Crabtree effect. Receiver-operator characteristic plots were used to retroactively characterize the screens' predictive value.

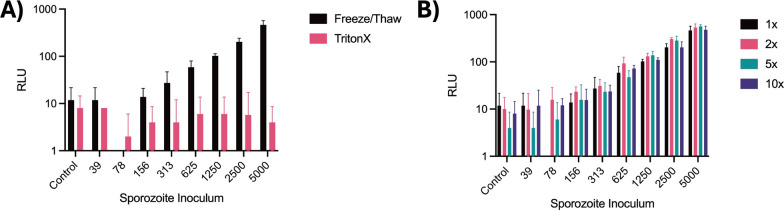
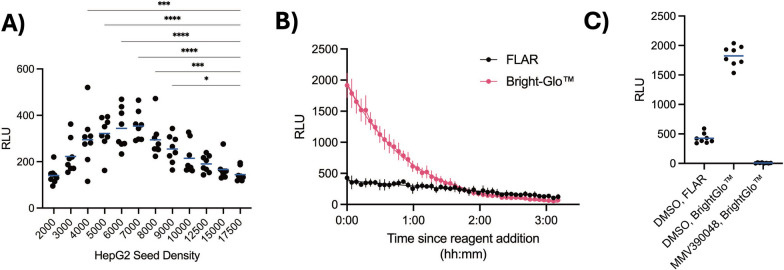
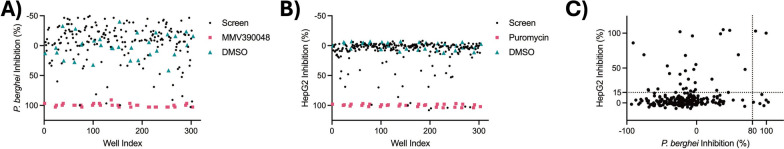
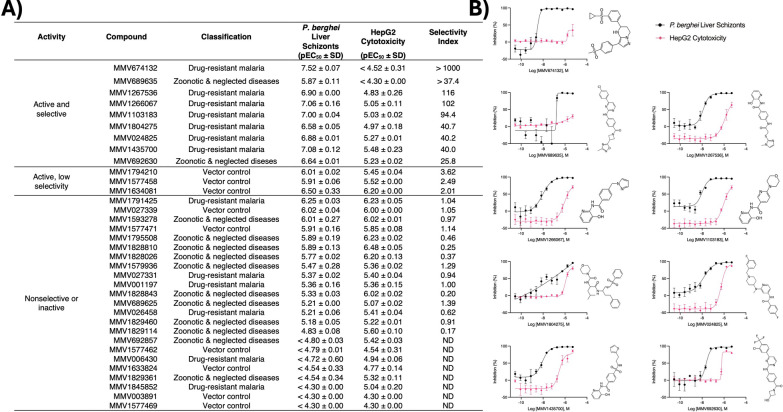
Results: Optimal luciferase signal was achieved using a lower HepG2 seed density (5 × 10³ cells/well of a 384-well microtitre plate) compared to many previously reported luciferase-based screens. While producing lower signal compared to a commercial alternative, this luciferase detection method was found much more stable, with a > 3 h half-life, and robust enough for producing dose-response plots with as few as 500 sporozoites/well. A screen of the GHPB resulted in 9 hits with selective activity against P. berghei liver schizonts, including MMV674132 which exhibited 30.2 nM potency. Retrospective analyses show excellent predictive value for both anti-malarial activity and cytotoxicity.

Conclusions: This method is suitable for high-throughput screening at a cost nearly 20-fold less than using commercial luciferase detection kits, thereby enabling larger liver stage anti-malarial screens and hit optimization make-test cycles. Further optimization of the hits detected using this protocol is ongoing.


Conflict of interest statement

Declarations. Ethics approval and consent to participate: Animal use protocols were reviewed and approved by the UGA IACUC (A2023 03–018). Consent for publication: Not applicable. Competing interests: The authors have no competing interests to declare.

Figures

Fig. 1
Fig. 1
Optimization of conditions for a luciferase endpoint with in-house reagents (FLAR). A Impact of lysis method on relative luminescence unit (RLU) signal at 30 min post addition of 1 × FLAR. B Impact of sporozoite inoculum and different concentrations of ATP and d-luciferin in FLAR buffer on RLU signal at 30 min post FLAR addition. A, B Bars represent S.D. of four replicate wells per condition. Data shown are from one independent experiment representative of two independent experiments
Fig. 2
Fig. 2
Comparison of high content imaging (HCI) and FLAR endpoints for generating potency data. A Table of pEC50 values for legacy and developmental anti-malarials tested. pEC50 is the negative log of potency in M (ie a pEC50 of 6 = an EC50 of 1 µM and a pEC50 of 9 = an EC50 of 1 nM). Values are the average and S.D. from two independent experiments (runs). Anti-malarial potencies are grouped by those active in both runs, those active in only one run or producing poor curve fits, and those inactive at the highest dose tested in both runs. eEF2, elongation Factor 2 inhibitor; DHODH, dihydroorotate dehydrogenase inhibitor, PI(4)K, phosphatidylinositol-4-OH kinase inhibitor; 8-AQ, 8-aminoquinoline, 4-AQ, 4-aminoquinoline; DHA, dihydroartemisinin. The “Target or Mechanism” column provides a reference for the possible or demonstrated mode of action and is not meant to be exhaustive or conclusive. B Plot of potency values obtained from the HCI versus FLAR endpoints. Line represents a simple linear regression (Y = 0.9919*X + 0.06728, R2 = 0.9863). C Plot of potency values obtained from FLAR endpoint and those reported using a luciferase protocol in a 1536-well plate format [17]. Line represents a simple linear regression (Y = 0.8275*X + 0.6979, R2 = 0.7546). B, C Points and bars represent the average and S.D. of the pEC50’s calculated from two independent experiments for the HCI and FLAR endpoints
Fig. 3
Fig. 3
Optimization of HepG2 seeding conditions for robust P. berghei luciferase signal. A Impact of seed density on RLU signal. Individual datapoints represent 8 replicate wells read immediately after FLAR addition. Blue lines represent mean. Significance determined by one-way ANOVA, F(11,84) = 10.01, p < 0.0001, with Dunnett’s multiple comparisons to the 17,500 condition, *p < 0.05, ***p < 0.0005, ****p < 0.0001, and nonsignificant comparisons have no indication. B Kinetic read of P. berghei luciferase signal in wells seeded with 5 × 103 HepG2 cells/well and detected with either 1 × FLAR or Bright-Glo™. Bars represent S.D. of 8 replicate wells. Curves were fitted using one phase exponential decay (R2 = 0.9390 for FLAR and 0.9975 for BrightGlo™), half-life was > 3 h for FLAR and 38 min for BrightGlo™. C P. berghei luciferase signal comparison of the first timepoint of (B) using 1 × FLAR or Bright-Glo™. Wells were treated with 0.1% v/v DMSO or 1 µM MMV390048 as indicated. Blue lines represent mean. AC Data shown are from one independent experiment representative of two independent experiments
Fig. 4
Fig. 4
GHPB single point screen. Compounds were tested at 1 µM against (A) the P. berghei liver schizonts and (B) HepG2 cells culture in galactose media. C For confirmation, 35 compounds, including 6 hits with > 80% inhibition of P. berghei liver schizonts and < 15% inhibition of HepG2 cells (lower right quadrant), were resupplied for dose–response assays
Fig. 5
Fig. 5
Results table, potencies, and structures of selective GHPB hits. A Table of pEC50 values for GHPB compounds. pEC50 is the negative log of potency in M (ie a pEC50 of 6 = an EC50 of 1 µM and a pEC50 of 9 = an EC50 of 1 nM). Values are the average and S.D. from two independent experiments (runs). Anti-malarial potencies are grouped as selectively active, active but with low selectivity, and nonselective or inactive. B Dose–response charts and structures for active and selective hits. Bars represent S.E.M. of two replicate wells at each dose from each of two independent experiments charted together
Fig. 6
Fig. 6
Receiver-operator characteristic (ROC) curves of GHPB compounds tested in P. berghei and cytotoxicity assays. ROC curves indicate the sensitivity and specificity of an assay based on a range of inhibition values from the primary screen (grey circles). The red line indicates a random assay. A ROC curve for P. berghei using FLAR, AUC = 1.0 (95% CI 1.0–1.0). B) ROC curve for HepG2 cytotoxicity using galactose media, AUC = 0.8932 (95% CI 0.7465–1.000). AUCs were calculated using the Wilson/Brown method

References

    1. WHO. World Malaria Report. Geneva, World Health Organization, 2023. https://www.who.int/teams/global-malaria-programme/reports/world-malaria....
    1. Phillips MA, Burrows JN, Manyando C, van Huijsduijnen RH, van Voorhis WC, Wells TNC. Malaria Nat Rev Dis Primers. 2017;3:17050. - PubMed
    1. Sinnis P, Coppi A. A long and winding road: the Plasmodium sporozoite’s journey in the mammalian host. Parasitol Int. 2007;56:171–8. - PMC - PubMed
    1. Adams JH, Mueller I. The Biology of Plasmodium vivax. Cold Spring Harb Perspect Med. 2017;7: a025585. - PMC - PubMed
    1. Belete TM. Recent progress in the development of new antimalarial drugs with novel targets. Drug Des Devel Ther. 2020;14:3875–89. - PMC - PubMed

LinkOut - more resources