. 2024 Nov 23;23(1):263.
doi: 10.1186/s12943-024-02177-7.

Single-cell RNA sequencing reveals immune microenvironment niche transitions during the invasive and metastatic processes of ground-glass nodules and part-solid nodules in lung adenocarcinoma

Affiliations

Single-cell RNA sequencing reveals immune microenvironment niche transitions during the invasive and metastatic processes of ground-glass nodules and part-solid nodules in lung adenocarcinoma

Yi-Feng Ren et al. Mol Cancer. .

Abstract

Background: Radiographically, ground-glass nodules (GGN) and part-solid nodules (PSN) in lung adenocarcinoma (LUAD) have significant heterogeneity in their clinical manifestations, biological characteristics, and prognosis. This study aimed to explore the heterogeneity of LUAD in different radiological phenotypes and associated factors influencing tumor evolution.

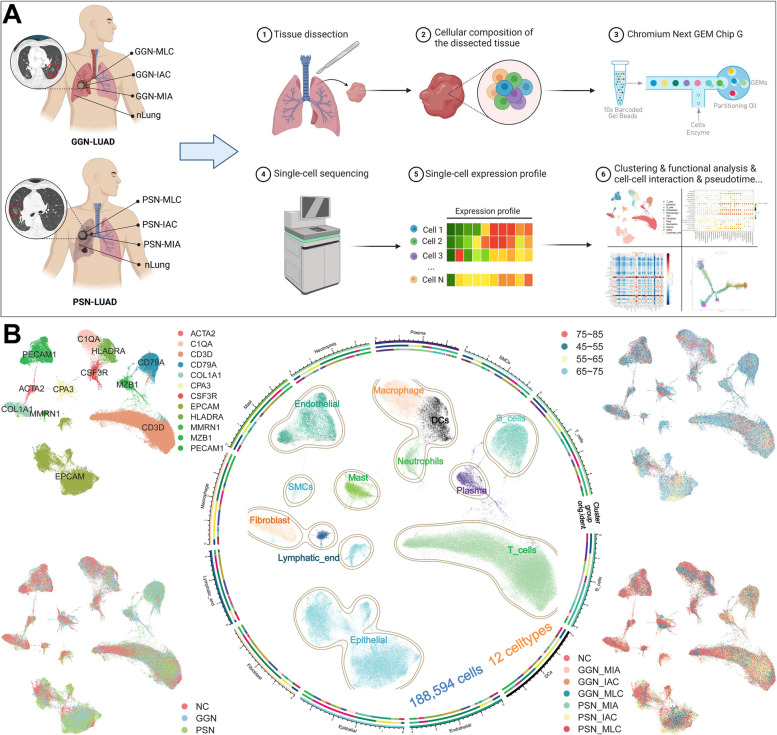
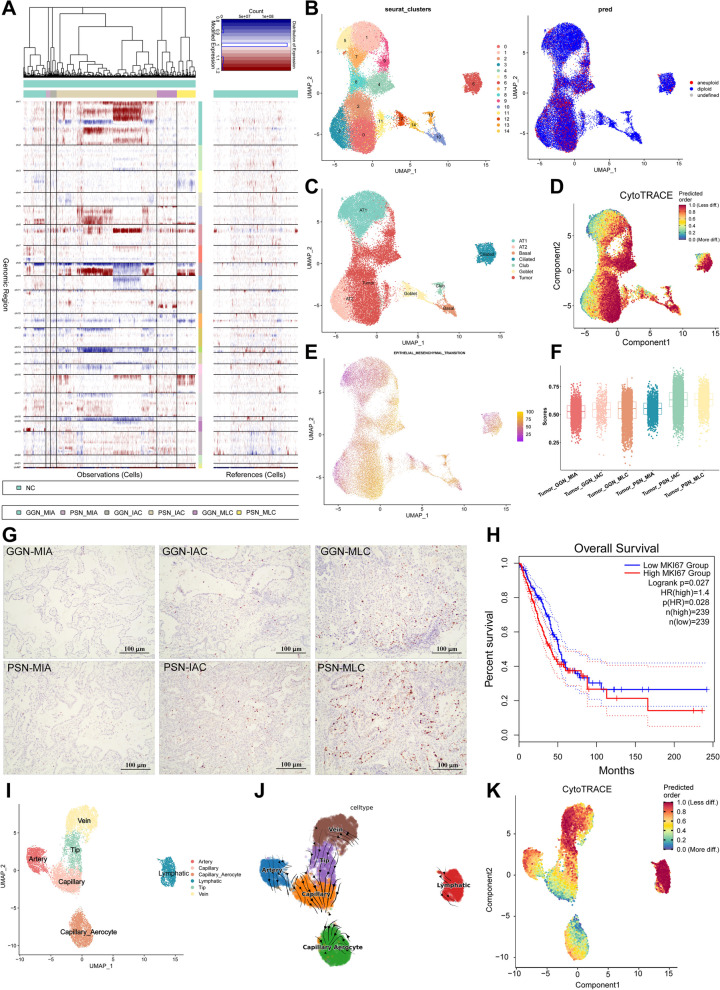
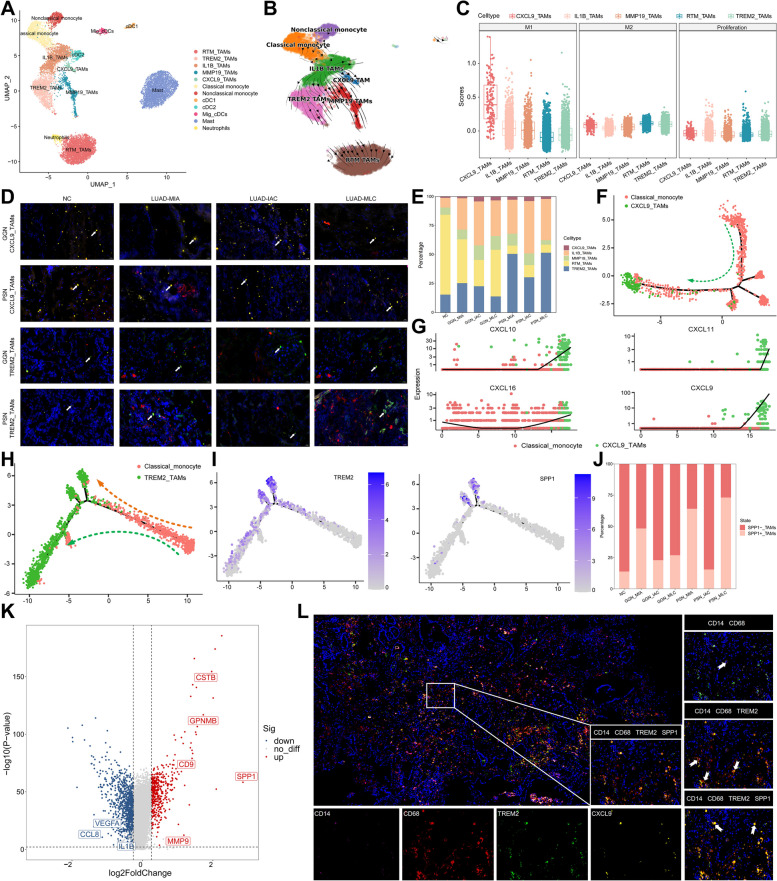
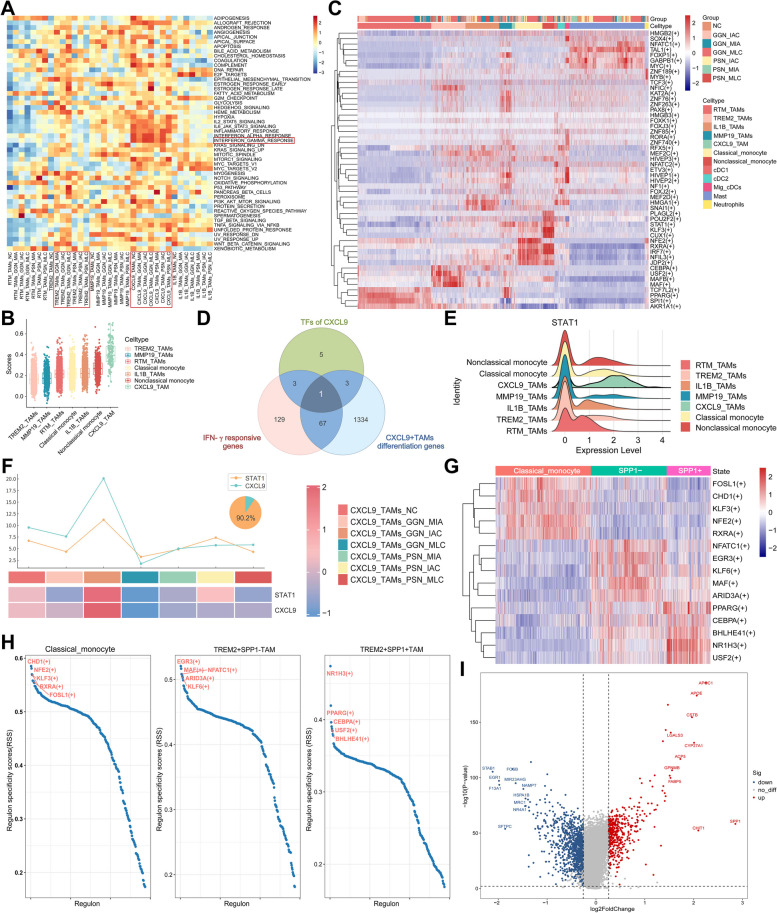
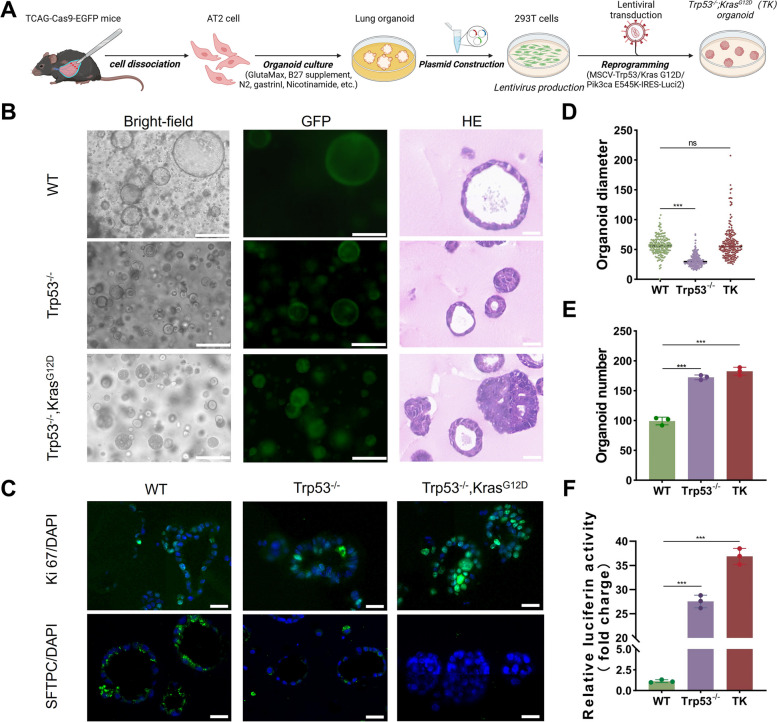
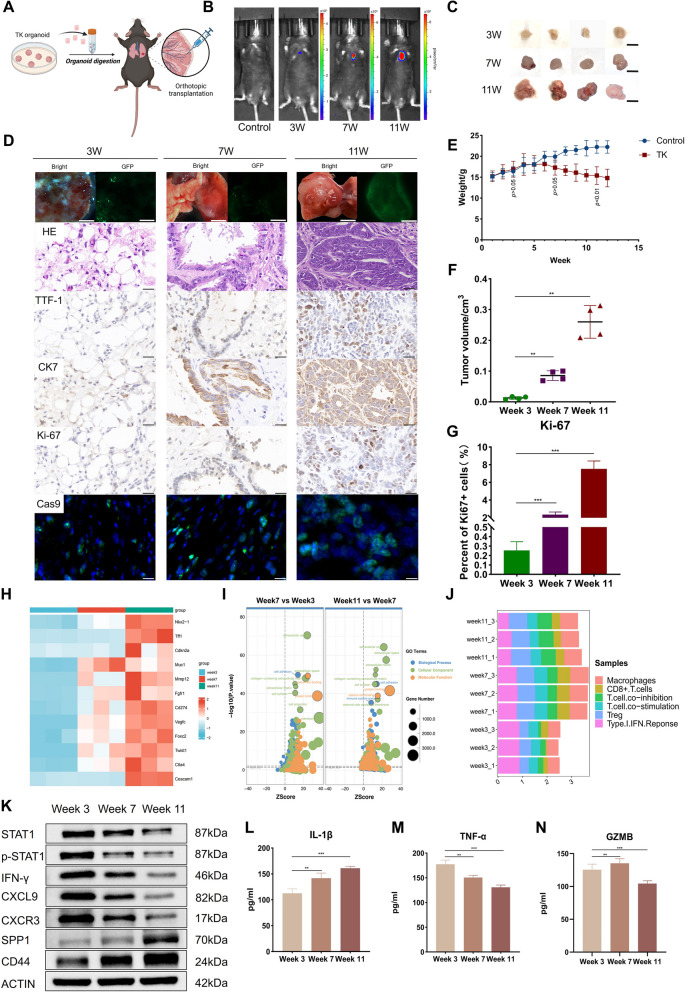
Methods: We performed single-cell RNA sequencing (scRNA-seq) on tumor tissues from eight and seven cases of GGN- and PSN-LUAD, respectively, at different disease stages, including minimally invasive adenocarcinoma (MIA), invasive adenocarcinoma (IAC), and metastatic lung cancer (MLC). Additionally, we analyzed adjacent normal tissues from four cases. Immunohistochemistry, multiplex immunofluorescence, and external scRNA-seq data were employed to confirm the expression of signature genes as well as the distribution patterns of CXCL9 + TAMs and TREM2 + TAMs. A LUAD mouse model was generated using gene editing, organoid culture, and orthotopic transplantation techniques, and comprehensive analyses such as histopathology, RNA sequencing, and Western blotting were performed to validate key pathways.

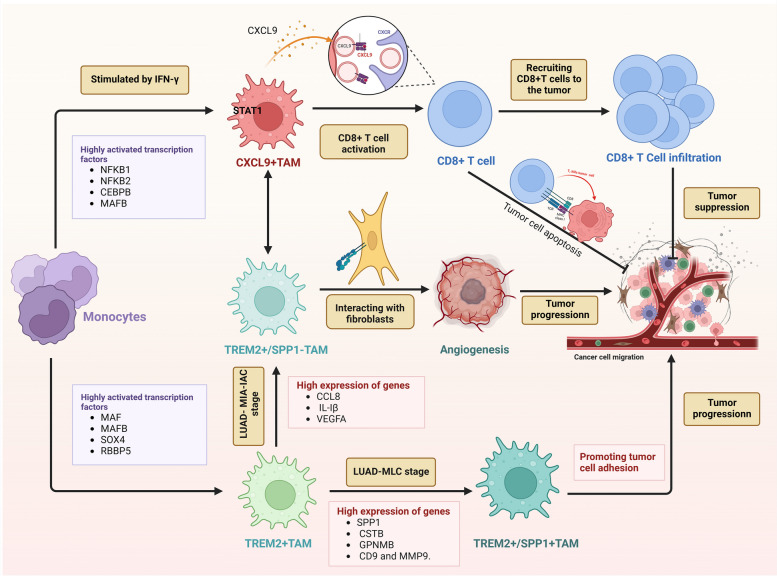
Results: Diverse cellular compositions were observed in the tumor microenvironment (TME) during GGN- and PSN-LUAD invasion and metastasis. Notably, CXCL9 + and TREM2 + tumor-associated macrophages (TAMs) exhibited the most significant enrichment changes. It was found that GGN-LUAD exhibited a stronger immune response than PSN-LUAD, with increased interaction between CXCL9 + TAMs and CD8 + tissue-resident memory T cells during invasion stage (MIA-IAC). Conversely, greater interactions between TREM2 + TAMs and tumor cells were observed in PSN-LUAD during the MLC stage. Additionally, TREM2 + TAMs were found to differentiate into TREM2 + /SPP1 + and TREM2 + /SPP1- TAMs at different stages, which promotes tumor progression. This study also emphasizes that during the transdifferentiation process of GGN- and PSN-LUAD, IFN-γ activates the STAT1 signaling pathway to regulate the activation of CXCL9 + TAMs, and further recruiting CD8 + Trm cells and activating T cells through MHC class I antigen presentation. The role of the IFN-γ/STAT1 pathway in the occurrence and development of LUAD was further validated by animal experiments.

Conclusions: Our findings offer a potential therapeutic strategy to maintain a dynamic balance within the TME and improve the immunotherapy efficacy by modulating the relative proportions and functional states of CXCL9 + TAMs and TREM2 + TAMs.

Keywords: CXCL9; Lung adenocarcinoma; Pulmonary nodule; SPP1; Single-cell RNA sequencing; TREM2; Tumor microenvironment; Tumor-associated macrophage.


Conflict of interest statement

Declarations. Ethics approval and consent to participate: This study adhered to the principles of the Declaration of Helsinki and was approved by the Institutional Review Boards of the Chengdu University of Traditional Chinese Medicine Affiliated Hospital (Institutional Review Board No. 2022KL-051) and Sichuan Cancer Hospital (Institutional Review Board No. SCCHEC-02–2022-109). Written informed consent was obtained from all patients prior to the surgery. Animal experiments were approved by the Institutional Animal Care and Use Committees of Hospital of Chengdu University of Traditional Chinese Medicine. Consent for publication: We have obtained consents to publish this paper from all the participants of this study. Competing interests: The authors declare no competing interests.

Figures

Fig. 1
Fig. 1
The radiological features manifest as cellular landscapes within the tumors and adjacent tissues of lung adenocarcinoma (LUAD) patients with ground-glass nodules (GGN) and part-solid nodules (PSN). A Study overview: we employed single-cell RNA sequencing to analyses fresh human tissue samples obtained from nineteen patients. This cohort included eight cases of GGN–LUAD cases, comprising three instances of minimally invasive adenocarcinoma (MIA), three cases of invasive adenocarcinoma (IAC), and one cases of metastatic lung cancer (MLC) tissues. Additionally, there were eight cases of PSN–LUAD, with the same distribution of MIA, IAC, and two cases of MLC tissues. Four adjacent normal control (NC) tissues were also included for comprehensive analysis. B Uniform Manifold Approximation and Projection (UMAP) visualization was conducted on the 188,594 profiled cells (Centre). Clockwise from the top left, the four corner insets display the UMAP plots of marker gene expression, age distribution, radiographic feature, and grouping by different disease stages
Fig. 2
Fig. 2
The expression patterns of epithelial cells and endothelial cells during the invasive and metastatic processes of ground-glass nodules (GGN)– and part-solid nodules (PSN)–lung adenocarcinoma (LUAD). A The copy number variation (CNV) analysis results of tumor cells at different stages of GGN–LUAD and PSN–LUAD diseases compared to normal epithelial cells. Colors indicate the log2CNV ratio, with red representing amplification and blue representing deletion. B The result of the CopyKat algorithm for various types of epithelial cells. The left panel displays Seurat-clusters, where each point corresponds to a cell, and different colors represent different clusters. The right panel shows the identification of aneuploid and diploid epithelial cells. C Uniform Manifold Approximation and Projection (UMAP) plot of epithelial cells derived from tumors and tumor-adjacent normal tissues, color-coded by different epithelial cell subtypes. D The distribution of the predicted order, as speculated by CytoTRACE, in tumor cells. The color represents the level of cell stemness, with different shades indicating high or low stemness. E Activity score of epithelial-mesenchymal transition (EMT) in each cell. F The distribution of EMT scores in different stages of GGN- and PSN-LUAD. G IHC was employed to evaluate the expression of Ki-67, a LUAD marker, in lung tissues. H Kaplan–Meier analysis of overall survival rates in the GEPIA-LUAD cohorts based on expression levels of the Ki-67 gene. I UMAP plot illustrating endothelial cells derived from tumors and tumor-adjacent normal tissues, color-coded by different endothelial cell subtypes. J RNA velocity analysis reveals the developmental trajectory of the endothelial cell lineage. K The distribution of the predicted order, as speculated by CytoTRACE, in endothelial cells. The color represents high or low stemness of the cells
Fig. 3
Fig. 3
Detailed analysis of myeloid cells. A Uniform Manifold Approximation and Projection (UMAP) plot illustrating subsets of myeloid cells derived from tumors and adjacent normal tissues, color-coded to show different macrophage cell subtypes. Each dot represents a cell, colored to indicate cluster origin. B The RNA velocity analysis reveals the developmental trajectory of the macrophage lineage within the myeloid cell population. C The mean score of the M1 or M2 signature across TREM2 + tumor-associated macrophages (TAMs), RTM + TAMs, CXCL9 + TAMs, IL1B + TAMs, and MMP19 + TAMs. D Immunofluorescence showing the expression of CXCL9 and TREM2 in the tumor microenvironment (TME) at different stages of ground-glass nodules (GGN)–lung adenocarcinoma (LUAD) and part-solid nodules (PSN)–LUAD. Representative images display CXCL9 in yellow, TREM2 in green, CD68 as a macrophage marker in red, and nuclei counterstained with DAPI in blue. The scale bar is 20 μm. E Analysis of the proportion of subsets of macrophages cell types in normal control (NC), GGN–minimally invasive adenocarcinoma (MIA), GGN–invasive adenocarcinoma (IAC), GGN–metastatic lung cancer (MLC), PSN–MIA, PSN–IAC, and PSN–MLC. F Diagram illustrating the inferred CXCL9 + TAM cell differentiation pathway generated by Monocle. G The trajectory of four typical genes (CXCL10, CXCL11, CXCL16, CXCL9). H Pseudotime trajectory of LUAD cell state transitions. I The differentiation trajectory of TREM2 + TAMs can be categorized into SPP1– TAMs (TREM2 + /SPP1– TAMs) and SPP1 + TAMs (TREM2 + /SPP1 + TAMs). J Analysis of the proportion of SPP1 + TAMs and SPP1– TAMs cell type in NC, GGN–MIA, GGN–IAC, GGN–MLC, PSN–MIA, PSN–IAC and PSN–MLC. K The volcano plot illustrates the significantly differentially expressed functional genes between SPP1 + TAMs and SPP1–TAMs. L Representative multiplex immunohistochemistry staining images of mononuclear cells, TREM2 + SPP1 + TAMs, and TREM2 + SPP1 + TAMs in formalin-fixed, paraffin-embedded tumor tissues from LUAD patients. The scale bar is 50 μm
Fig. 4
Fig. 4
A and D. Uniform Manifold Approximation and Projection (UMAP) plot illustrating subsets of T cells (A) and B cells (D) derived from tumors and adjacent normal tissues, color-coded by different macrophage cell subtypes. Each dot represents a single cell, with color indicating its cluster origin. B and E Heat maps demonstrate the expression levels of specific cell markers in subsets of T cell subset (B), and B cell subset (E). Each row represents an individual cell marker, and each column represents a specific cell subset. C and F Analysis of the proportion of T cell (C) and B cell subsets (F) in normal control (NC), ground-glass nodules (GGN)–minimally invasive adenocarcinoma (MIA), GGN–invasive adenocarcinoma (IAC), GGN–metastatic lung cancer (MLC), part-solid nodules (PSN)–MIA, PSN–IAC, and PSN–MLC. G-L Circos plots depicting intercellular CXCL signaling between all cell types in GGN-LUAD and PSN-LUAD, including GGN-MIA (G), GGN-IAC (H), GGN-MLC (I), PSN-MIA (J), PSN-IAC (K), and PSN-MLC (L)
Fig. 5
Fig. 5
A The heatmap displays Gene Set Variation Analysis (GSVA) enrichment scores for CXCL9 + tumor-associated macrophages (TAMs) and TREM2 + TAMs cell characteristic pathways across different disease stages of lung adenocarcinoma (LUAD). B The boxplot shows the activity scores of all TAMs IFN-γ responsive modules based on the added module score. C. Heatmap showing the transcription factor activity regulation for all immune cells from different disease stage samples of LUAD using SCENIC. D The Venn diagram illustrates the intersection genes among genes associated with CXCL9 + TAMs differentiation, IFN-γ pathway-related genes, and specific transcription factors targeting CXCL9. E The ridge plot displays the expression of STAT1 in different TAMs. The height of the ridges represents abundance, and the horizontal axis reflects the gene expression levels. F Line graphs and heat maps depict the expression level variations in STAT1 and CXCL9 genes at different disease stages of ground-glass nodule (GGN)–LUAD and part-solid nodule (PSN)–LUAD. A pie chart displays the correlation coefficients of STAT1 and CXCL9 gene expression levels. G Heatmap showing changes in the activity of the top 5 transcription factors during the differentiation process of SPP1– and SPP1 + TAMs. H Ranking of regulons in classical monocyte, TREM2 + SPP1-TAMs, and TREM2 + SPP1-TAMs based on RSS. I Volcano plot showing the top 10 differentially expressed genes between SPP1 + TAMs and SPP1–TAMs (log2 fold change ≥ 0.5, p ≤ 5 × 10.−2)
Fig. 6
Fig. 6
The generation of Trp53−/−;KrasG12D drivers in premalignant lung organoids. A Stepwise induction protocol for TK (Trp53−/−; KrasG12D) organoids derived from lung tissue of mice. B Representative bright-field (right) images and GFP (middle), and H&E (left) in WT, Trp53−/−, TK mouse lung organoids. Scale bars: 200 μm (right), 200 μm (middle), and 20 μm (left). C Representative immunofluorescence staining of Ki-67 (top) and SFTPC (bottom) in WT, Trp53−/−, and TK mouse lung organoids. Scale bar: 20 μm. D The number of WT (n = 3), Trp53−/− (n = 3), and TK (n = 3) organoids. Data are presented as the means ± SEM; p values were calculated using unpaired t test. ***p < 0.001. E The diameters of WT, Trp53−/−, and TK organoids. Data are presented as the means ± SEM; p values were calculated by unpaired t test. ***p < 0.001. F Luminescence signal intensity of WT (n = 3), Trp53.−/− (n = 3), and TK (n = 3) lung organoids. Data are presented as the means ± SEM; p values were calculated by unpaired t test. ***p < 0.001
Fig. 7
Fig. 7
Modeling lung adenocarcinoma (LUAD) of different stages using engineered lung organoids in mice. A A diagram showing the method of detailed orthotopic transplantation. B Representative bioluminescent images of the TK mice at 3, 7, and 11 weeks. C Photograph of representative TK tumors at 3 (n = 4), 7 (n = 4), and 11 weeks (n = 4) weeks. Scale bar: 5 mm. D Representative bright-field (left) and green fluorescent (right) images of TK tumors at 3, 7, and 11 weeks. Scale bar: 4 mm. E Representative H&E, TTF-1, CK7, Ki-67, and Cas9 staining of TK tumors at 3, 7, and 11 weeks. Scale bar: 50 μm. F Statistical graph showing the weight of the control and TK groups during 12 weeks. Data are shown as means ± SD, calculated using two-sided Student’s t-test. G Statistical graph showing the volume of TK tumors at 3, 7, and 11 weeks (n = 4). H Heatmap showing the expression levels of diagnostic and metastatic of LUAD marker genes in TK tumor tissues at 3 (n = 3), 7 (n = 3), and 11 weeks (n = 3). I Gene Ontology enrichment plot of upregulated genes in the TK mice tumor tissues, comparing the TK tumor tissues at 3, 7, and 11 weeks. J Heatmap of the proportion of six types of immune cells and functions. K Western blot analysis of STAT1, p-STAT1, IFN-γ, CXCL9, CXCR3, SPP1, and CD44 in TK tumor samples at 3, 7, and 11 weeks. L-N ELISA measurement of IL-1β, TNF-α, GZMB in the serum from TK tumor samples at 3, 7, and 11 weeks. Data are presented as the means ± SEM; p values were calculated using unpaired t test. **p < 0.01
Fig. 8
Fig. 8
Mechanism schema diagram. Inhibition of IFN-γ can promote the transformation of monocyte into CXCL9 + TAMs through the transcription factor STAT1 pathway, thus reshaping the tumor immune microenvironment, especially enhancing the expression of CD8 + T cells

References

    1. Mazzone PJ, Lam L. Evaluating the Patient With a Pulmonary Nodule: A Review. JAMA. 2022;327(3):264–73. - PubMed
    1. Hammer MM, Palazzo LL, Kong CY, Hunsaker AR. Cancer Risk in Subsolid Nodules in the National Lung Screening Trial. Radiology. 2019;293(2):441–8. - PMC - PubMed
    1. Sun JD, Sugarbaker E, Byrne SC, Gagné A, Leo R, Swanson SJ, et al. Clinical Outcomes of Resected Pure Ground-Glass, Heterogeneous Ground-Glass, and Part-Solid Pulmonary Nodules. AJR Am J Roentgenol. 2024;222(5): e2330504. - PMC - PubMed
    1. Ye T, Deng L, Wang S, Xiang J, Zhang Y, Hu H, et al. Lung Adenocarcinomas Manifesting as Radiological Part-Solid Nodules Define a Special Clinical Subtype. J Thorac Oncol. 2019;14(4):617–27. - PubMed
    1. Altorki NK, Markowitz GJ, Gao D, Port JL, Saxena A, Stiles B, et al. The lung microenvironment: an important regulator of tumour growth and metastasis. Nat Rev Cancer. 2019;19(1):9–31. - PMC - PubMed

MeSH terms