. 2024 Nov 23;15(1):10178.
doi: 10.1038/s41467-024-54334-7.

Outcome of SARS-CoV-2 reinfection depends on genetic background in female mice

Affiliations

Outcome of SARS-CoV-2 reinfection depends on genetic background in female mice

Gagandeep Singh et al. Nat Commun. .

Abstract

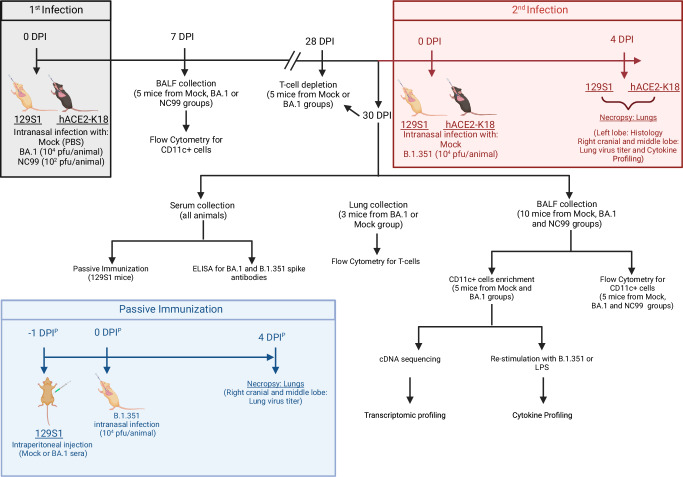
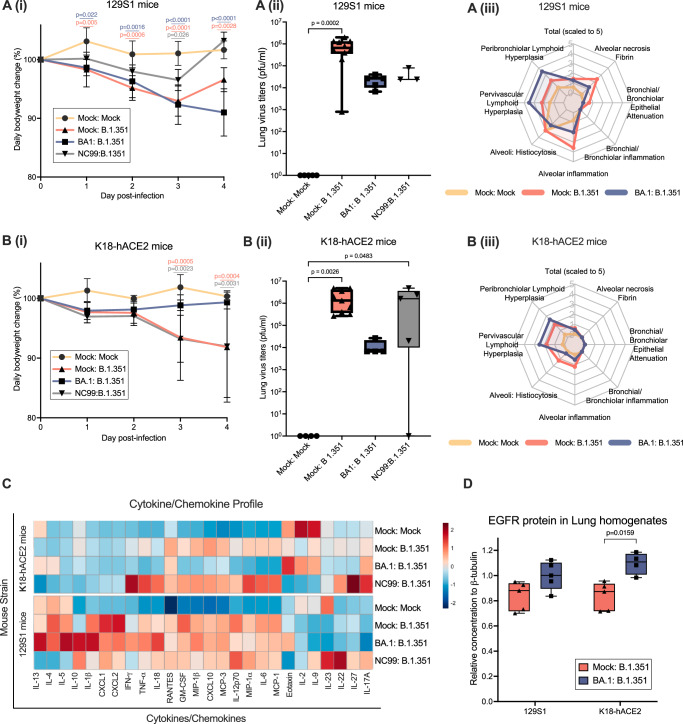
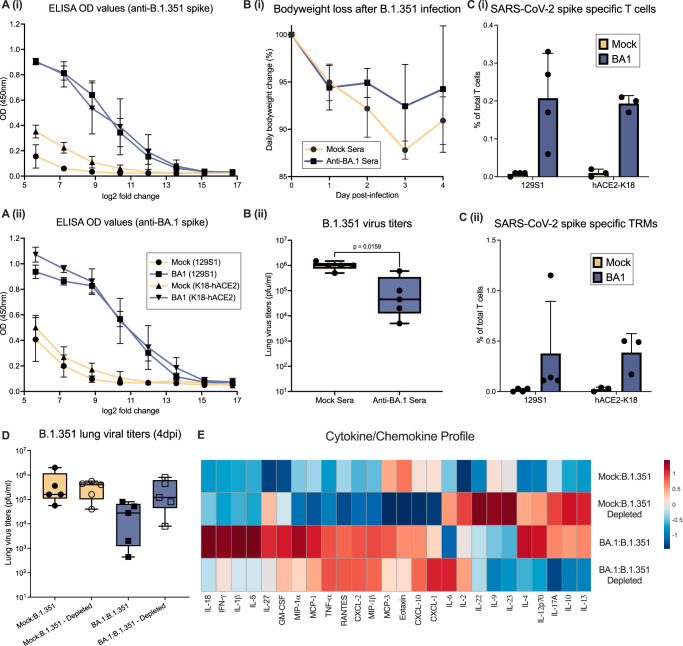
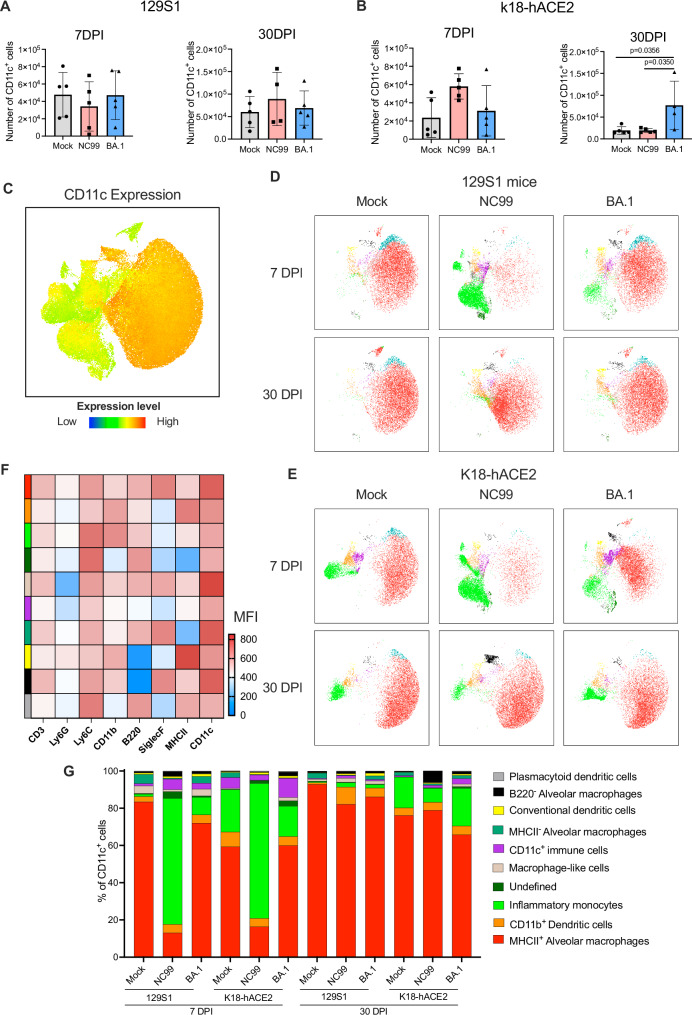
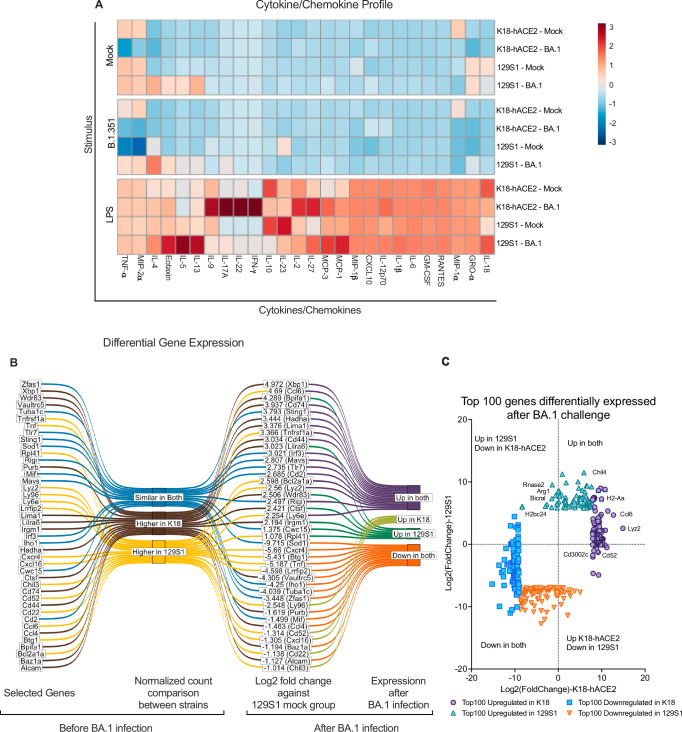
Antigenically distinct SARS-CoV-2 variants increase the reinfection risk for vaccinated and previously exposed population due to antibody neutralization escape. COVID-19 severity depends on many variables, including host immune responses, which differ depending on genetic predisposition. To address this, we perform immune profiling of female mice with different genetic backgrounds -transgenic K18-hACE2 and wild-type 129S1- infected with the severe B.1.351, 30 days after exposure to the milder BA.1 or severe H1N1. Prior BA.1 infection protects against B.1.351-induced morbidity in K18-hACE2 but aggravates disease in 129S1. H1N1 protects against B.1.351-induced morbidity only in 129S1. Enhanced severity in B.1.351 re-infected 129S1 is characterized by an increase of IL-10, IL-1β, IL-18 and IFN-γ, while in K18-hACE2 the cytokine profile resembles naïve mice undergoing their first viral infection. Enhanced pathology during 129S1 reinfection cannot be attributed to weaker adaptive immune responses to BA.1. Infection with BA.1 causes long-term differential remodeling and transcriptional changes in the bronchioalveolar CD11c+ compartment. K18-hACE2 CD11c+ cells show a strong antiviral defense expression profile whereas 129S1 CD11c+ cells present a more pro-inflammatory response upon restimulation. In conclusion, BA.1 induces cross-reactive adaptive immune responses in K18-hACE2 and 129S1, but reinfection outcome correlates with differential CD11c+ cells responses in the alveolar space.


Conflict of interest statement

Competing interests: The M.S. laboratory has received unrelated funding support in sponsored research agreements from Phio Pharmaceuticals, 7Hills Pharma, ArgenX BV and Moderna. The A.G.-S. laboratory has received research support from GSK, Pfizer, Senhwa Biosciences, Kenall Manufacturing, Blade Therapeutics, Avimex, Johnson & Johnson, Dynavax, 7Hills Pharma, Pharmamar, ImmunityBio, Accurius, Nanocomposix, Hexamer, N-fold LLC, Model Medicines, Atea Pharma, Applied Biological Laboratories and Merck, outside of the reported work. A.G.-S. has consulting agreements for the following companies involving cash and/or stock: Castlevax, Amovir, Vivaldi Biosciences, Contrafect, 7Hills Pharma, Avimex, Pagoda, Accurius, Esperovax, Farmak, Applied Biological Laboratories, Pharmamar, CureLab Oncology, CureLab Veterinary, Synairgen, Paratus and Pfizer, outside of the reported work. A.G.-S. has been an invited speaker in meeting events organized by Seqirus, Janssen, Abbott and Astrazeneca. A.G.-S. is inventor on patents and patent applications on the use of antivirals and vaccines for the treatment and prevention of virus infections and cancer, owned by the Icahn School of Medicine at Mount Sinai, New York. The remaining authors declare no competing interests.

Figures

Fig. 1
Fig. 1. Experimental design to assess the impact of reinfection and secondary infection with SARS-CoV-2 in mice with different genetic backgrounds.
Mice were first infected with either Mock (PBS), BA.1 (104 PFU) or NC99 (102 PFU) and allowed to recover for 30 days (1st infection, highlighted in black). 7- and 30-days post infection (DPI), 5 animals from each group were necropsied and bronchioalveolar lavage fluid (BALF) was collected to evaluate CD11c+ populations via flow cytometry. At 30 DPI, BA.1- infected or mock-infected mice (n = 3) were euthanized to collect serum, whole lungs and BALF. Whole lungs were used for downstream analysis of T-cell responses by flow cytometry. Bronchioalveolar lavage fluid (BALF; n = 5) was the source of CD11c+ cells for isolation, which were further subjected to transcriptome and cytokine/chemokine recall response analysis. Serum collected at 30 DPI was used to assess antibody responses against BA.1 and B.1.351 spike protein and for further passive immunization studies (highlighted in blue). For T-cell depletion experiments, mice were depleted at 28 and 30 DPI (24 h and 72 h prior to B.1.351 challenge). 31 days after the first infection, mice were challenged with 104 PFU of B.1.351 (2nd infection, highlighted in red). After the 2nd infection, mice’s bodyweights were measured daily to assess infection severity. 4 days after B.1.351 challenge (4DPI, highlighted in red), mice were necropsied and lungs were collected for downstream analysis of lung virus titers, lung histopathogy and cytokine/chemokine responses. For passive immunization experiments (highlighted in blue), 129S1 mice were intraperitoneal injected with pooled serum from either mock infected or BA.1 infected mice. One day after, mice were infected with B.1.351 (104 PFU). Again, 4 days after B.1.351 infection, mice were necropsied and lungs were collected to assess viral titers, histopathogy and cytokine/chemokine responses. The number of mice/group used for the different analyses is mentioned in each figure legend. Created in BioRender. Singh (2022) https://BioRender.com/a23x374.
Fig. 2
Fig. 2. Opposite effects of BA.1 or NC99 pre-exposure in B.1.351 disease severity outcomes depending on mouse genetic background.
K18-hACE2 or 129S1 mice were infected with B.1.351 31 days after exposure to BA.1 (reinfection, n = 5) or NC99 (secondary infection, n = 5). A group mock infected twice (Mock:Mock, n = 5) and a group mock-infected and challenged 31 days after with B.1.351 (Mock:B.1.351, n = 10) were also included. Samples from every mice were used for every analysis unless otherwise specified. A (i): Mean ± SD weight change in 129S1 mice after mock-challenge or challenge with 104 PFU of B.1.351. Statistical analysis: Kruskal–Wallis test with Dunnett’s multiple comparisons test to the Mock:Mock group. A (ii): Infectious virus titers in the lungs of mock, BA.1 (n = 5) or NC99 pre-infected (n = 3) 129S1 mice inoculated with 104 PFU of B.1.351. Representation: Box-plot with median as center, 25th to 75th percentile-bound box and whiskers representing maximum and minimum values. Statistical analysis: Ordinary two-way ANOVA with Dunnett’s multiple comparisons test to the Mock:Mock group. A (iii): Histopathological scores from mock or BA.1 pre-infected 129S1 mice inoculated with mock or 104 PFU of B.1.351 (n = 5, per group). B (i): Mean±SD weight change in K18-hACE2 mice after mock-challenge or challenge with 104 PFU of B.1.351. Statistical analysis: see A (i). B (ii): Infectious virus titer in lungs of mock or BA.1 or NC99 pre-infected K18-hACE2 mice inoculated with mock or 104 PFU of B.1.351. Representation and statistical analysis: see A (ii). B (iii): Histopathological scores from mock or BA.1 pre-infected K18-hACE2 mice inoculated with mock or 104 PFU of B.1.351 (n = 5, per group). C: Heatmap of cytokine/chemokine profile of lung homogenates from mock, BA.1 or NC99 pre-infected K18-hACE2 or 129S1 mice inoculated with mock or 104 PFU of B.1.351. Z-score calculations from average Net-MFI results are represented. D: EGFR protein quantification from lung homogenates from BA.1 pre-infected K18-hACE2 (n = 5) or 129S1 (n = 5) mice or mock pre-infected [K18-hACE2 (n = 4) or 129S1 (n = 5)] mice challenged with 104 PFU of B.1.351. Representation: see A (ii). Statistical analysis: Two-tailed Mann–Whitney T-test. Statistical significance is represented as exact p-value. Source data are provided as a Source Data file.
Fig. 3
Fig. 3. Differences in adaptive immune responses upon BA.1 infection do not explain differences in re-infection outcomes.
A Line graph showing ELISA results in transformed Log2 fold dilutions (x-axis) of 30 DPI serum from K18-hACE2 (n = 4) and 129S1 (n = 5) versus mean ±SD OD values at 450 nm (y-axis) against B.1.351 spike (i) or BA.1 spike (ii) protein. B (i): Mean ±SD weight change in 129S1 mice inoculated with 104 PFU of B.1.351 after passive immunization with either mock (n = 5) or ant-BA.1 serum (n = 5). B (ii): Infectious virus titers in lungs from passive immunized 129S1 mice with either mock (n = 5) or ant-BA.1 serum (n = 5) 4 DPI after B.1.351 inoculation. Representation: Box-plot with median as center, 25th to 75th percentile-bound box and whiskers representing maximum and minimum values. Statistical analysis: Two-tailed Mann–Whitney T-test. C (i): Spike-specific T-cells as percentage (mean±SD) of total T cells in murine lungs at 30 DPI after BA.1 or mock challenge (129S1 mice n = 4 per group, K18-hACE2 mice n = 3 per group). C (ii): Spike-specific tissue resident memory T-cells as percentage (mean±SD) of total T cells in murine lungs at 30 DPI after BA.1 or mock challenge (129S1 mice n = 4 per group, K18-hACE2 mice n = 3 per group). D: B.1.351 lung viral titers 4 DPI in 129S1 mice pre-exposed or not to BA.1, either T-cell depleted or immunocompetent (n = 5, per group). Representation: see B(ii), E Heatmap graph of cytokine/chemokine profile of lung homogenates from mock or BA.1 pre-infected 129S1 mice, either T-cell depleted or not, inoculated with either 104 PFU of B.1.351. Z-score calculations from Net-MFI results are represented in the heatmap (n = 5, per group). Mann–Whitney t-test was used to determine statistical significance of the results, where exact p-values are presented. Source data are provided as a Source Data file.
Fig. 4
Fig. 4. CD11c+ alveolar compartment is extensively remodeled after BA.1 and NC99 infection.
Early (7 DPI) and late (30 DPI) timepoints after NC99 or BA.1 infection reveal profound changes in the CD11c+ subpopulations of BALF. A Total number of CD11c+ cells (mean ± SD) in BALF collected from 129S1 mice 7- and 30-days post infection with Mock (n = 5 per timepoint), NC99 (n = 5 at 7DPI, n = 4 at 30DPI) or BA.1 (n = 5 per timepoint). B Total number of CD11c+ cells (mean ± SD) in BALF collected from K18-hACE2 mice 7DPI and 30 DPI with Mock (n = 5 per timepoint), NC99 (n = 5 per timepoint) or BA.1 (n = 5 at 7DPI, n = 30 at 30DPI). Statistical analysis by ordinary one-way ANOVA with Dunnett’s multiple comparison. CG Dimensionality reduction analysis performed by Uniform Manifold Approximation and Projection with a Nearest-Neighbours clustering algorithm combined with FlowSOM cluster visualization algorithm. Data from mice in the sample group was combined and randomely downsampled to a total of 10.000 events per group prior to the analysis dimensionality reduction analysis. C Expression levels of CD11c+. Higher expression levels indicated by red colors; lower expression levels indicated by green colors. D CD11c+ subpopulation clusters in BALF collected from 129S1 animals either mock-, NC99- or BA.1-challenged, 7 or 30 DPI. E CD11c+ subpopulation clusters in BALF collected from K18-hACE2 animals either mock-, NC99- or BA.1-challenged, 7 or 30 DPI. F Heatmap of the expression of CD3, Ly6G, Ly6C, CD11b, B220, SiglecF, MHCII and CD11c markers in the different populations. G Stack bar plot with the frequencies of the different CD11c+ populations in 129S1 and K18-hACE2 mice, depending on the infection and the day of collection of the BALF. Experiments were performed with 5 or 4 mice per group and per timepoint. Source data are provided as a Source Data file.
Fig. 5
Fig. 5. CD11c+ cells react differently during ex vivo restimulation depending on mouse genetic background and prior exposure to BA.1 virus.
BA.1 inoculated K18-hACE2 (n = 8) or 129S1 (n = 9) mice were euthanized after 30 DPI, Lungs (n = 4 or 3) or BALF (n = 5) were collected. CD11c+ cells were enriched from the BALF and used for trained immunity experiment. A Heatmap graph of the cytokine/chemokine profile of CD11c+ BALF cells either stimulated with mock media (1X RPMI, upper), Beta (104 PFU of B.1.351, middle), or LPS (lower) after 48 h. B Results from the long-read-RNAseq analysis from CD11c+ BALF cells isolated from mice at 30 days post-infection. Sankey diagram selected gene with their relative gene expression in mock groups and their relative change after BA.1 infection in each strain. C Top 100 up and down regulated genes by BA.1 infection in CD11c+ cells from 129S1 and K18-hACE2 mice represented as Log2(Fold change). Source data are provided as a Source Data file.

Update of

References

    1. Markov, P. V. et al. The evolution of SARS-CoV-2. Nat. Rev. Microbiol.21, 361–379 (2023). - PubMed
    1. Abu-Raddad, L. J. et al. Assessment of the Risk of Severe Acute Respiratory Syndrome Coronavirus 2 (SARS-CoV-2) Reinfection in an Intense Reexposure Setting. Clin. Infect. Dis.73, e1830–e1840 (2021). - PMC - PubMed
    1. Babiker, A., Marvil, C. E., Waggoner, J. J., Collins, M. H. & Piantadosi, A. The Importance and Challenges of Identifying SARS-CoV-2 Reinfections. J. Clin. Microbiol. 59, 10.1128/jcm.02769-20 (2021). - PMC - PubMed
    1. Nguyen, N. N. et al. SARS-CoV-2 reinfection and COVID-19 severity. Emerg. Microbes Infect.11, 894–901 (2022). - PMC - PubMed
    1. Stein, C. et al. Past SARS-CoV-2 infection protection against re-infection: a systematic review and meta-analysis. Lancet401, 833–842 (2023). - PMC - PubMed

Publication types

MeSH terms

Supplementary concepts

Associated data