. 2024 Nov 23;15(1):10174.
doi: 10.1038/s41467-024-54579-2.

Single-cell transcriptomics unveils molecular signatures of neuronal vulnerability in a mouse model of prion disease that overlap with Alzheimer's disease

Affiliations

Single-cell transcriptomics unveils molecular signatures of neuronal vulnerability in a mouse model of prion disease that overlap with Alzheimer's disease

Jessy A Slota et al. Nat Commun. .

Abstract

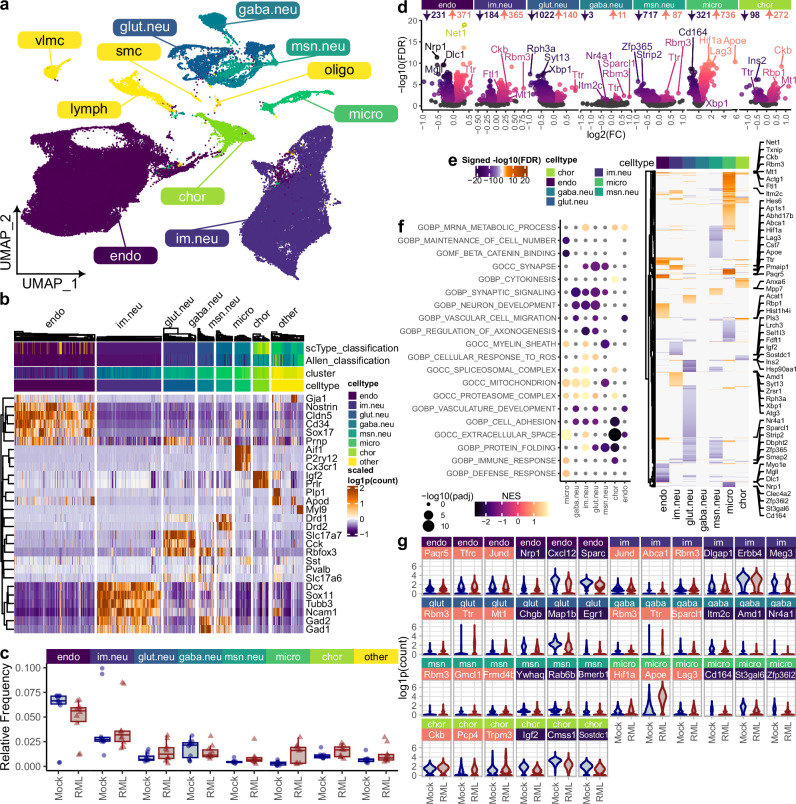
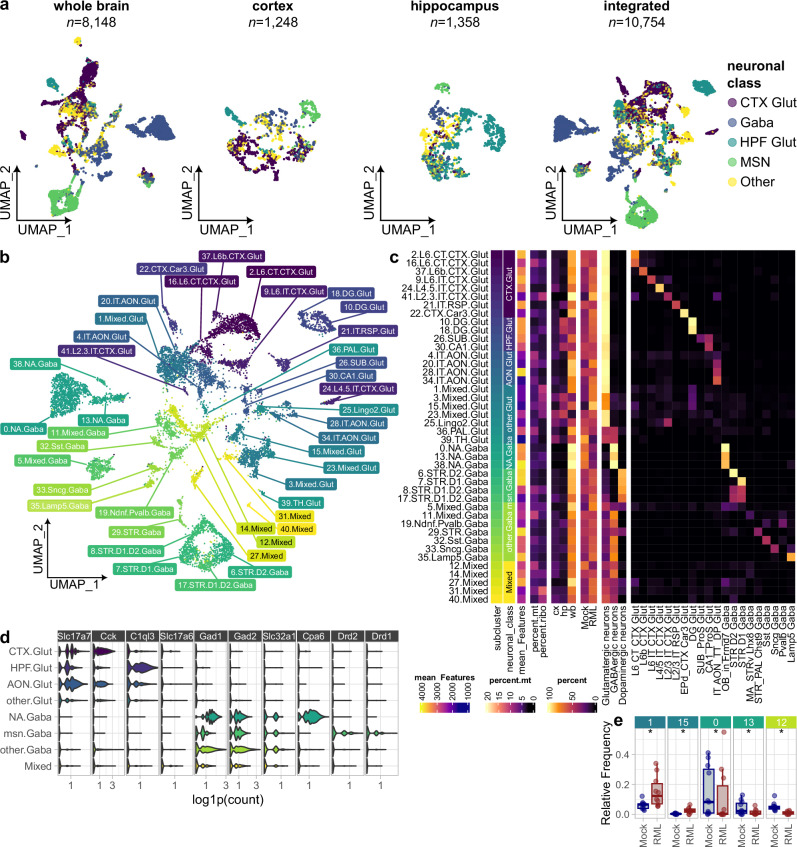
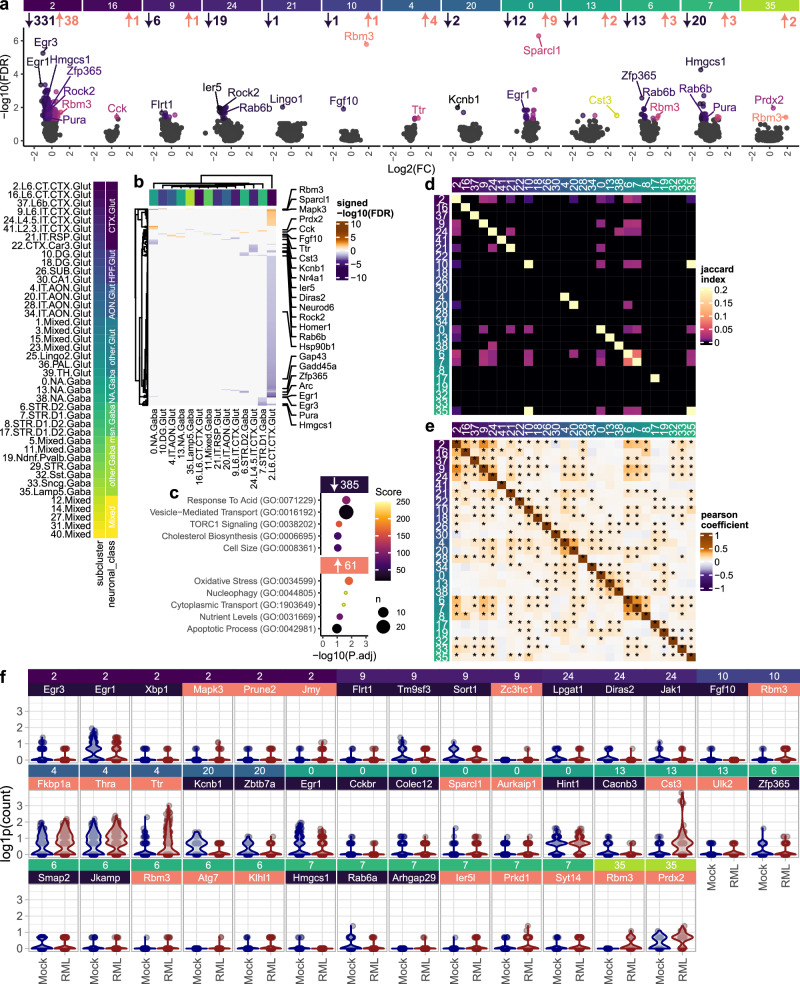
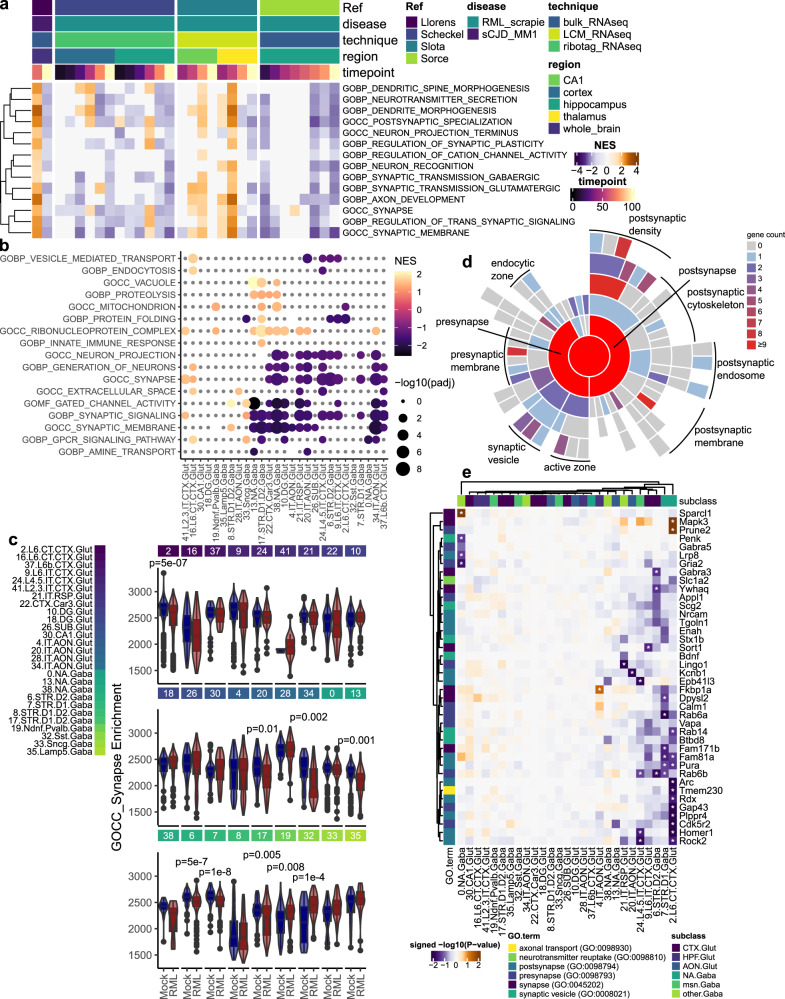
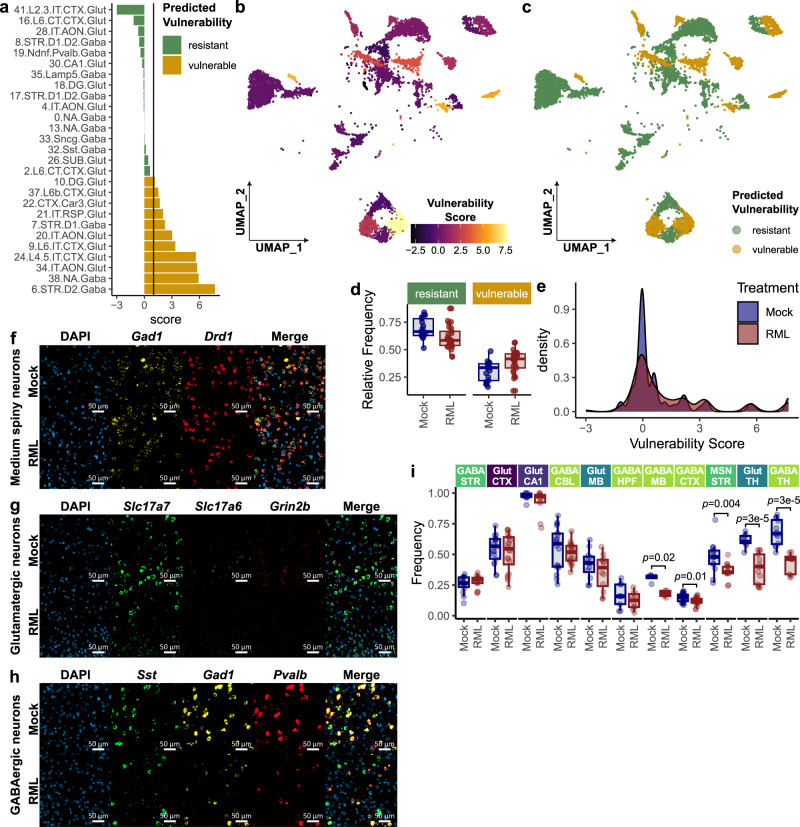
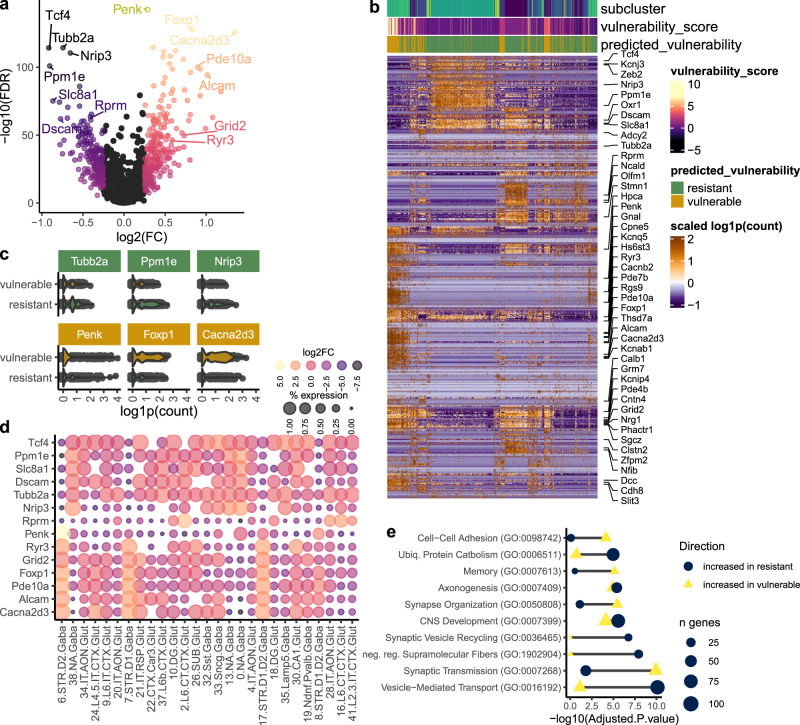
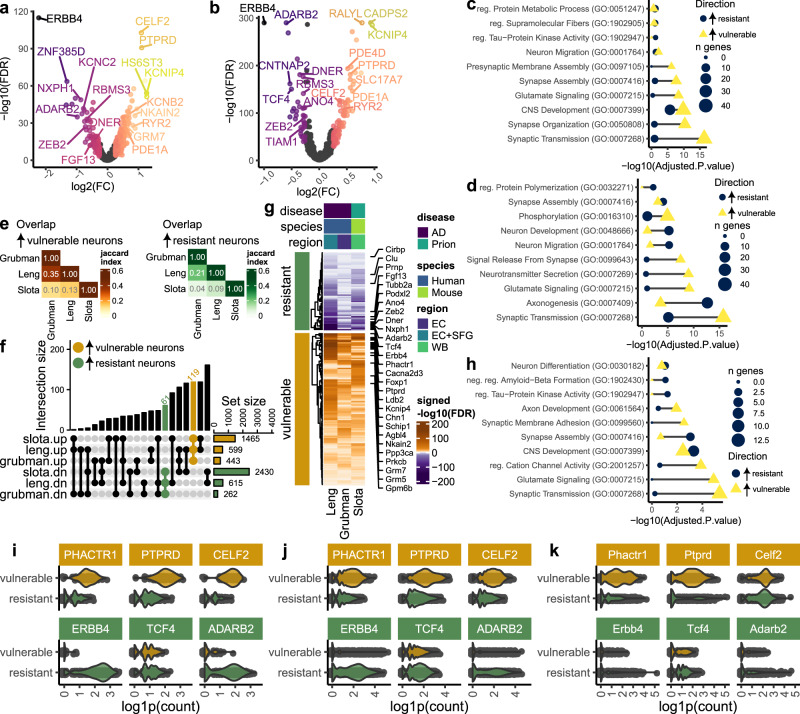
Understanding why certain neurons are more sensitive to dysfunction and death caused by misfolded proteins could provide therapeutically relevant insights into neurodegenerative disorders. Here, we harnessed single-cell transcriptomics to examine live neurons isolated from prion-infected female mice, aiming to identify and characterize prion-vulnerable neuronal subsets. Our analysis revealed distinct transcriptional responses across neuronal subsets, with a consistent pathway-level depletion of synaptic gene expression in damage-vulnerable neurons. By scoring neuronal damage based on the magnitude of depleted synaptic gene expression, we identified a diverse spectrum of prion-vulnerable glutamatergic, GABAergic, and medium spiny neurons. Comparison between prion-vulnerable and resistant neurons highlighted baseline gene expression differences that could influence neuronal vulnerability. For instance, the neuroprotective cold-shock protein Rbm3 exhibited higher baseline gene expression in prion-resistant neurons and was robustly upregulated across diverse neuronal classes upon prion infection. We also identified vulnerability-correlated transcripts that overlapped between prion and Alzheimer's disease. Our findings not only demonstrate the potential of single-cell transcriptomics to identify damage-vulnerable neurons, but also provide molecular insights into neuronal vulnerability and highlight commonalties across neurodegenerative disorders.


Conflict of interest statement

Competing interests: The authors declare no competing interests.

Figures

Fig. 1
Fig. 1. A neuron-enriched single-cell transcriptional atlas of prion disease.
a UMAP plot of 100,946 cells classified into 34 clusters of endothelial cells, immature neurons, glutamatergic, GABAergic, and medium spiny neurons, microglia, and choroid plexus cells, among others. b Hierarchical clustering (Pearson correlation) of gene expression profiles was used to visualize the specificity of marker transcript (identified with Seurat’s Wilcoxon rank-sum test) expression across different brain cell types. c Relative frequencies of major brain cell types were compared between RML (n = 5) and Mock (n = 4) infected mice using scCODA’s Bayesian model that uses a direct posterior probability approach for FDR estimation (* FDR <  0.05). Boxplots show mean (center line), 25th and 75th percentiles (upper and lower hinges), and 1.5*IQR (whiskers). d volcano plots and (e) heatmap show prion-altered transcripts amongst each major brain cell type. MAST’s likelihood-ratio test was used for differential expression analysis (FDR p-value < 0.05). f Plot shows top pathways enriched with prion-altered transcripts among major brain cell types, as determined via pre-ranked gene set enrichment analysis using fgsea’s adaptive multi-level split Monte-Carlo scheme for p-value estimation. g Violin plots show prion-altered (identified with MAST’s likelihood-ratio test) expression of select transcripts within each brain cell type.
Fig. 2
Fig. 2. Dataset integration produces a transcriptional atlas of high-quality live neurons during prion infection.
a UMAP plots show neuronal transcriptomes originating from scRNAseq datasets made from the whole brain (this study), cortex (Slota et al. 2022), and hippocampus (Slota et al. 2022), which were integrated to produce a single-cell transcriptional atlas of prion-infected neurons. b UMAP plot of 10,754 glutamatergic, GABAergic, and medium spiny neurons classified into 42 sub-clusters. c Each sub-cluster was annotated with its neuronal class, mean genes detected per cell, mean percent mitochondrial and ribosomal transcript expression, percentage of cells originating from cortical, hippocampal, and whole brain tissues, percentage of cells originating from RML and Mock treated mice, and percentage of cells classified according to scType and Allen brain atlas. d Violin plots show expression of transcripts that demarked overarching neuronal sub-classes (identified with Seurat’s Wilcoxon rank-sum test). e Credible differences in cell composition between RML (n = 5) and Mock (n = 4) infected mice among whole brain samples were identified using scCODA’s Bayesian model (* FDR <  0.05, subcluster 33.Sncg.Gaba was automatically selected as the reference). Boxplots show mean (center line), 25th and 75th percentiles (upper and lower hinges), and 1.5*IQR (whiskers).
Fig. 3
Fig. 3. Prion-altered neuronal gene expression.
Prion-altered transcripts were identified among high-quality neuronal clusters using MAST’s generalized linear mixed model with a random effect for individual libraries. Prion-altered transcription was visualized with (a) volcano plots and (b) hierarchical clustering. c Biological process gene ontologies enriched with all prion-altered genes that were increased and decreased among pure neuronal clusters were determined using the Fisher exact test implemented by Enrichr. Heatmaps show (d) overlap and (e) correlation between differential expression results for each neuronal subcluster. f Violin plots show expression of up to the top 3 prion-altered transcripts per neuronal cluster (identified with MAST’s likelihood-ratio test).
Fig. 4
Fig. 4. RNA-FISH validation of prion-altered neuronal gene expression.
Representative images show RNAscope probe panels that were used to assess (a) Ttr, (b) Rbm3, and (c) Egr1 expression in Slc17a7+ glutamatergic neurons and Gad1+ GABAergic neurons in the cortex, CA1, and dentate gyrus. Three additional RNAscrope probe panels assessed (d) Ttr, (e) Rbm3, and (f) Rab6b expression in Drd1+ and Drd2+ striatal medium spiny neurons. Scale bar = 5 µm. g Gene expression was measured as the average puncti density per mouse and compared between prion (n = 3) and mock-infected (n = 3) mice using the student’s t test. P-values: 0.033, 0.79, 0.00064, 0.91, 0.041, 0.0018, 0.0060, 0.0031, 0.013, 0.095, 0.11, 0.094, 0.25, 0.65, 0.13, 0.32, 0.17, 0.14. Boxplots show mean (center line), 25th and 75th percentiles (upper and lower hinges), and 1.5*IQR (whiskers). h Prion-altered abundance, expressed as the signed –log10(FDR), of Ttr, Rbm3, Egr1, and Rab6b, was examined longitudinally in previously published bulk RNAseq datasets of prion-infected mice.
Fig. 5
Fig. 5. Neuronal synaptic gene expression is consistently depleted in prion disease.
a GSEA, using fgsea’s adaptive multi-level split Monte-Carlo scheme for p-value estimation, was used to compare the enrichment of synapse-related gene sets throughout prion disease progression from previously published bulk RNAseq datasets of prion-infected mice. b Fgsea’s adaptive multi-level split Monte-Carlo scheme for p-value estimation was used to identify gene sets that were enriched with prion-altered transcripts (pre-ranked using MAST’s likelihood ratio rest) within each neuronal cluster. c Enrichment of the GOCC Synapse gene set was measured within individual neurons and compared between prion (n = 3) and mock (n = 3) infected mice using the t test and FDR correction implemented by Escape (p-values: 5.1E-07, 0.38, 1, 1, 0.89, 1, 1, 1, 0.29, 1, 1, 1, 1, 0.012, 1, 0.0025, 0.10, 0.0010, 0.21, 5.2E-07, 1.4E-08, 1, 0.0053, 0.0075, 0.00013, 0.034, 1). Boxplots show mean (center line), 25th and 75th percentiles (upper and lower hinges), and 1.5*IQR (whiskers). d Sunburst plots show synaptic localization of prion-altered transcripts (number of genes). e Heatmap shows the effect size of synapse-related transcripts within each neuronal subcluster (MAST’s likelihood ratio test; * FDR corrected p-value < 0.05).
Fig. 6
Fig. 6. Identification of vulnerable neuronal subsets in prion-infected mice.
a Neuronal sub-clusters were ranked by vulnerability score, defined as –signed(-log10(FDR)) of prion-altered enrichment of the GOCC Synapse gene set, identified through GSEA against pre-ranked transcripts from the MAST differential expression analysis. Vulnerable neuronal clusters were defined as those with vulnerability score > 1 (i.e., decreased GOCC Synapse enrichment from GSEA with FDR = 0.1). UMAP plots are shown for neurons, annotated with (b) vulnerability scores and (c) the predicted vulnerability of each neuronal cluster. d Cellular composition was compared between neurons defined as ‘vulnerable’ and ‘resistant’ in prion- (n = 13) and mock-infected (n = 8) mice. e Distribution of neuronal vulnerability scores were compared between prion and mock-infected mice. In an independent assessment of neuronal vulnerability, three panels of RNAscope probes were used to identify Glutamatergic neurons (Slc17a7, Slc17a6, Grid2), GABAergic neurons (Gad1, Pvalb, Sst) and MSN’s (Gad1, Drd1) in formalin-fixed coronal sections from RML and Mock infected mice. Regions of interest (ROI’s) were selected from the striatum, cortex, cerebellum, hippocampus, thalamus, and midbrain for analysis. Representative ROI’s are shown for (f) striatal medium spiny neurons, (g) cortical glutamatergic neurons, and (h) cortical GABAergic neurons. i Neuronal vulnerability was assessed by comparing the abundance of each neuronal subset between prion- (n = 3) and mock-infected (n = 3) mice (two-sided Wilcoxon rank-sum test; p-values: 0.84, 0.52, 0.49, 0.48, 0.41, 0.36, 0.016, 0.012, 0.0039, 2.8E-05, 2.7E-05). Boxplots (d and i) show mean (center line), 25th and 75th percentiles (upper and lower hinges), and 1.5*IQR (whiskers).
Fig. 7
Fig. 7. Molecular correlates of neuronal vulnerability to synaptic damage in prion disease.
a Transcripts that correlated with neuronal vulnerability score were identified through differential expression analysis with MAST’s two-part generalized linear model, assigning vulnerability score as a co-variate. b Hierarchical clustering of gene expression profiles of vulnerability-correlated transcripts (identified with MAST’s likelihood ratio test) between neuronal clusters classified as vulnerable and resistant. c Violin plots show expression of the top 3 transcripts associated with vulnerable and resistant neurons (identified with MAST’s likelihood ratio test). d Expression of select vulnerability-correlated transcripts is shown per neuronal subcluster. e Enrichr’s Fisher exact test was used to compute gene ontologies enriched with transcripts that were significantly associated with vulnerable and resistant neurons (identified with MAST’s likelihood ratio test).
Fig. 8
Fig. 8. Molecular correlates of neuronal vulnerability partially overlap between prion and Alzheimer’s disease.
We identified baseline transcriptional differences that were correlated with neuronal vulnerability in Alzheimer’s disease by analyzing two snRNAseq datasets previously published by Grubman et al. and Leng et al. (Supplementary Fig. 10). Volcano plots show vulnerability-correlated transcripts identified via MAST’s two-part hurdle model in the (a) Grubman et al. and (b) Leng et al. datasets. Enrichr’s Fisher exact test was used to compute gene ontologies enriched with transcripts that were significantly associated with vulnerable and resistant neurons in the (c) Grubman et al. and (d) Leng et al. datasets. Vulnerability-correlated transcripts (identified via MAST’s likelihood-ratio test) were next compared between the Grubman and Leng Alzheimer’s Disease datasets with our prion (Slota) dataset. e Heatmap and (f) upset plot show the overlap of vulnerability-correlated transcripts identified in prion disease and Alzheimer’s disease. g Heatmap shows a subset of vulnerability-correlated transcripts that were consistently increased in resistant and vulnerable neurons across all three datasets. h) Enrichment of gene ontologies was compared between shared markers of resistant and vulnerable neurons using Enrichr’s Fisher exact test. Violin plots show expression of the top 3 transcripts associated with vulnerable and resistant neurons (identified via MAST’s likelihood-ratio test) in the (i) Grubman et al., (j) Leng et al., and (k) Slota et al. (this study) datasets.

References

    1. Prusiner, S. B. Prions. Proc. Natl. Acad. Sci. USA95, 13363–13383 (1998). - PMC - PubMed
    1. Soto, C. & Satani, N. The intricate mechanisms of neurodegeneration in prion diseases. Trends Mol. Med.17, 14–14 (2011). - PMC - PubMed
    1. Jackson, W. S. Selective vulnerability to neurodegenerative disease: the curious case of Prion Protein. Dis. Model. Mech.7, 21–21 (2014). - PMC - PubMed
    1. Scheckel, C. & Aguzzi, A. Prions, prionoids and protein misfolding disorders. Nat. Rev. Genet.19, 405–418 (2018). - PubMed
    1. Saxena, S. & Caroni, P. Selective neuronal vulnerability in neurodegenerative diseases: from stressor thresholds to degeneration. Neuron71, 35–48 (2011). - PubMed

Publication types

Substances

Associated data