. 2024 Nov 23;15(1):10183.
doi: 10.1038/s41467-024-54547-w.

Multi-omic and single-cell profiling of chromothriptic medulloblastoma reveals genomic and transcriptomic consequences of genome instability

Affiliations

Multi-omic and single-cell profiling of chromothriptic medulloblastoma reveals genomic and transcriptomic consequences of genome instability

Petr Smirnov et al. Nat Commun. .

Erratum in

Abstract

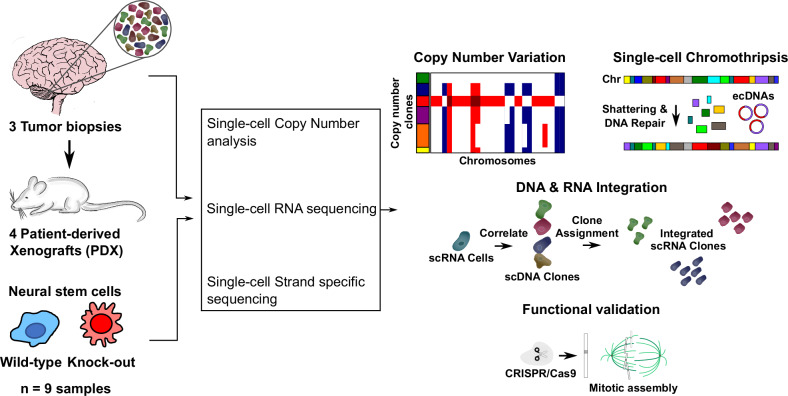
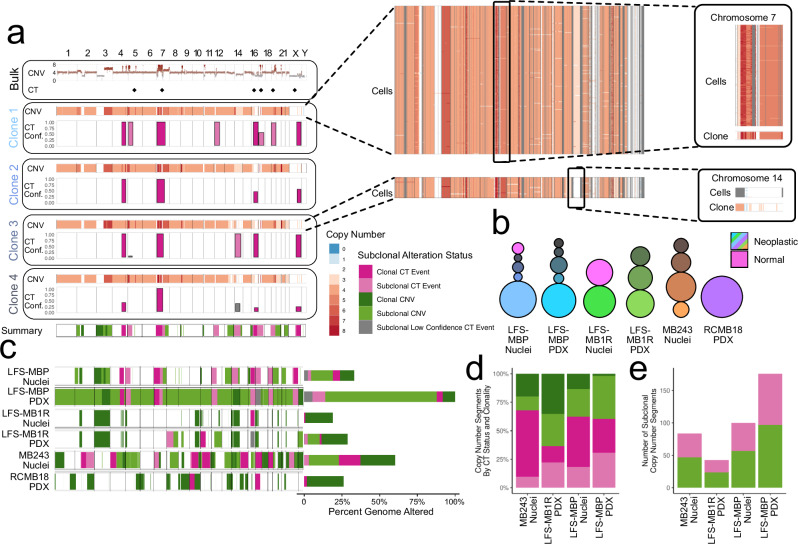
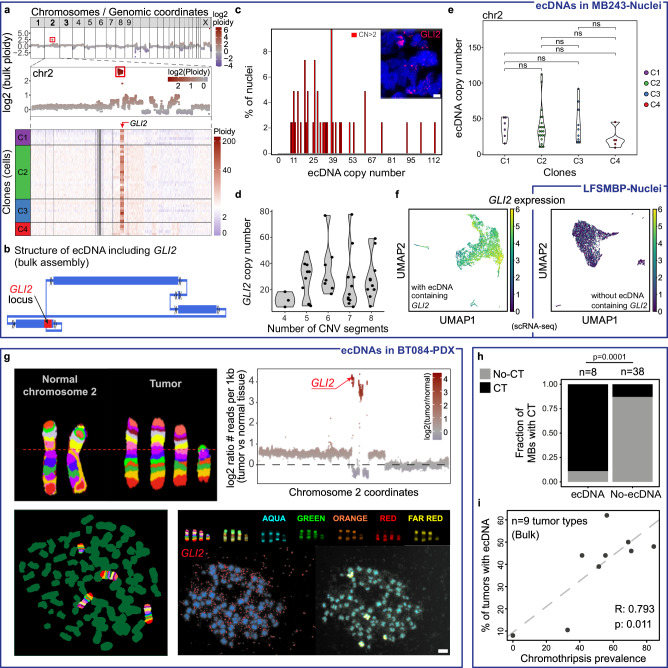
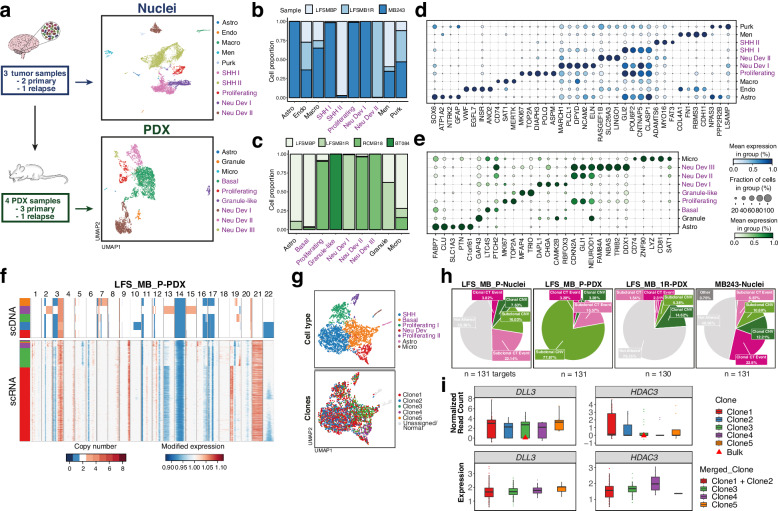
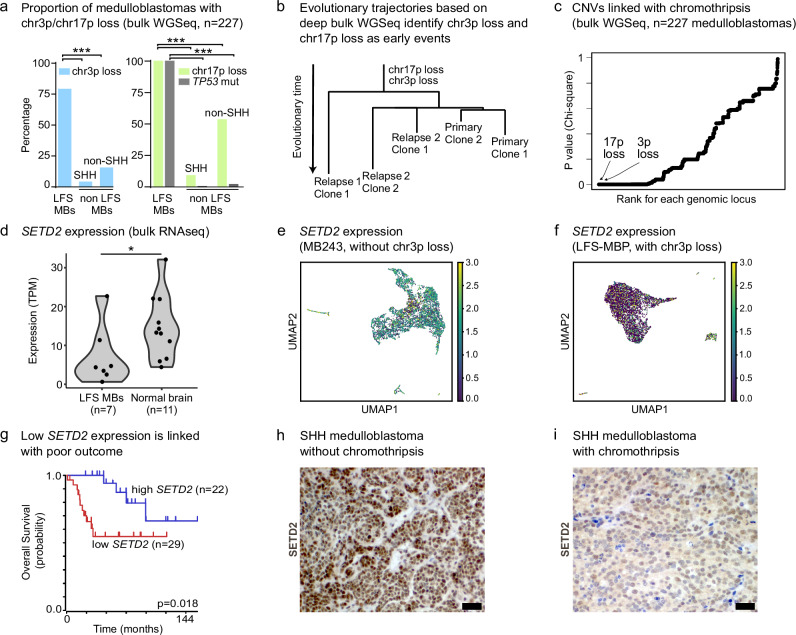
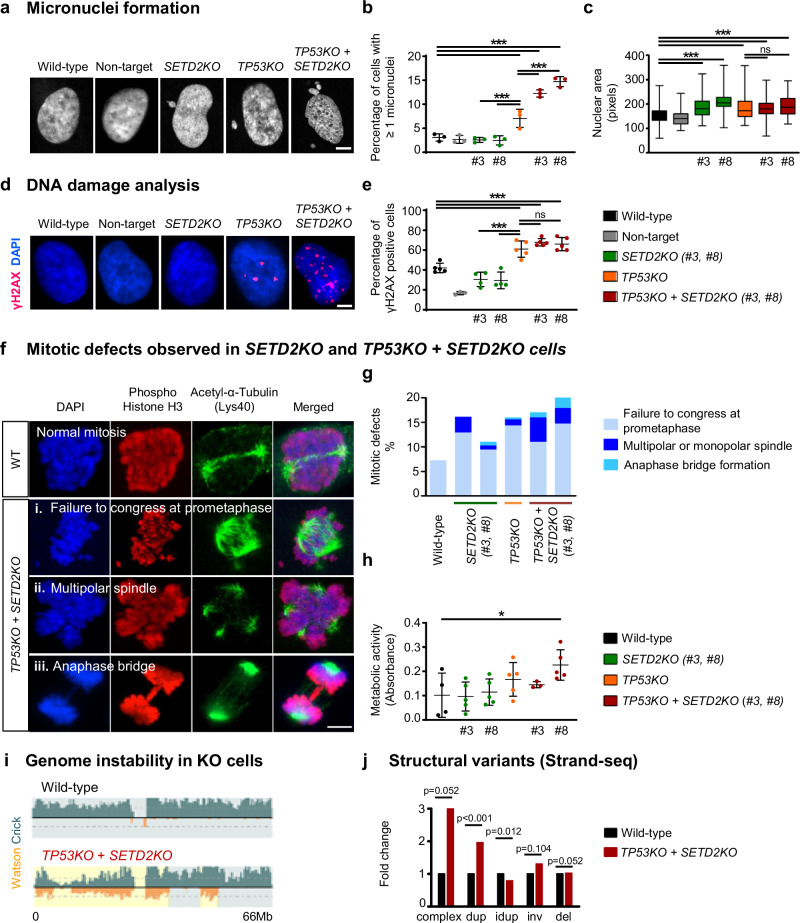
Chromothripsis is a frequent form of genome instability, whereby a presumably single catastrophic event generates extensive genomic rearrangements of one or multiple chromosome(s). However, little is known about the heterogeneity of chromothripsis across different clones from the same tumour, as well as changes in response to treatment. Here we analyse single-cell genomic and transcriptomic alterations linked with chromothripsis in human p53-deficient medulloblastoma and neural stem cells (n = 9). We reconstruct the order of somatic events, identify early alterations likely linked to chromothripsis and depict the contribution of chromothripsis to malignancy. We characterise subclonal variation of chromothripsis and its effects on extrachromosomal circular DNA, cancer drivers and putatively druggable targets. Furthermore, we highlight the causative role and the fitness consequences of specific rearrangements in neural progenitors.


Conflict of interest statement

Competing interests: The authors declare no competing interests.

Figures

Fig. 1
Fig. 1. Overview of the samples and workflow of this study.
Left, overview of the biological samples that were analyzed and of the methods that were applied. Right, overview of the data analysis workflow.
Fig. 2
Fig. 2. Genetic heterogeneity in medulloblastomas with chromothripsis.
Throughout, clonal, subclonal or low confidence (<50% of bootstrap samples CT positive) CT events are coloured dark pink, light pink or grey respectively, and clonal and subclonal CNVs are coloured dark and light green respectively. a Copy number profiles and clonal substructure estimated using bulk WGS and scDNA-seq (LFS-MBP, primary tumour, n = 268 nuclei). From top to bottom: somatic copy number profiles from bulk DNA-seq (Bulk), with diamonds indicating chromosomes with evidence for chromothripsis (CT; estimated using ShatterSeek, see “Methods”); pseudobulk CNV profiles of 4 genetic clones (excluding a clone composed of normal cells) identified by hierarchical clustering of cell-level CNV profiles estimated from scDNA-seq. Barplots denote the fraction of bootstrap samples (B = 101) scored as CT positive (“Methods”) below; the location and width of the bar correspond to the region overlapping CT positive windows (50 Mb windows evaluated at 20 kb resolution); a summary of the copy number alteration or CT status and clonality for each genomic region across clones. Right: Per-cell profiles for Clones 1 and 3, with a region of clonal CT on chromosome 7 highlighted for Clone 1, and region of subclonal CT on chromosome 14 highlighted for Clone 3. b Summary of the clonal structure identified in each scDNA-seq sample (n = 188 LFS-MBP PDX; n = 32 LFS-MB1R Nuclei; n = 38 LFS-MB1R PDX; n = 41 MB243 Nuclei; n = 27 RCMB18 PDX). Circles correspond to identified clones with the area of the circle proportional to the fraction of cells/nuclei assigned to this clone within each sample (“Methods”). Colour and numbering of clones is arbitrary, except clones identified as composed of normal cells coloured pink across samples. LFS-MBP PDX was derived from the tumour LFS-MBP (Nuclei); LFS-MB1R Nuclei and PDX are the matched relapse samples. c Genomic regions coloured by the presence of clonal or subclonal copy number alterations (from median sample ploidy; “Methods”) across 6 samples with scDNA-seq. Regions of clonal, subclonal, or low confidence (grey) CT highlighted. Stacked bar plots on the right indicate the percentage of the genome altered by each of the 5 types of copy number alterations for each sample. d Percentage of individual CNV segments classified as clonal or subclonal CT associated, or clonal and subclonal non-CT associated. e Number of CNV segments with subclonal copy number changes that overlap with regions identified as CT versus segments outside CT regions. Source data are provided as a Source Data file.
Fig. 3
Fig. 3. Chromothripsis is a major event for the formation of ecDNAs.
a Copy number plots for ecDNA carrying the GLI2 oncogene (whole-genome view and zoom on chromosome 2) generated by a CT event detected in the MB243-Nuclei sample (shown in panels af). b Structure of the ecDNA carrying GLI2 confirmed by bulk WGS assembly (derived using AmpliconArchitect; “Methods”). Blue rectangles show genomic segments. Arrows denote the orientation of a segment from lower to higher coordinates. c scDNA-seq of tumour nuclei shows high copy-numbers of the segments included in the ecDNA (the number of copies of the GLI2 locus located on the ecDNAs is used as a proxy for the number of ecDNA copies). Most tumour cells carry 10 to 40 copies of the ecDNA, with more than 100 copies per cell in extreme cases. Scale bar, 5 µm. d Relationship between CT on chromosome 2 (using the number of CNV segments on Chr. 2 per cell as a proxy for chromothripsis) and the number of copies of ecDNAs. Subsets of tumour cells carry both the CT chromosome and ecDNAs while other cells keep the ecDNA but may have lost the CT chromosome. e Number of copies of ecDNAs per clone (using the number of copies of GLI2 as a proxy). Significance is displayed from Bonferroni adjusted p values. f Tumour cells with ecDNAs including GLI2 show a high expression of this oncogene (left, sample MB243-Nuclei; right, GLI2 expression in sample LFS-MBP-Nuclei for comparison with a sample without ecDNA including GLI2). g FISH validation of ecDNAs carrying GLI2 likely generated by CT on chromosome 2 (BT084-PDX sample). In addition to the GLI2 probe (red), we used a multicolour probe for chromosome 2. Scale bar, 10 µm. h Sonic Hedgehog medulloblastomas with ecDNAs have a significantly higher CT prevalence (n = 46; two-sided Fisher exact test). i CT is significantly linked with the presence of ecDNAs across nine tumour types (colon cancer, haematological malignancies, prostate cancer, breast cancer, ovarian cancer, melanoma, renal cancer, lung cancer and glioblastoma, two-sided pearson correlation test shown, reanalysis from,). R, Pearson correlation coefficient. Source data are provided as a Source Data file.
Fig. 4
Fig. 4. Large-scale genomic alterations drive transcriptional heterogeneity in medulloblastoma with chromothripsis.
a Overview of the experimental procedure to generate the single-cell and -nuclei RNA-seq data for the 7 samples in this study. Top: single-nuclei RNA-sequencing (blue, tumours). Bottom: single-cell RNA-sequencing (green, PDX). UMAP embedding for tumour samples (n = 3), profiled using single-nuclei RNA-seq (left, 15,259 cells) and PDX (n = 4) profiled using single-cell RNA-seq (right, 7241 cells). Cell types annotated using literature-derived marker genes indicated in distinct colours. The Macro cell type contains both macrophage and microglia cells. Malignant cell types highlighted in purple; non-malignant cell types shown in black font. b, c Stacked bar plots, displaying the relative prevalence of individual cell types across samples, for tumours (b) and PDX models (c). Colours highlight distinct sample contributions. d, e Dotplot displaying the expression level and prevalence of marker genes (x-axis) across the cell populations identified (y-axis) as shown in (a, b). Dot size denotes the fraction of cells expressing the respective marker gene; dot colour depicts the relative expression level. f Results from the clone alignment of scDNA- and scRNA-seq profiles for LFS-MBP PDX. Top: Heatmap displaying the copy number profiles derived from scDNA, with colour corresponding to copy number (scale [0,8]; larger values clipped). Bottom: Heatmap showing relative CNV profiles estimated using inferCNV, with colour corresponding to modified expression (scale centred at 1; diploid state). Colour bar on the right side indicates uncertainty measures for the assignment of copy number clones (see “Methods”). g UMAP embedding depicting 3629 cells from scRNA-seq after QC for LFS-MBP PDX. Cells are coloured according to their assigned cell type identity (top) or clone from scDNA (bottom). Phenotypically normal cells as well as cells that did not meet the assignment confidence were excluded and are marked as unassigned or normal cells. h Pie charts showing the fraction of druggable targets affected by distinct genomic alterations as highlighted in Fig. 1 across all aligned samples. i Boxplots showing the copy number status (top; normalised read counts multiplied by cell ploidy) and expression (bottom; ln[CP10K + 1] values) of DLL3 and HDAC3, as examples of druggable targets, in clones from scDNA- and scRNA-seq for LFS-MBP PDX. Clone1 and Clone2 have been merged because their genomic profiles are too close to distinguish them accurately based on scRNA-seq (see “Methods”). Each point corresponds to a single cell, with corresponding cell numbers in each clone in Supplementary Data 7. Tukey boxplots are displayed, centred at the median, with hinges at 25th and 75th percentile, and whiskers extending to 1.5 the IQR. All outliers are plotted as individual points. Source data are provided as a Source Data file.
Fig. 5
Fig. 5. Combining single-nuclei DNA-seq and bulk whole-genome sequencing identifies early events potentially facilitating chromothripsis.
a Proportion of medulloblastomas with chromosome 3p or 17p loss among tumours with CT (LFS medulloblastomas) and non-LFS medulloblastomas (n = 227). Two-sided Fisher exact tests were performed to compare the proportions of tumours with 3p or 17p loss between LFS medulloblastomas and non-LFS medulloblastomas (p < 0.00001). b Evolutionary trajectories based on deep WGSeq identify 17p loss and 3p loss as early events (longitudinal analysis of three matched tumour samples). c 17p loss and 3p loss are significantly linked with CT in medulloblastoma (bulk WGS, n = 227 medulloblastomas). d Loss of 3p leads to decreased SETD2 expression (bulk RNA-seq, n = 18, p = 0.0348). Statistical significance was tested using one-tailed t-test. e, f Loss of 3p leads to decreased SETD2 expression (scRNA-seq). g Low SETD2 expression is linked with poor survival in medulloblastoma (SHH alpha subtype, n = 53, enriched for p53-SHH medulloblastomas, log-rank test, Kaplan-Meier plot generated using the R2 database, see “Methods”). h, i Representative examples of medulloblastomas with or without CT showing low or high SETD2 protein expression, respectively. Immunohistochemistry analysis was performed in eight patient samples showing similar results (n = 4 medulloblastomas with CT; n = 4 medulloblastomas without CT). Scale bar, 50 µm. Source data are provided as a Source Data file.
Fig. 6
Fig. 6. Inactivation of SETD2 and TP53 in neural stem cells leads to genome instability.
a Inactivation of SETD2 in a p53 deficient background leads to the formation of micronuclei, aberrant nuclear structures linked with genome instability. Representative images based on three independent experiments are shown. Scale bar, 5 µm. b Quantification of micronuclei (n = three biological replicates; mean ± SD; p < 0.0001). c Inactivation of SETD2 leads to a larger nuclear area (n = three biological replicates; p < 0.0001). The bounds of the box represent the interquartile range (25th–75th percentile), the central line marks the median, and the whiskers extend to the minimum and maximum values. d, e Inactivation of SETD2 in a p53 deficient background leads to high levels of DNA double-strand breaks. Immunofluorescence analysis of γH2AX foci and quantification of γH2AX positive cells (Wild-type, n = five biological replicates; Non-target, n = three biological replicates; SETD2KO (#3, #8), n = four biological replicates; TP53KO, n = five biological replicates; TP53KO + SETD2KO (#3, #8), n = five biological replicates; mean ± SD; p < 0.0001). Scale bar, 5 µm. f, g Inactivation of SETD2 in a p53 deficient background leads to mitotic defects, as shown by immunofluorescence analysis of Phospho Histone H3 and Acetyl-α-Tubulin. Scale bar, 5 µm. h Inactivation of SETD2 in a p53 deficient background leads to increased proliferation rate. Metabolic activity results, indicating proliferation rate, are shown as absorbance values measured by MTT assay (Wild-type, n = four biological replicates; SETD2KO (#3, #8), n = five biological replicates; TP53KO, n = five biological replicates; TP53KO + SETD2KO (#3), n = three biological replicates; TP53KO + SETD2KO (#8), n = five biological replicates; mean ± SD; p = 0.0392). i, j Strand-seq analysis of wild-type and knock-out cells. Quantification of structural variants was performed with MosaiCatcher. Beta regression and Bonferroni–Holm method for multiple comparisons were used to test for statistical significance in b, e. One-way ANOVA and Bonferroni multiple comparison tests were used to test for statistical significance in c, h. Wald test on the inactivation status explaining counts of observed events in a negative binomial GLM (inactivation status and intercept) fit for each event type independently was used to assess significance in (j). Two sided p values are reported in (b, e, j). Source data are available as a Source Data file.

References

    1. Stephens, P. J. Massive genomic rearrangement acquired in a single catastrophic event during cancer development. Cell144, 27–40 (2011). - PMC - PubMed
    1. Rausch, T. Genome sequencing of pediatric medulloblastoma links catastrophic DNA rearrangements with TP53 mutations. Cell148, 59–71 (2012). - PMC - PubMed
    1. Cortés-Ciriano, I. Comprehensive analysis of chromothripsis in 2658 human cancers using whole-genome sequencing. Nat. Genet.52, 331–341 (2020). - PMC - PubMed
    1. Voronina, N. The landscape of chromothripsis across adult cancer types. Nat. Commun.11, 2320 (2020). - PMC - PubMed
    1. Kloosterman, W. P., Koster, J. & Molenaar, J. J. Prevalence and clinical implications of chromothripsis in cancer genomes. Curr. Opin. Oncol.26, 64–72 (2014). - PubMed

Publication types

Substances

Associated data

LinkOut - more resources