. 2024 Nov 23;7(1):1561.
doi: 10.1038/s42003-024-07273-4.

Modeling early phenotypes of Parkinson's disease by age-induced midbrain-striatum assembloids

Affiliations

Modeling early phenotypes of Parkinson's disease by age-induced midbrain-striatum assembloids

Kyriaki Barmpa et al. Commun Biol. .

Abstract

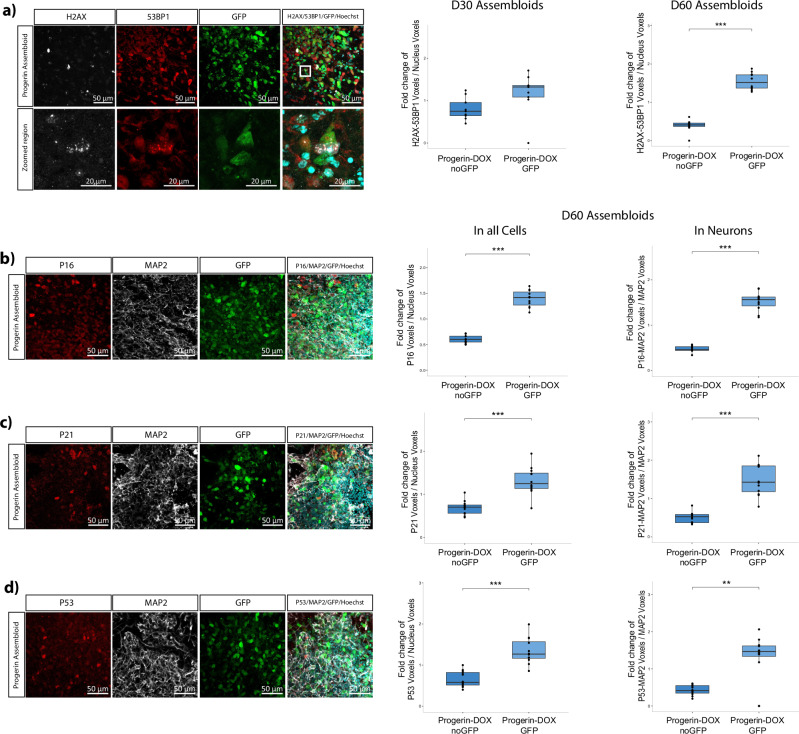
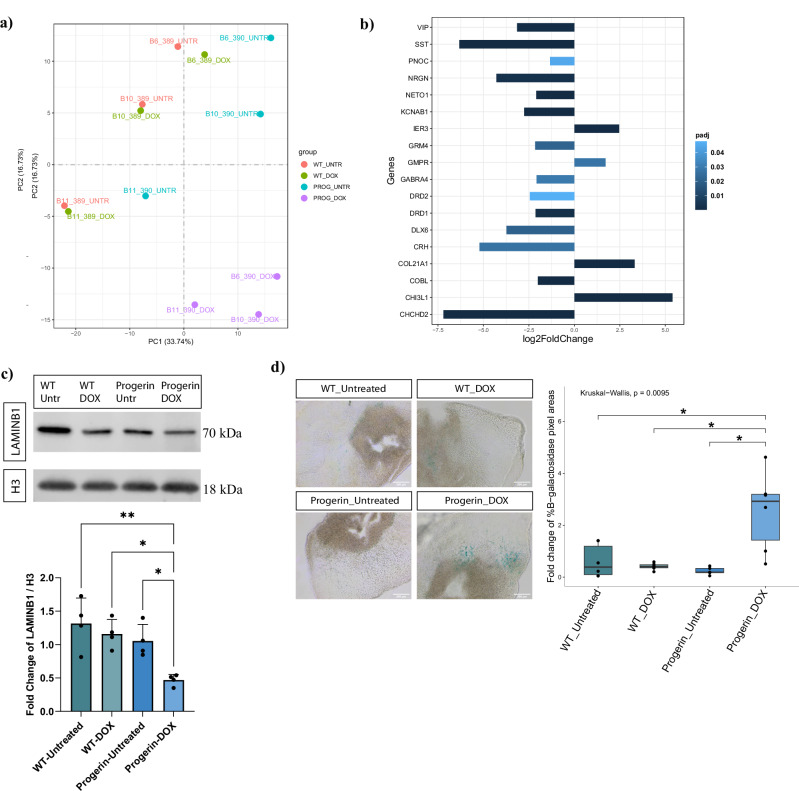
Parkinson's disease, an aging-associated neurodegenerative disorder, is characterised by nigrostriatal pathway dysfunction caused by the gradual loss of dopaminergic neurons in the substantia nigra pars compacta of the midbrain. Human in vitro models are enabling the study of the dopaminergic neurons' loss, but not the dysregulation within the dopaminergic network in the nigrostriatal pathway. Additionally, these models do not incorporate aging characteristics which potentially contribute to the development of Parkinson's disease. Here we present a nigrostriatal pathway model based on midbrain-striatum assembloids with inducible aging. We show that these assembloids can develop characteristics of the nigrostriatal connectivity, with catecholamine release from the midbrain to the striatum and synapse formation between midbrain and striatal neurons. Moreover, Progerin-overexpressing assembloids acquire aging traits that lead to early neurodegenerative phenotypes. This model shall help to reveal the contribution of aging as well as nigrostriatal connectivity to the onset and progression of Parkinson's disease.


Conflict of interest statement

Competing interests: J.C.S. is a co-inventor on a patent covering the generation of the here-described midbrain organoids (WO2017060884A1). Furthermore, J.C.S. is a co-founder and shareholder of the company OrganoTherapeutics which makes use of midbrain organoid technology. The other authors declare no competing interests. Ethical approval: Ethics Review Panel (ERP) of the University of Luxembourg and the national Luxembourgish research ethics committee (CNER, Comité National d’Ethique de Recherche) have approved the work with induced pluripotent stem cells (iPSCs). CNER No. 201901/01; ivPD.

Figures

Fig. 1
Fig. 1. Generation of midbrain-striatum assembloid model with identity specificity.
a Schematic representation of the assembloid model generation. b Representative confocal image of a 70 μm assembloid section immunostained with Hoechst, FOXA2 visible in the MO side and CTIP2 visible in the StrO side of the assembloid. GFP fluorescence is intrinsic in the midbrain part of the assembloids. c Representative confocal image of a 70 μm assembloid section immunostained with Hoechst and ASCL1 visible in the StrO side of the assembloid. GFP fluorescence is intrinsic in the MO part of the assembloids. d Representative confocal image of a 70 μm assembloid section immunostained with Hoechst and CORIN visible in the MO side of the assembloid. GFP fluorescence is intrinsic in the midbrain part of the assembloids. e Representative confocal image of a 70 μm assembloid section immunostained with Hoechst and TH visible in the MO side of the assembloid. GFP fluorescence is intrinsic in the midbrain part of the assembloids. f Representative confocal image of a 70 μm assembloid section immunostained with Hoechst and DARPP32 visible in the StrO side of the assembloid. GFP fluorescence is intrinsic in the midbrain part of the assembloids. g Representative brightfield image of an assembloid in a well of the 48-well MEA plate. Plots showing the quantification of the Number of Spikes, Inter-spike Interval in seconds and the Burst Frequency in Hz between assembloids generated from two independent human WT cell lines. The data in the plots represent recordings of individual assembloids for the culture periods D32 to D43, from 3 to 4 batches. Batch correction was applied by normalising each value to the mean of the values for each batch. Outliers were calculated in GraphPad Prism using the ROUT method Q 1%. Two-sided Wilcoxon test was performed in R 4.2.2.
Fig. 2
Fig. 2. Single nuclei RNA sequencing analysis in the assembloid model.
a UMAP embedding of the different cellular clusters in assembloids. b Percentage of the cellular composition in the assembloid model. c Unsupervised hierarchical clustering of cell clusters, using the average expression with Z-score normalisation of the top 500 most variable genes. d Spearman’s correlation between the different cell types in assembloids. e Enriched pathways identified by Metacore using the DEGs between assembloid and MO, and between assembloid and StrO, after integration of the three datasets with the Seurat workflow. f Plot showing the number of genes that were identified in the enrichment of the “Developmental Neurogenesis and Axonal guidance” pathway in both comparisons Assembloid vs MO and Assembloid vs StrO. g Barplot showing the upregulation of neuronal maturity related genes in both DEG lists, of Assembloid vs MO and Assembloid vs StrO.
Fig. 3
Fig. 3. Midbrain-Striatum assembloids develop nigrostriatal pathway connectivity.
a Representative microscopic images of a whole assembloid (4× objective) and of ROI, observed with fluorescence microscopy (25× objective). The assembloid was immunostained with Hoechst and TH. The ROI (right panel) shows the GFP+/TH+ neuron’s soma in the MO-GFP side of the assembloid with TH+ projection towards the striatum side in the different planes along the Z stack (Z.190–280). White arrowheads show the progression of the TH+ projection in images from the different planes. 3D reconstruction of the neuron across the planes shows the complete TH+ neuronal projection. b Bar pot showing the electrochemical measurements in tissue in StrOs and in the StrO side of the assembloid model at D30. Welch’s t-test was performed, StOs n = 8, StrOs in assembloid n = 9, where n is the average measurements in one organoid or assembloid, for three batches, generated from the same line (390, see Supplementary Table 1). Error bars represent mean ± SD. Data were plotted in GraphPad Prism 9.0.0. *p < 0.05, **p < 0.01, ***p < 0.001. c Schematic representation of the Rabies monosynaptic tracing experiments in midbrain-striatum assembloids. d Representative confocal image of 70 μm assembloid section showing the GFP and RFP positive cells from the LV-GP-TVA-GFP and RBV-ΔG-EnvA-RFP infections respectively. The GFP signal in the StrO side of the assembloid is coming from the LV-GP-TVA-GFP infection, while GFP fluorescence in the MO side of the assembloid is cell intrinsic. White arrowheads indicate the RFP positive signal in the MO side, and the RFP/GFP positive signal in the StrO side of the assembloid. e Representative confocal images of 70 μm assembloids sections showing the MO sides of the assembloids with GFP and RFP positive cells from the cell intrinsic GFP expression and RBV-ΔG-EnvA-RFP infections respectively and immunostained with Hoechst and TH. Zoomed in regions (indicated by the white squares) show the TH+/RFP+ colocalization in the midbrain side of the assembloids.
Fig. 4
Fig. 4. Midbrain-Striatum assembloids develop electrical connectivity and directionality.
a Bright field image of MO and StrO cultured onto an 8 × 8 electrode MEA chip. Individual electrode location is identified by line and column numbered between 1 and 8. The microfluidic system laying on top of the MEA is schematized in the lateral inset. b Raster plot of individual spike events detected during a representative 3 min recording for each active electrode. c Given two electrodes (e1 and e2), the Spike Time Tiling Coefficient (STTC) is calculated as the probability to detect at least one spike (red coloured) in e2 within a temporal window (Δt) centered around a given spike in e1. d Cross-correlograms of three pairs of electrodes (A-B, C-D, E-F) of a selected assembloid. When significant, the cross-correlogram maximum can be interpreted as the (most probable) time delay t required by the signal to propagate between the two electrodes. The signal speed V can be estimated as the ratio of the distance r between the two electrodes and the time delay t. e The mean signal directionality for a given electrode can be expressed as a vector. In this representative experiment, only electrode vectors (black arrows) having STCC higher than 0.8 are shown, together with the mean firing rate (in Hz) for the whole MEA. f Eleven assembloids (92%) were found to form a stable connection between MO and StrO within 40 days in vitro (D40). Four assembloids (33%) formed connections already by D4. g The mean electrical signal directionality of the assembloid can be computed as a vector with vertical (y) and lateral (x) components. In the 12 assembloids analyzed at different maturation stages, the positive sign of the mean vertical component (± standard deviation, STD) indicates that the electrical signal travels more from the MO to the StrO than the opposite direction. Statistical analysis was performed by Kruskal–Wallis post hoc analysis between all groups ** p < 0.01. h The mean lateral directionality (calculated as the absolute value of x ± STD) yielded a significant increase during the assembloid maturation (*** p < 0.001).
Fig. 5
Fig. 5. Progerin-overexpressing cells with aging characteristics in the assembloid model.
a Immunofluorescence staining quantification of the H2AX and 53BP1 positive nuclear foci voxels normalised to the total nucleus voxels in 70 μm Progerin-overexpressing assembloid sections from D30 and D60 cultures. For D30 data, Welch’s t-test was performed with n = 9 for both conditions where each point represents one section per assembloid per batch for 3 batches. For D60 data two-sided Wilcoxon test was performed with n = 12 for both conditions where each point represents one section per assembloid per batch for 4 batches. *p < 0.05, **p < 0.01, ***p < 0.001. b Immunofluorescence staining quantification of the P16 voxels normalised to the total nucleus voxels, and P16 and MAP2 double positive voxels normalised to the total MAP2 voxels in 70 μm Progerin-overexpressing assembloid sections from D60 cultures. Two-sided Wilcoxon test for both plots was performed, with n = 11 where each point represents one section per assembloid per batch for 4 batches. *p < 0.05, **p < 0.01, ***p < 0.001. c Immunofluorescence staining quantification of the P21 voxels normalised to the total nucleus voxels, and P21 and MAP2 double positive voxels normalised to the total MAP2 voxels in 70 μm Progerin-overexpressing assembloid sections from D60 cultures. Welch’s t-test and two-sided Wilcoxon test was performed respectively, with n = 12 for both conditions where each point represents one section per assembloid per batch for 4 batches. *p < 0.05, **p < 0.01, ***p < 0.001. d Immunofluorescence staining quantification of the P53 voxels normalised to the total nucleus voxels, and P53 and MAP2 double positive voxels normalised to the total MAP2 voxels in 70 μm Progerin-overexpressing assembloid sections from D60 cultures. Welch’s t-test and two-sided Wilcoxon test was performed respectively, with n = 12 for both conditions where each point represents one section per assembloid per batch for 4 batches. *p < 0.05, **p < 0.01, ***p < 0.001. In all plots batch correction was applied by normalising each value to the mean of the values for each batch. Outlier removal was performed based on the Inter-Quartile Range (IQR) proximity rule. Data were plotted in R 4.2.2.
Fig. 6
Fig. 6. Evident aging phenotype in the Progerin-overexpressing assembloid model.
a PCA plot of the two first principal components on the gene expression value (FPKM) of all samples. Each sample represents data from 4 pooled assembloids from one batch. b Plot showing the log2 fold change of significant differentially expressed genes between Progerin-overexpressing assembloids (PROG_DOX) and control (WT_UNTR, WT_DOX, PROG_UNTR) samples. This list of genes was extracted after the comparison of the assembloid data with post mortem human brain data,. c Western blot showing the protein levels of LAMIN B1 normalised to H3 housekeeping protein and batch corrected by normalising to the mean of the values for each batch. Outliers were calculated in GraphPad Prism using the ROUT method Q 1%. One-way ANOVA, with Tukey’s multiple comparison test was performed. For all conditions n = 4 with each point representing 3–4 pooled assembloids per batch, for 4 batches. Error bars represent mean ± SD. Data were plotted in GraphPad Prism 9.0.0. *p < 0.05, **p < 0.01, ***p < 0.001. d β-galactosidase staining for all the different assembloid conditions. Positive β-galactosidase areas were measured with ImageJ and normalised to the area of the section in each image and batch corrected by normalising to the mean of the values for each batch. Kruskal–Wallis test with Benjamini–Hochberg correction and Dunn’s multiple comparison test was performed. For all conditions n = 6 with each point representing one section per assembloid, per batch, for 3 batches. *p < 0.05, **p < 0.01, ***p < 0.001. Batch correction was applied by normalising each value to the mean of the values for each batch. Outlier removal was performed based on the Inter-Quartile Range (IQR) proximity rule. Data were plotted in R 4.2.2.
Fig. 7
Fig. 7. Early neurodegeneration phenotypes in Progerin-overexpressing assembloids.
a Bar blot showing the electrochemical measurements in the StrO side of assembloids from the different conditions at D60. One-way ANOVA with Tukey’s multiple comparison test was performed. For all conditions n = the mean of measurements from 5 different positions in 3–4 assembloids per batch for 3 batches (WT_Untreated n = 11, WT_DOX n = 10, Progerin_Untreated n = 11, Progerin_DOX n = 9). Error bars represent mean ± SD. b KEGG and GO pathway enrichment analysis of the DEGs between PROG-DOX and PROG_UNTR samples. c Western blot for the protein levels of VAMP2 normalised to β-Actin. d Western blot for the protein levels of Synaptotagmin1 (SYN) normalised to β-Actin. e Western blot for the protein levels of Gephyrin normalised to β-Actin. f Western blot for the protein levels of TH normalised to β-Actin. g Representative confocal image of the MO side of a 70 μm Progerin-overexpressing assembloid section with TH and Hoechst immunostaining. The white square indicates the zoomed in region showing a representative image of a fragmented TH+ neurite. h Plot showing the TH fragmentation index as quantified by our neuronal skeleton quantification approach with MATLAB. Welch’s t-test was performed with n = 8 for each condition, where each point represents the average of 3–5 sections per assembloid per batch, for 4 batches. In all plots batch correction was applied by normalising each value to the mean of the values for each batch. *p < 0.05, **p < 0.01, ***p < 0.001. For (cf) plots, Welch’s t-test was performed in each plot with n = 7 for each condition, where each point represents 3–4 pooled assembloid per batch, for 7 batches. Outliers were calculated in GraphPad Prism 9.0.0 using the ROUT method Q 1%. Error bars represent mean ± SD. For plot h, data were plotted in R 4.2.2 and outlier removal was performed based on the Inter-Quartile Range (IQR) proximity rule.

References

    1. Caminiti, S. P. et al. Axonal damage and loss of connectivity in nigrostriatal and mesolimbic dopamine pathways in early Parkinson’s disease. NeuroImage Clin.14, 734–740 (2017). - PMC - PubMed
    1. Zhai, S., Tanimura, A., Graves, S. M., Shen, W. & Surmeier, D. J. Striatal synapses, circuits, and Parkinson’s disease. Curr. Opin. Neurobiol.48, 9–16 (2018). - PMC - PubMed
    1. Li, L. H. et al. Axonal degeneration of nigra-striatum dopaminergic neurons induced by 1-methyl-4-phenyl-1,2,3,6-tetrahydropyridine in mice. J. Int. Med. Res.37, 455–463 (2009). - PubMed
    1. Chung, S. J. et al. Patterns of striatal dopamine depletion in early Parkinson disease: prognostic relevance. Neurology95, E280–E290 (2020). - PubMed
    1. Tagliaferro, P. & Burke, R. E. Retrograde axonal degeneration in Parkinson disease. J. Parkinsons. Dis.6, 1–15 (2016). - PMC - PubMed