. 2025 Feb;39(2):323-336.
doi: 10.1038/s41375-024-02473-7. Epub 2024 Nov 24.

High CD44 expression and enhanced E-selectin binding identified as biomarkers of chemoresistant leukemic cells in human T-ALL

Affiliations

High CD44 expression and enhanced E-selectin binding identified as biomarkers of chemoresistant leukemic cells in human T-ALL

Julien Calvo et al. Leukemia. 2025 Feb.

Abstract

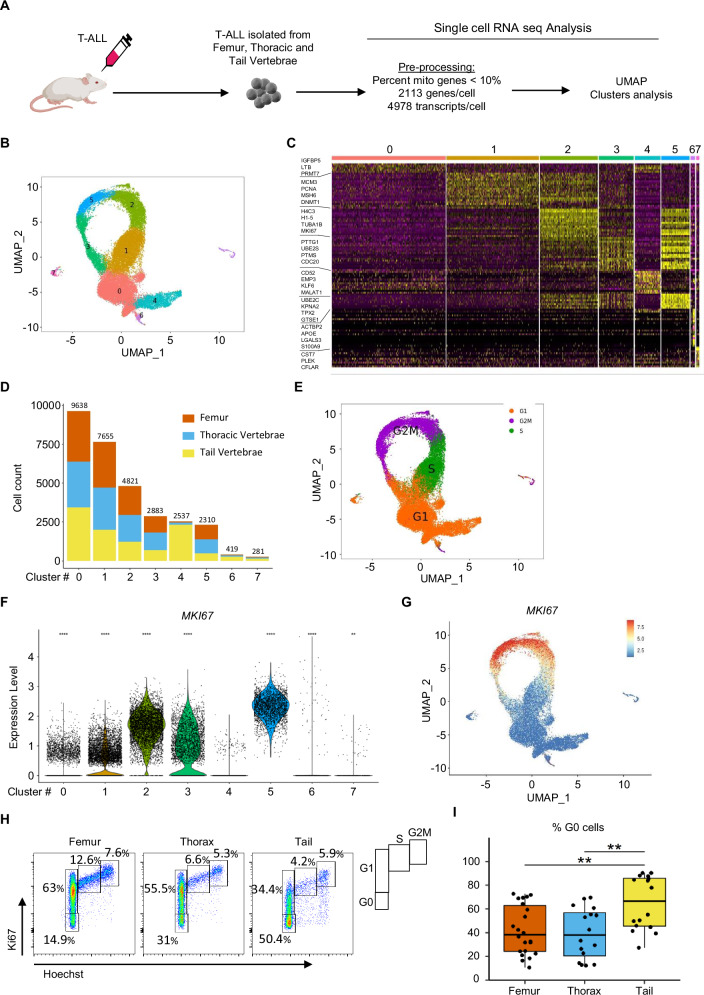
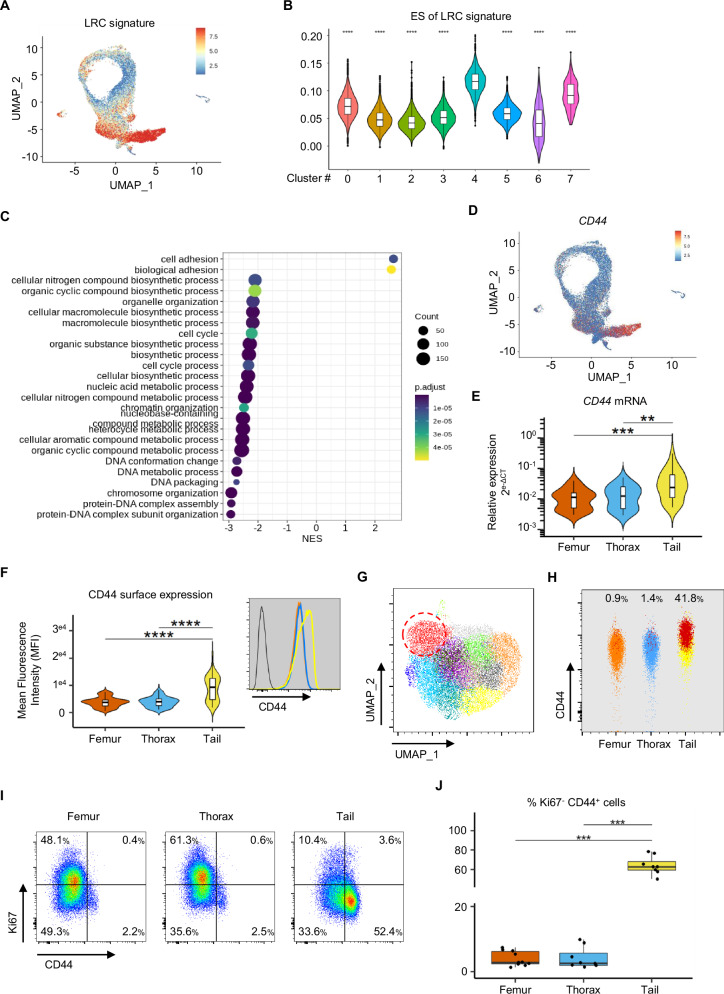
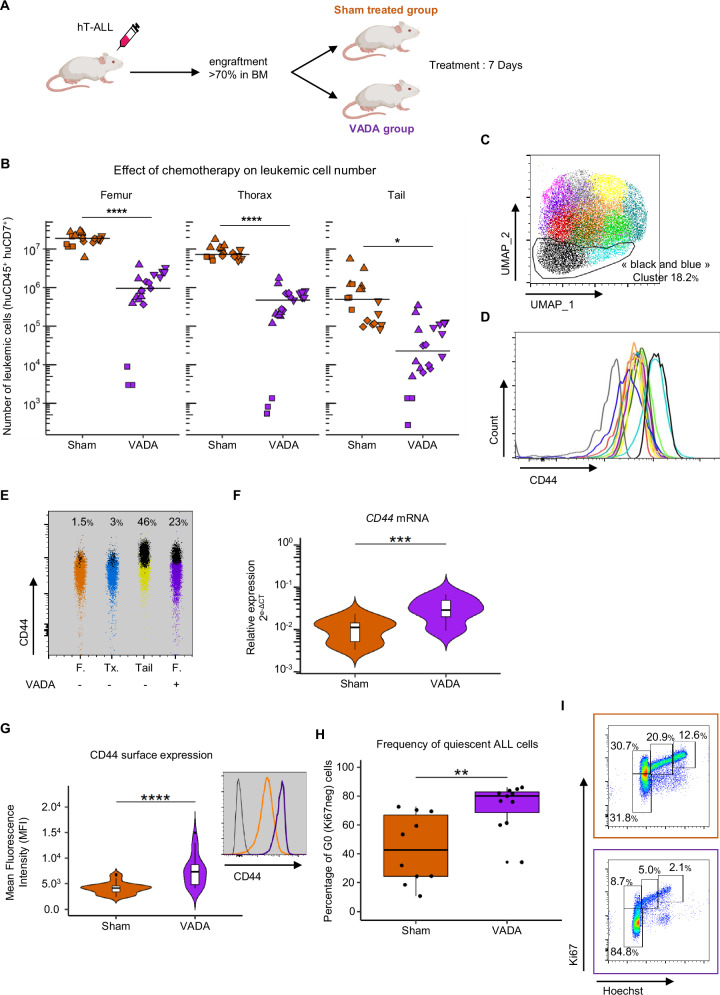
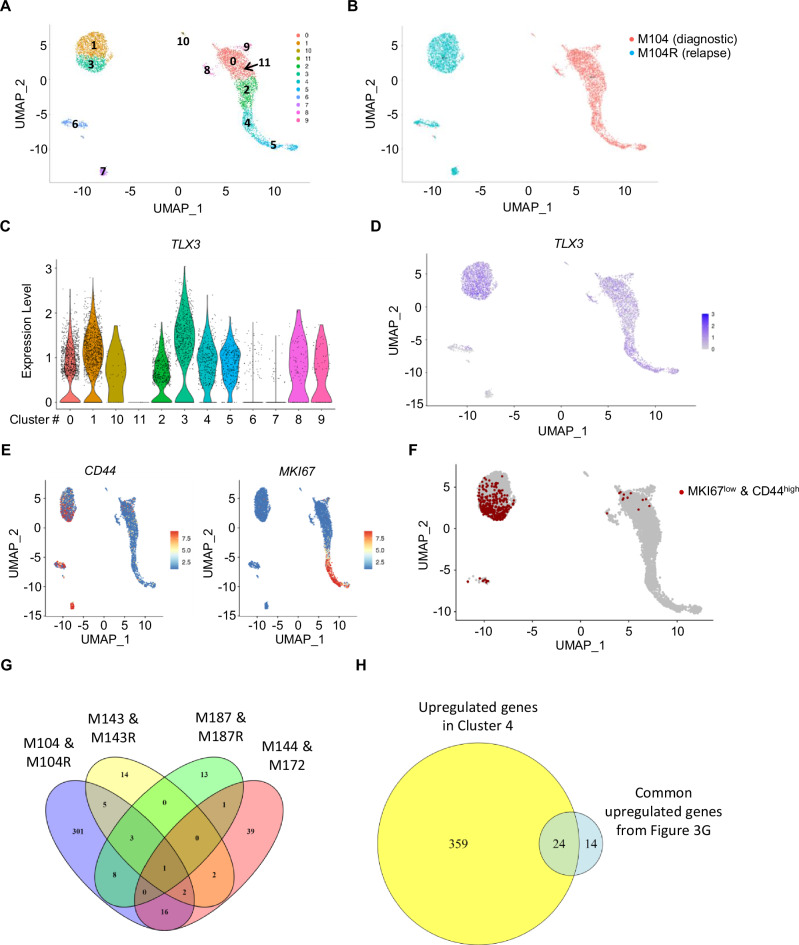
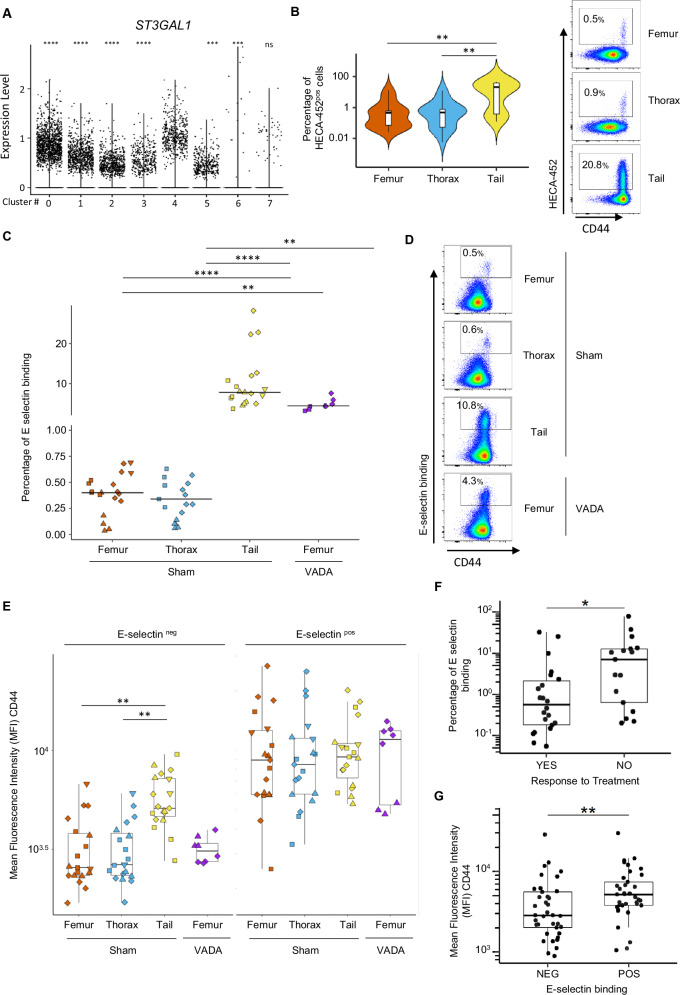
T-cell acute lymphoblastic leukemia (T-ALL) is a hematopoietic malignancy characterized by increased proliferation and incomplete maturation of T-cell progenitors, for which relapse is often of poor prognosis. To improve patient outcomes, it is critical to understand the chemoresistance mechanisms arising from cell plasticity induced by the bone marrow (BM) microenvironment. Single-cell RNA sequencing of human T-ALL cells from adipocyte-rich and adipocyte-poor BM revealed a distinct leukemic cell population defined by quiescence and high CD44 expression (Ki67neg/lowCD44high). During in vivo treatment, these cells evaded chemotherapy, and were further called Chemotherapy-resistant Leukemic Cells (CLCs). Patient sample analysis revealed Ki67neg/lowCD44high CLCs at diagnosis and during relapse, with each displaying a specific transcriptomic signature. Interestingly, CD44high expression in T-ALL Ki67neg/low CLCs was associated with E-selectin binding. Analysis of 39 human T-ALL samples revealed significantly enhanced E-selectin binding activity in relapse/refractory samples compared with drug-sensitive samples. These characteristics of chemoresistant T-ALL CLCs provide key insights for prognostic stratification and novel therapeutic options.


Conflict of interest statement

Competing interests: The authors declare no competing interests.

Figures

Fig. 1
Fig. 1. Characterization of leukemic cell diversity in adipocyte-rich/poor bone marrow.
A Schematic overview of the study. B Uniform Manifold Approximation and Projection (UMAP) visualization of color-coded clustering of 30,544 huT-ALL (M18) cells from the femur, thorax and tail vertebrae (4 mice). C Expression of the 20 top differentially expressed genes (rows) across the cells (columns) in each cluster using the DoHeatmap function. Colored bars correspond to the color-coded clustering (B). D Number of cells from the femur (orange), thorax (blue) and tail vertebrae (yellow) in each cluster. The data are presented in cumulative bar plots. E UMAP visualization of cell cycle progression using the CellCycleScoring function (detailed in the Methods). MKI67 expression analysis for each cluster represented by Violin Plot in which the points denote the values for each cell (F) and visualized on UMAP (G). Statistical significance was assessed using a Wilcoxon test for each cluster to the reference Cluster 4 (****p < 0.0001; **p < 0.01). H, I Cell cycle analysis by flow cytometry. Representative Ki67/Hoechst staining on human CD45+/CD7+ T-ALL M106 cells from the femur, thorax and tail (H). Frequency of quiescent (G0) huT-ALL cells from the femur (orange), thorax (blue) and tail vertebrae (yellow). The data are shown as box-and-whisker plots. Boxes indicate the 25th and 75th percentiles, whiskers display the range, and horizontal lines in each row represent the median. Four PDX models of huT-ALL were tested in 16–22 mice (I). Statistical significance was assessed by Kruskal-Wallis test followed by Dunn’s multiple comparisons test (**p < 0.01). The huT-ALL samples are described in Supplementary Table 1.
Fig. 2
Fig. 2. High expression of CD44 indicates quiescent/dormant T-ALL cells.
Enrichment analysis (detailed in the Methods) of the LRC signature published by Ebinger et al. in huT-ALL cells from adipocyte-rich/poor BM visualized on UMAP (A) and represented for each cluster (B). C Gene Set Enrichment Analysis (GSEA) performed with significantly upregulated genes from Cluster 4 involved in “Biological Process” (Gene Ontology annotation). The data are shown as a normalized enrichment score (NES), and significant processes were defined by false discovery rate <0.05 (colors indicate the p.adjust level). D CD44 expression analysis visualized on UMAP. E CD44 relative expression analysis performed by RT-qPCR with huT-ALL cells from femur (orange), thorax (blue) and tail vertebrae (yellow). PDX models of 15 huT-ALL samples (37 mice). F Mean fluorescence intensity (MFI) of CD44 expression assessed by flow cytometry on huT-ALL cells from femur (orange), thorax (blue) and tail vertebrae (yellow). PDX of 19 huT-ALL samples (67 mice). Flow cytometry analysis example obtained with M18-PDX, huT-ALL cells unstained (black line), femur (orange line), thorax (blue line) and tail (yellow line) (inset). G UMAP visualization of 21,600 huT-ALL (M18) cells from femur, thorax and tail vertebrae; the color-coded clustering according to FSC, SSC, CD7, CD45, CD4, CD8, CXCR4, CD44 and CD34 surface expression as assessed via flow cytometry. A red dashed line indicates the “red cluster”, which displays the highest CD44 expression levels. H The frequency of “red clusters” in each region. I, J Flow cytometry analysis of CD44 and Ki67 expression. Representative CD44/Ki67 staining of huT-ALL M106 cells from each region (I). Frequency of Ki67neg/lowCD44high huT-ALL cells from each region (J). EJ The data are shown as violin and/or box-and-whisker plots. Boxes indicate the 25th and 75th percentiles, whiskers indicate the range, and horizontal lines in each row represent the median. EJ Statistical significance was assessed by Kruskal–Wallis test followed by Dunn’s multiple comparisons test (**p < 0.01; ***p < 0.005). The huT-ALL samples are described in Supplementary Table 1.
Fig. 3
Fig. 3. In vivo chemotherapy model to characterize minimal Residual Disease (MRD).
A Schematic overview of the in vivo chemotherapy model. B Number of human CD45+/CD7+ T-ALL cells in each region after sham or VADA treatment. PDX of four huT-ALL samples (18 sham and 21 VADA mice). Square, rhombus, triangle and inverted triangle symbols represent M103, M69, M106 and M18 samples, respectively. C, D Cell heterogeneity evaluated by flow cytometry. UMAP visualization of 21,600 huT-ALL (M18) cells equally derived from femur, thorax and tail vertebrae of sham-treated mice mixed with 7,200 cells from the femurs of VADA-treated mice; PhenoGraph clustering is color-coded according to FSC, SSC, CD7, CD45, CD4, CD8, CXCR4, CD44 and CD34 surface expression (C). MFI of CD44 expression in huT-ALL (M18) from each cluster (D). E Frequency of “black & blue clusters” represented by black dots in the femur (orange), thorax (blue), tail (yellow) of sham-treated mice and the femur of VADA-treated mice (purple). F Relative expression of CD44 mRNA analyzed via RT-qPCR with purified hCD45+ huT-ALL cells from the femurs of sham-treated mice (orange) and VADA-treated mice (purple). PDX of four huT-ALL samples (19 sham and 12 VADA mice). G MFI of CD44 expression analyzed by flow cytometry on human CD45+/CD7+ T-ALL cells from the femurs of sham-treated mice (orange) and VADA-treated mice (purple). PDX from four huT-ALL samples (35 sham mice and 23 VADA mice). A flow cytometry example of M106-PDX, huT-ALL cells unstained (black), from the femur of sham-treated mice (orange) and VADA-treated mice (purple) (inset). H, I Quiescent analysis. Frequency of quiescent huT-ALL cells from the femurs of sham-treated mice (orange) and VADA-treated mice (purple). I Representative Ki67/Hoechst staining of huT-ALL (M69) cells from the femurs of sham-treated mice (orange) and VADA-treated mice (purple). PDX from two huT-ALL samples (10 sham mice and 12 VADA mice) (H). FH Data are shown as violin and/or box-and-whisker plots. Boxes indicate the 25th and 75th percentiles, whiskers indicate the range, and horizontal lines in each row represent the median. DF Statistical significance was assessed via Mann & Whitney test (**p < 0.01; ***p < 0.005; ****p < 0.001). The huT-ALL samples are described in Supplementary Table 1.
Fig. 4
Fig. 4. The Ki67neg/lowCD44high population is present in diagnosis and relapse huT-ALL samples.
AF Single-cell RNA sequencing of paired diagnosis (M104) and relapse (M104R) huT-ALL. UMAP color-coded clustering (A) and according to disease stage (diagnosis or relapse) (B). TLX3 expression levels (C) overlaid onto a UMAP (D). Expression levels of MKI67 and CD44 overlaid onto a UMAP (E). F MKI67neg/lowCD44high population (red dots) overlaid onto a UMAP of huT-ALL cells. G Venn diagram of significantly upregulated genes identified in MKI67neg/lowCD44high huT-ALL cell populations from four libraries (M104 & M104R; M143 & M143R; M187 & M187R; M144 & M172). Values indicate the number of genes. H Venn diagram of common upregulated genes identified in MKI67neg/lowCD44high in at least two libraries (38 genes) and significantly upregulated genes identified in Cluster 4 (Fig. 1). The hu T-ALL samples are described in Supplementary Table 1.
Fig. 5
Fig. 5. E-selectin binding is enhanced in CD44high populations.
A ST3GAL1 expression level per cell in each cluster from scRNAseq analysis. Data are shown as points denoting values for each cell. B The percentage of HECA-452-positive cells in human CD45+/CD7+ T-ALL cells from the femur (orange), thorax (blue) and tail vertebrae (yellow) assessed via flow cytometry. PDX of five huT-ALL samples (17 mice). Flow cytometry analysis of M106-PDX, huT-ALL cells unstained (black line), femur (orange line), thorax (blue line) and tail (yellow line) (inset). C The frequency of huT-ALL cells from the femur (orange), thorax (blue), tail (yellow) of sham-treated mice and the femur of VADA-treated mice (purple). D Representative E-selectin binding/CD44 staining of huT-ALL (M106) cells from the femur, thorax and tail of sham-treated mice and the femur of VADA-treated mice as analyzed via flow cytometry. E MFI of CD44 in huT-ALL cells from the femur (orange), thorax (blue) and tail (yellow) of sham-treated mice and the femur of VADA-treated mice (purple) with in vitro E-selectin binding and non-binding controls. PDX of four huT-ALL samples (27 mice) F The proportion of E-selectin-bound huT-ALL cells according to treatment response (“NO” vs “YES”). G MFI of CD44 expression in huT-ALL cells according to E-selectin binding status (“NEG” vs “POS”). EG The data are shown as box-and-whisker plots. The boxes indicate the 25th and 75th percentiles, whiskers indicate the range, and horizontal lines in each row represent the median. BD Statistical significance was assessed via Kruskal–Wallis test followed by Dunn’s multiple comparisons test (**p < 0.01; ****p < 0.001). F, G Statistical significance was assessed via Mann & Whitney test (**p < 0.01). The huT-ALL samples are described in Supplementary Table 1.

References

    1. Belver L, Ferrando A. The genetics and mechanisms of T cell acute lymphoblastic leukaemia. Nat Rev Cancer. 2016;16:494–507. - PubMed
    1. Girardi T, Vicente C, Cools J, De Keersmaecker K. The genetics and molecular biology of T-ALL. Blood. 2017;129:1113–23. - PMC - PubMed
    1. Vadillo E, Dorantes-Acosta E, Pelayo R, Schnoor M. T cell acute lymphoblastic leukemia (T-ALL): New insights into the cellular origins and infiltration mechanisms common and unique among hematologic malignancies. Blood Rev. 2018;32:36–51. - PubMed
    1. Agarwal P, Isringhausen S, Li H, Paterson AJ, He J, Gomariz Á, et al. Mesenchymal Niche-Specific Expression of Cxcl12 Controls Quiescence of Treatment-Resistant Leukemia Stem Cells. Cell Stem Cell. 2020;26:123. - PMC - PubMed
    1. Schelker RC, Iberl S, Müller G, Hart C, Herr W, Grassinger J. TGF-β1 and CXCL12 modulate proliferation and chemotherapy sensitivity of acute myeloid leukemia cells co-cultured with multipotent mesenchymal stromal cells. Hematology. 2018;23:337–45. - PubMed

MeSH terms