

A longitudinal study of hippocampal subfield volumes and hippocampal glutamate levels in antipsychotic-naïve first episode psychosis patients
- PMID: 39580605
- PMCID: PMC12014507
- DOI: 10.1038/s41380-024-02812-1
A longitudinal study of hippocampal subfield volumes and hippocampal glutamate levels in antipsychotic-naïve first episode psychosis patients
Abstract
Background: Previous studies have implicated hippocampal abnormalities in the neuropathology of psychosis spectrum disorders. Reduced hippocampal volume has been reported across all illness stages, and this atrophy has been hypothesized to be the result of glutamatergic excess. To test this hypothesis, we measured hippocampal subfield volumes and hippocampal glutamate levels in antipsychotic naïve first episode psychosis patients (FEP) and the progression of volume decline and changes in glutamate levels over a 16-week antipsychotic drug (APD) trial. We aimed to determine if subfield volumes at baseline were associated with glutamate levels, and if baseline glutamate levels were predictive of change in subfield volumes over time.
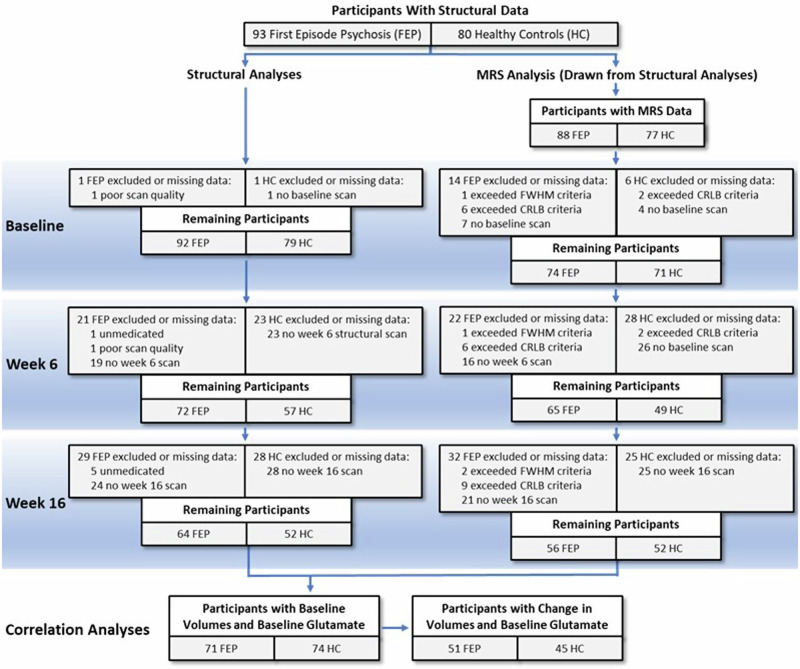
Methods: We enrolled ninety-three medication-naïve FEP participants and 80 matched healthy controls (HC). T1 and T2 weighted images and magnetic resonance spectroscopy (MRS) data from a voxel prescribed in the left hippocampus were collected from participants at baseline and after 6 and 16 weeks of APD treatment. Hippocampal subfield volumes were assessed using FreeSurfer 7.1.1., while glutamate levels were quantified using jMRUI version 6.0. Data were analyzed using linear mixed models.
Results: We found regional subfield volume deficits in the CA1, and presubiculum in FEP at baseline, that further expanded to include the molecular and granule cell layer of the dentate gyrus (GC/ML/DG) and CA4 by week 16. Baseline hippocampal glutamate levels in FEP were not significantly different than those of HC, and there was no effect of treatment on glutamate. Glutamate levels were not related to initial subfield volumes or volume changes over 16 weeks.
Conclusion: We report a progressive loss of hippocampal subfield volumes over a period of 16 weeks after initiation of treatment, suggestive of early progression in neuropathology. Our results do not suggest a role for glutamate as a driving factor. This study underscores the need to further research the mechanism(s) underlying this phenomenon as it has implications for early intervention to preserve cognitive decline in FEP participants.
© 2024. The Author(s).
Conflict of interest statement
Competing interests: The authors declare no competing interests. Ethics approval and consent to participate: Studies for grants R01MH102951, R01MH113800 (ACL) and K23MH106683 (NVK) were approved by the UAB Institutional Review Board (IRB) (IRB-120525002, IRB-300000959, IRB-150619007 respectively). All study methods were performed in accordance with UAB IRB guidelines and regulations. Written informed consent from all participants was obtained prior to enrollment and after participants were deemed to have capacity to provide consent.
Figures


References
-
- Nelson EA, Kraguljac NV, Maximo JO, Briend F, Armstrong W, Ver Hoef LW, et al. Hippocampal dysconnectivity and altered glutamatergic modulation of the default mode network: a combined resting-state connectivity and magnetic resonance spectroscopy study in schizophrenia. Biol Psychiatry Cogn Neurosci Neuroimaging. 2020;7:108–18. - PMC - PubMed
-
- Jorgensen KN, Nesvag R, Gunleiksrud S, Raballo A, Jonsson EG, Agartz I. First- and second-generation antipsychotic drug treatment and subcortical brain morphology in schizophrenia. Eur Arch Psychiatry Clin Neurosci. 2016;266:451–60. - PubMed
MeSH terms
Substances
Grants and funding
- UL1 TR003096/TR/NCATS NIH HHS/United States
- K23MH106683/U.S. Department of Health & Human Services | NIH | National Institute of Mental Health (NIMH)
- R01 MH113800/MH/NIMH NIH HHS/United States
- R01 MH118484/MH/NIMH NIH HHS/United States
- UL1TR003096/U.S. Department of Health & Human Services | NIH | National Center for Advancing Translational Sciences (NCATS)
LinkOut - more resources
Full Text Sources
Medical
Miscellaneous
