. 2024 Nov;28(22):e70226.
doi: 10.1111/jcmm.70226.

Role of m6A Methylation Regulators in the Diagnosis and Subtype Classification of COPD Based on the GEO Database

Affiliations

Role of m6A Methylation Regulators in the Diagnosis and Subtype Classification of COPD Based on the GEO Database

Pingan Zhang et al. J Cell Mol Med. 2024 Nov.

Abstract

N6-methyladenosine (m6A) is a prevalent mRNA modifier, yet its role in chronic obstructive pulmonary disease (COPD) remains unexplored. We sourced expression levels of m6A methylation regulators from the GSE76925 dataset. These regulators' differential expression (DEMs) predicted COPD risk via random forest and support vector machine models. Additionally, a nomogram model using DEMs estimated COPD prevalence. We employed consistent cluster analysis of m6A methylation regulators to categorise COPD samples into distinct subtypes. Analyses of immune cell infiltration in these subtypes and differential gene expression (DEGs) across m6A methylation subtypes were conducted. A cell model validated several m6A regulators and their associated pathways. Fifteen m6A methylation regulators showed differential expression and were used in random forest and support vector machine models. Eleven were selected for a nomogram model, which decision curve analysis suggested could benefit patients. Consensus cluster analysis divided the COPD samples into two subtypes: Cluster A and Cluster B. Cluster B was associated with neutrophil and eosinophil-dominated immunity, while Cluster A was linked with monocyte-dominated immunity. Validation of some research findings was achieved through cell experiments. m6A methylation regulators appear instrumental in diagnosing and classifying subtypes of COPD.

Keywords: COPD; diagnosis; differential genes; m6A methylation regulators; subtype.


Conflict of interest statement

The authors declare no conflicts of interest.

Figures

FIGURE 1
FIGURE 1
Distribution of m6A methylation regulators in COPD. (A) Heatmap of DEMs. (B) Chromosome location of m6A methylation regulators. (C) Histogram of m6A methylation regulators. Con, control group; Treat, COPD group; *p < 0.05, **p < 0.01, ***p < 0.001.
FIGURE 2
FIGURE 2
Correlation of ‘writer’, ‘reader writer’ and ‘eraser’ in m6A methylation regulators in COPD patients.
FIGURE 3
FIGURE 3
Construction of RF and SVM model. (A) The inverse cumulative distribution of residuals is plotted to show RF and SVM. (B) A residual diagram shows the residual distribution of RF and SVM. (C) Random forest tree model validation. (D) DEMs based on RF model. (E) ROC curve shows the accuracy of RF and SVM models.
FIGURE 4
FIGURE 4
Nomogram model. (A) Construction of nomogram model based on 11 DEMs. (B) The calibration curve showed the predictive ability of the nomogram model. (C) The decision based on the nomogram model benefited COPD patients. (D) The clinical ROC curve evaluated the clinical impact of the nomogram model.
FIGURE 5
FIGURE 5
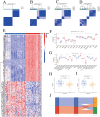
m6A methylation subtypes. (A–D) Consensus clustering of DEMs with k = 2–5. (E) Expression heat map of DEMs in cluster A and cluster B. (F) Histogram of differential expression of DEMs in cluster A and cluster B. (G) PCA of COPD patients. *p < 0.05, **p < 0.01, ***p < 0.001.
FIGURE 6
FIGURE 6
ssGSEA (A) Immune cell infiltration between Cluster A and Cluster B. (B) Correlation between the expression of DEMs and immune cells. (C) Differences in the abundance of immune cell infiltration between patients with high and low WTAP protein expression. *p < 0.05, **p < 0.01, ***p < 0.001.
FIGURE 7
FIGURE 7
Go and KEGG of DEGs. (A) V enn diagram (B) Bubble Diagram of GO (C) histogram of GO (D) circle map of GO (E) Bubble Diagram of KEGG (F) histogram of KEGG.
FIGURE 8
FIGURE 8
m6A genotypes. (A–D) consensus matrix of m6A genotype by DEGs with k = 2–5. (E) heatmap of DEGs related to m6A genotypes A and B. (F) Box diagram of DEMs in m6A genotype A and B. (G) The difference of immune cell infiltration between m6A genotypes. (H) m6A score in m6A methylation subtypes. (H, I) m6A score in m6A genotype. (J) Sankey diagram. *p < 0.05, **p < 0.01, ***p < 0.001.
FIGURE 9
FIGURE 9
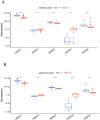
Relationships between histone acetylation family proteins, m6A methylation subtypes and m6A genotype. (A) HDAC2 and HDAC4 are highly expressed in m6A methylation subtype B and m6A genotype B. (B) HDAC1, HDAC3 and HDAC6 are highly expressed in m6A methylation subtypes A and m6A genotype A.
FIGURE 10
FIGURE 10
Expression result of HDAC2 in immunocyte fluorescence. In control, HDAC2 was highly expressed under 20 times and 40 times fluorescence microscope; In 5% CSE group, HDAC2 was low expressed under 20 times and 40 times fluorescence microscope. (A) HDAC2 in 20× (B) HDAC2 in 40× (C) Fluorescence expressions of HDAC2. **p < 0.01.
FIGURE 11
FIGURE 11
Western blotting (A) HDAC2 (B) nHDAC2 (C) METTL3 (D) NF‐kB (E) Phospho‐NF‐kB. (F) Histogram of HDAC2 protein expression in the control and 5% CSE groups. (G) Histogram of nHDAC2 protein expression in the control and 5% CSE groups. (H) Histogram of METTL3 protein expression in the control and 5% CSE groups. (I) The Histogram of NF‐kB protein expression in the control and 5% CSE groups. (J) Histogram of Phospho‐NF‐kB protein expression in the control and 5% CSE groups. ****p < 0.000.

References

    1. Liu Y., Greenlund K. J., VanFrank B., Xu F., Lu H., and Croft J. B., “Smoking Cessation Among U.S. Adult Smokers With and Without Chronic Obstructive Pulmonary Disease, 2018,” American Journal of Preventive Medicine 62 (2022): 492–502, 10.1016/j.amepre.2021.12.001. - DOI - PMC - PubMed
    1. Wang Z., Locantore N., Haldar K., et al., “Inflammatory Endotype–Associated Airway Microbiome in Chronic Obstructive Pulmonary Disease Clinical Stability and Exacerbations: A Multicohort Longitudinal Analysis,” American Journal of Respiratory and Critical Care Medicine 203 (2021): 1488–1502, 10.1164/rccm.202009-3448OC. - DOI - PMC - PubMed
    1. Wadhwa R., Aggarwal T., Malyla V., et al., “Identification of Biomarkers and Genetic Approaches Toward Chronic Obstructive Pulmonary Disease,” Journal of Cellular Physiology 234 (2019): 16703–16723, 10.1002/jcp.28482. - DOI - PubMed
    1. Wu J., Li X., Kong D., et al., “Exploring the Importance of M5c in the Diagnosis and Subtype Classification of COPD Using the GEO Database,” Gene 895 (2024): 147987, 10.1016/j.gene.2023.147987. - DOI - PubMed
    1. Alarcón C. R., Lee H., Goodarzi H., Halberg N., and Tavazoie S. F., “N6‐Methyladenosine Marks Primary microRNAs for Processing,” Nature 519 (2015): 482–485, 10.1038/nature14281. - DOI - PMC - PubMed

MeSH terms

LinkOut - more resources