. 2024 Dec 24;43(12):115001.
doi: 10.1016/j.celrep.2024.115001. Epub 2024 Nov 23.

AMPK regulates Bcl2-L-13-mediated mitophagy induction for cardioprotection

Affiliations

AMPK regulates Bcl2-L-13-mediated mitophagy induction for cardioprotection

Tomokazu Murakawa et al. Cell Rep. .

Abstract

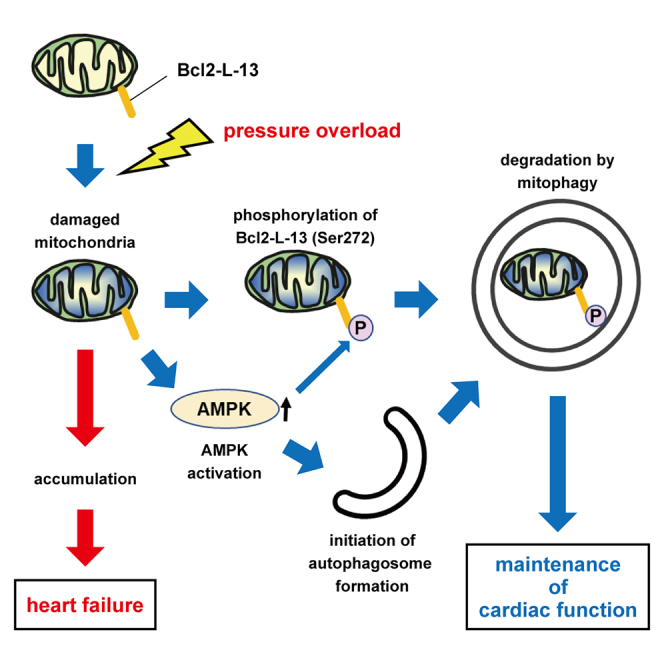
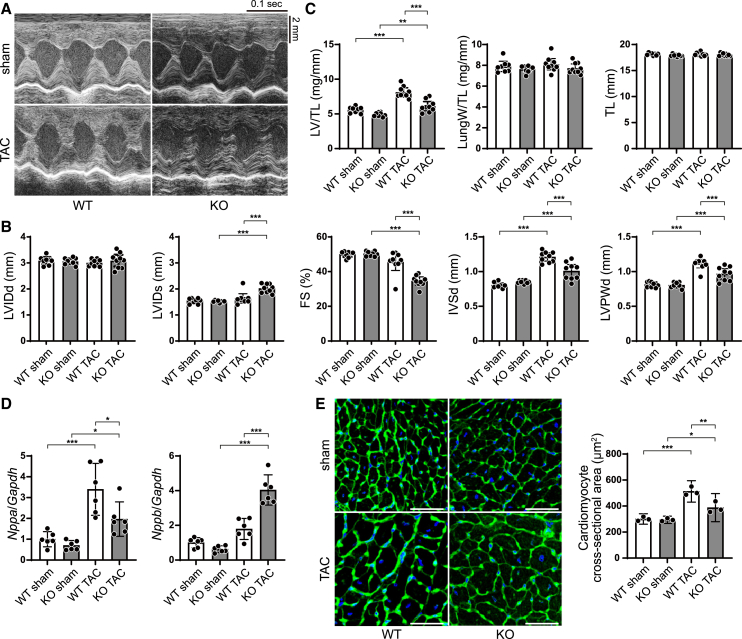
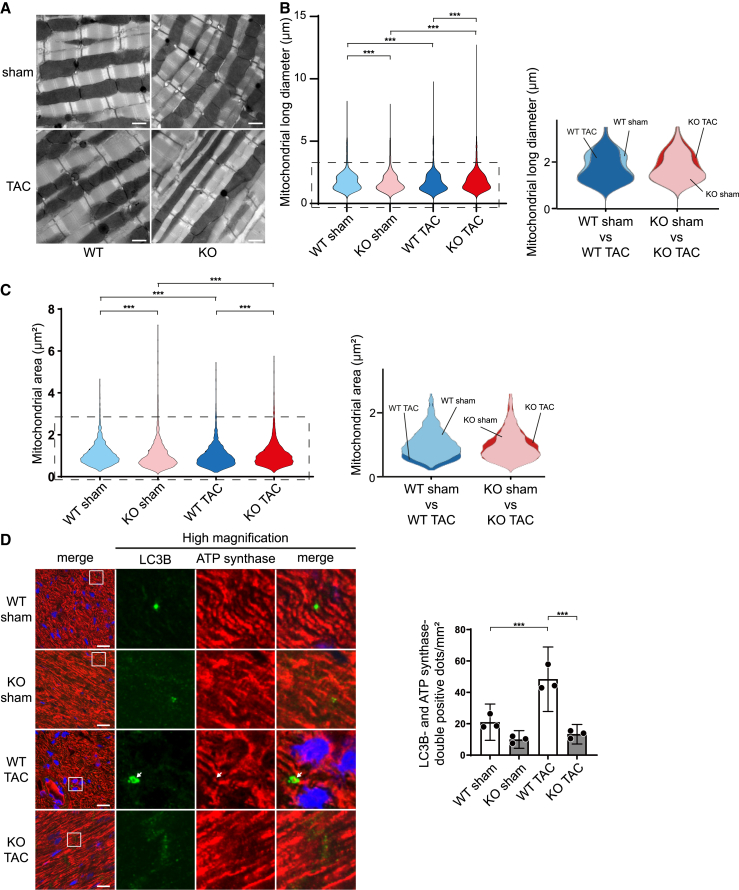
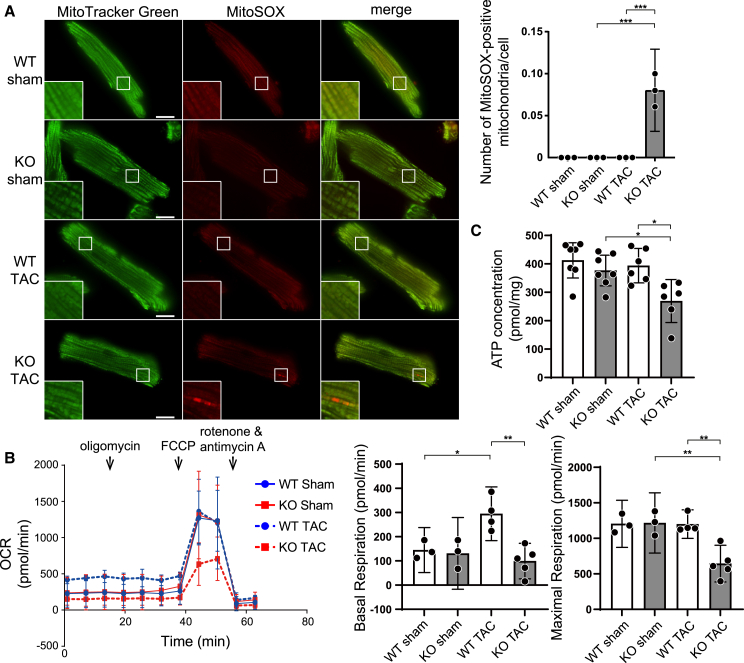
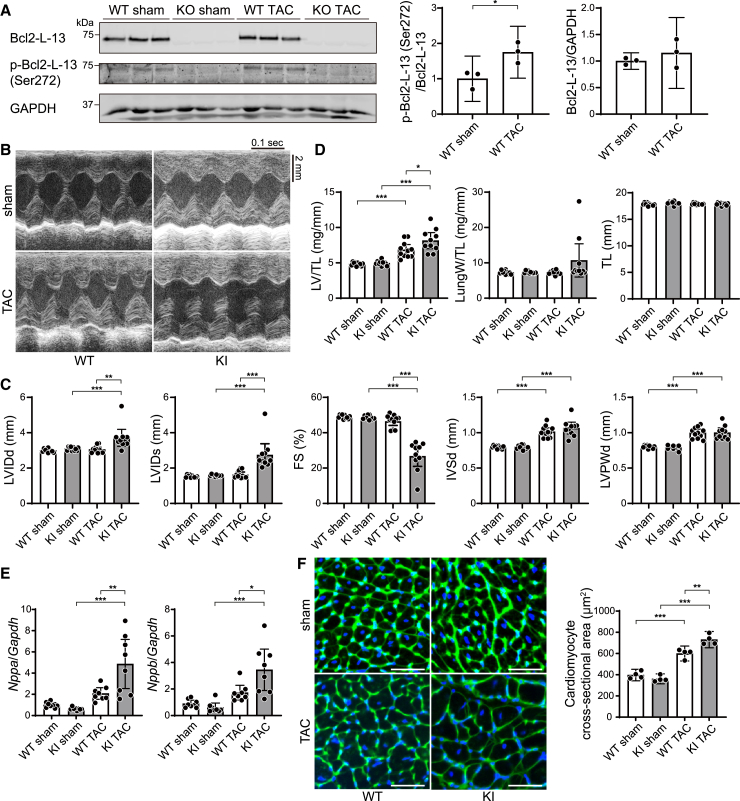
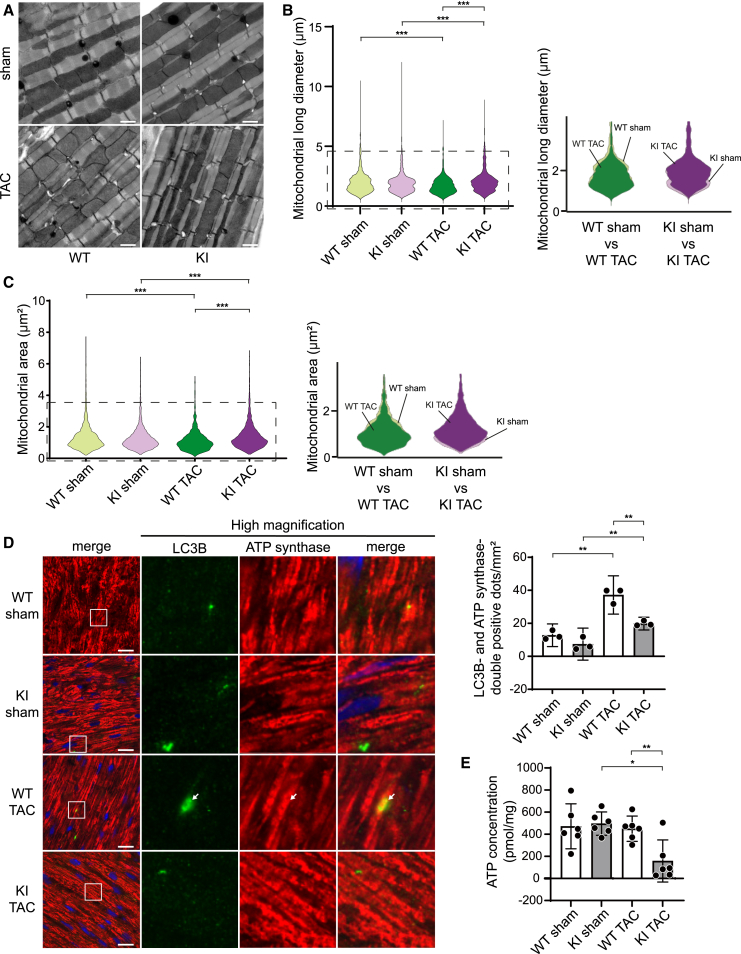
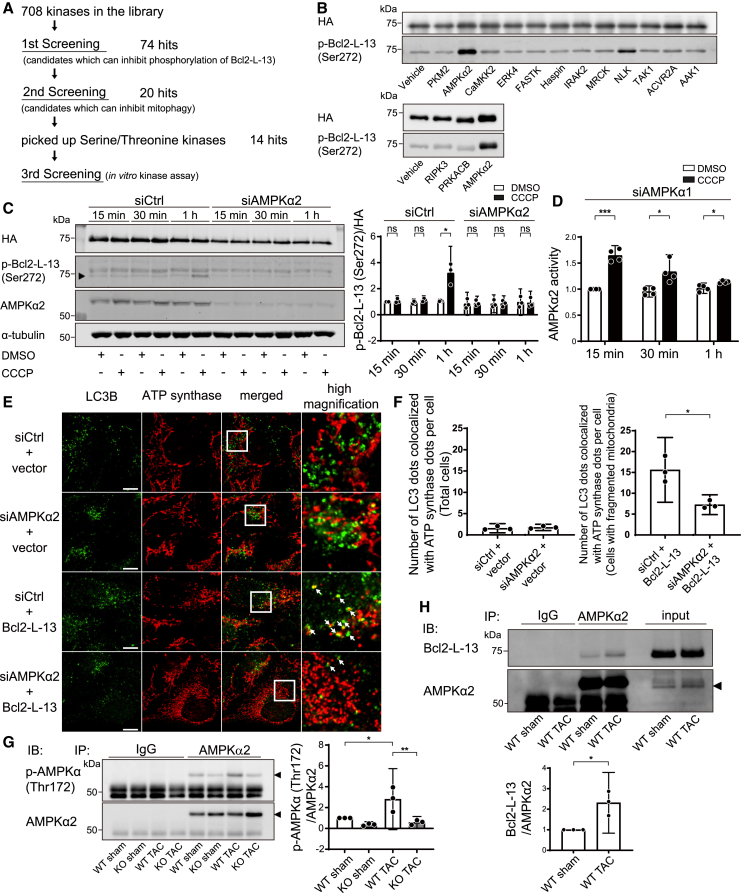
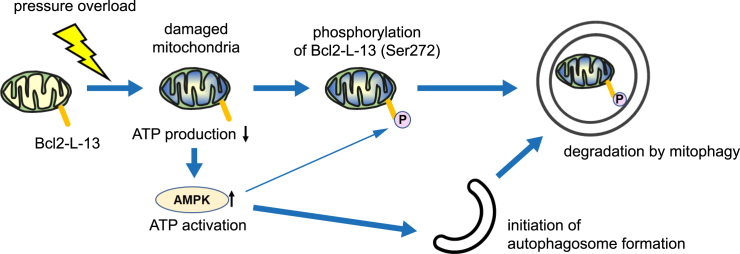
The accumulation of damaged mitochondria in the heart is associated with heart failure. Mitophagy is an autophagic degradation system that specifically targets damaged mitochondria. We have reported previously that Bcl2-like protein 13 (Bcl2-L-13) mediates mitophagy and mitochondrial fission in mammalian cells. However, the in vivo function of Bcl2-L-13 remains unclear. Here, we demonstrate that Bcl2-L-13-deficient mice and knockin mice, in which the phosphorylation site (Ser272) on Bcl2-L-13 was changed to Ala, showed left ventricular dysfunction in response to pressure overload. Attenuation of mitochondrial fission and mitophagy led to impairment of ATP production in these mouse hearts. In addition, we identified AMPKα2 as the kinase responsible for the phosphorylation of Bcl2-L-13 at Ser272. These results indicate that Bcl2-L-13 and its phosphorylation play an important role in maintaining cardiac function. Furthermore, the amplitude of stress-stimulated mitophagic activity could be modulated by AMPKα2.

Keywords: Bcl2-L-13; CP: Cell biology; heart failure; mitochondria; mitophagy.


Conflict of interest statement

Declaration of interests The authors declare no competing interests.

Figures

None
Graphical abstract
Figure 1
Figure 1
Pressure overload-induced cardiac dysfunction in Bcl2l13−/− mice Bcl2l13+/+ (WT) and Bcl2l13−/− (KO) mice were subjected to pressure overload by means of transverse aortic constriction (TAC). The mice were analyzed 4 weeks after TAC. (A) Representative images of M-mode echocardiographic tracings from sham- or TAC-operated WT or KO mice. Scale bars: 0.1 s and 2 mm. (B) Echocardiographic parameters. n = 8 (WT sham), 8 (KO sham), 9 (WT TAC), or 9 (KO TAC) per group. LVIDd, end-diastolic left ventricular internal dimension; LVIDs, end-systolic left ventricular internal dimension; FS, fractional shortening; IVSd, end-diastolic interventricular septum wall thickness; LVPWd, end-diastolic left ventricular posterior wall thickness. (C) Physiological parameters. n = 8 (WT sham), 8 (KO sham), 9 (WT TAC), or 9 (KO TAC) per group. LV/TL, left ventricular weight/tibia length; lungW/TL, lung weight/tibia length. (D) mRNA expression of Nppa and Nppb (n = 6). Gapdh mRNA was used as the loading control. The average value in the WT sham group was set to 1. (E) Wheat germ agglutinin-stained heart sections. Scale bar: 50 μm. Cardiomyocyte cross-sectional areas were measured by tracing the outline of 100 myocytes in the non-fibrotic area on each section (n = 3). Results are shown as mean with 95% confidence intervals (CIs). Statistical analysis included one-way ANOVA followed by Tukey-Kramer’s post hoc test. All pairwise comparisons were performed. p < 0.05, ∗∗p < 0.01, ∗∗∗p < 0.001. See also Figure S1.
Figure 2
Figure 2
Mitochondrial morphology and mitophagy in TAC-operated Bcl2l13−/− mice (A) Electron micrographs of mouse hearts 5 days after TAC. Scale bar: 1 μm. (B and C) Violin plots visualizing the distribution of long diameters and areas of mitochondria measured in (A). Using the Freehand selection tool, inter-myofibrillar mitochondria were traced. The long diameter is the primary axis of the best-fitting ellipse to the traced pixels. The area enclosed by the dotted line in the violin plots is enlarged and shown on the right, with two groups overlaid. The histogram of the distribution of long diameters is shown in Figure S3A. (D) Immunostaining of LC3B and ATP synthase in the heart 5 days after TAC. Scale bar: 20 μm. Images in the box at higher magnification are shown on the right. The white arrow indicates the colocalization of LC3B and ATP synthase double-positive dot. The number of LC3B and ATP synthase double-positive dots per 1 mm2 is shown in the bar graph (n = 3). Results are shown as mean with 95% CI. Statistical analysis by Kruskal-Wallis test in (B) and (C) and one-way ANOVA followed by Tukey-Kramer’s post hoc test in (D). All pairwise comparisons were performed. ∗∗∗p < 0.001. See also Figures S2 and S3.
Figure 3
Figure 3
Mitochondrial dysfunction in TAC-operated Bcl2l13−/− mice (A) Mitochondrial reactive oxygen species (ROS) production in cardiomyocytes. Cardiomyocytes were isolated 5 days after the TAC operation and stained with MitoSOX and MitoTracker Green for confocal microscopy (n = 3). MitoSOX-positive mitochondria in the boxed area are shown at higher magnification in the inset. Scale bar: 10 μm. The number of MitoSOX-positive mitochondria per cell is shown in the bar graph. At least 30 cells were observed in each experiment. (B) The oxygen consumption rate (OCR) of isolated cardiomyocytes 5 days after TAC was assessed using the Seahorse XF24 extracellular flux analyzer. n = 3 (WT sham), 3 (KO sham), 3 (WT TAC), or 5 (KO TAC) per group. Reagents were injected sequentially during the assay to yield final concentrations of 1 μM oligomycin, 2 μM carbonyl cyanide 4-(trifluoromethoxy) phenylhydrazone (FCCP), 2 μM rotenone, and 4 μM antimycin A. Basal respiration and maximal respiration are shown in the bar graphs. (C) Tissue ATP levels were measured using the left ventricle from mice 5 days after TAC. n = 7 (WT sham), 7 (KO sham), 6 (WT TAC), or 6 (KO TAC) per group. Results are shown as mean with 95% CI. Statistical analysis by one-way ANOVA followed by Tukey-Kramer’s post hoc test. All pairwise comparisons were performed. p < 0.05, ∗∗p < 0.01, ∗∗∗p < 0.001.
Figure 4
Figure 4
Pressure overload-induced cardiac dysfunction in Bcl2-L-13 (S272A) knockin mice (A) Western blot analysis of phospho- Bcl2-L-13 (Ser272) in the Bcl2l13+/+ (WT) and Bcl2l13−/− (KO) mouse hearts 4 weeks after TAC (n = 3). The bar graph shows densitometric analysis. (B) Representative images of M-mode echocardiographic tracings from sham- or TAC-operated wild-type (WT) or Bcl2-L-13 (S272A) knockin (KI) mice 4 weeks after surgery. Scale bars, 0.1 s and 2 mm. (C) Echocardiographic parameters (n = 10). (D) Physiological parameters (n = 10). (E) mRNA expression of Nppa and Nppb (n = 8). Gapdh mRNA was used as the loading control. The average value in the WT sham group was set to 1. (F) Wheat germ agglutinin-stained heart sections. Scale bar: 50 μm. Cardiomyocyte cross-sectional areas were measured by tracing the outline of 100 myocytes in a non-fibrotic area in each section (n = 4). Results are shown as mean with 95% CI. Statistical analysis by one-way ANOVA followed by Tukey-Kramer’s post hoc test. All pairwise comparisons were performed. p < 0.05, ∗∗p < 0.01, ∗∗∗p < 0.001. See also Figure S4.
Figure 5
Figure 5
Mitochondrial morphology, mitophagy, and ATP concentration in TAC-operated Bcl2-L-13 (S272A) KI hearts (A) Electron micrographs of mouse hearts 5 days after TAC. Scale bar: 1 μm. (B and C) Violin plots visualizing the distribution of long diameters and areas of mitochondria measured in (A). Using the Freehand selection tool, inter-myofibrillar mitochondria were traced. The long diameter is the primary axis of the best-fitting ellipse to the traced pixels. The area enclosed by the dotted line in the violin plots is enlarged and shown on the right, with two groups overlaid. The histogram of the distribution of long diameters is shown in Figure S5A. (D) Immunostaining of LC3B and ATP synthase in the heart 5 days after TAC. Scale bar: 20 μm. Images in the box at higher magnification are shown on the right. The white arrows indicates the colocalization of LC3B and ATP synthase double-positive dots. The number of LC3B and ATP synthase double-positive dots per 1 mm2 is shown in the bar graph (n = 3). (E) Tissue ATP levels measured using the left ventricle from mice 5 days after TAC (n = 6). Results are shown as mean with 95% CI. Statistical analysis by Kruskal-Wallis test in (B) and (C) and one-way ANOVA followed by Tukey-Kramer’s post hoc test in (D) and (E). All pairwise comparisons were performed. p < 0.05, ∗∗p < 0.01, ∗∗∗p < 0.001. See also Figure S5.
Figure 6
Figure 6
AMPKα2 is the kinase responsible for Bcl2-L-13 phosphorylation at Ser272 (A) Schematic of the responsible kinase screening workflow. (B) In vitro kinase assay in the third screening. Bacterially synthesized HA-Bcl2-L-13 was mixed with purified candidate proteins and ATP. After incubation at 37°C for 30 min, the reaction mix was subjected to western blotting using an anti-phospho-Bcl2-L-13 (Ser272) antibody. (C) The effect of AMPKα2 knockdown in CCCP-induced Bcl2-L-13 phosphorylation. HEK293A cells stably expressing HA-Bcl2-L-13 were transfected with control siRNA or siAMPKα2 for 72 h. Then, the cells were treated with DMSO or 15 μM CCCP for the indicated times, and cell lysates were subjected to western blot analysis. Densitometric analysis of phospho-Bcl2-L-13 (Ser272) is shown in the bar graph. The value for the group with control siRNA (siCtrl) transfection and 15 min of DMSO treatment in each experiment was set to 1 (n = 3). (D) Upregulation of AMPKα2 activity by CCCP treatment. To analyze AMPKα2-specific activity, HEK293A cells stably expressing HA-Bcl2-L-13 were transfected with siAMPKα1 for 72 h and then treated with DMSO or 15 μM CCCP. The value for the group with 15-min DMSO treatment in each experiment was set to 1 (n = 4). (E and F) HEK293A cells were transfected with control siRNA (siCtrl) or siAMPKα2 for 72 h, followed by transfection with an empty vector or HA-Bcl2-L-13. Forty-four hours after transfection, cells were treated with 100 nM bafilomycin A1 for 4 h and immunostained with anti-LC3B and anti-ATP synthase antibodies. Images in the box at higher magnification are shown on the right. White arrows indicate the puncta recognized as colocalized by the software. The number of LC3B dots colocalized with ATP synthase dots per cell is shown in (F). At least 20 cells were counted for each group (n = 3). Scale bar: 10 μm. (G) Upregulation of AMPKα2 phosphorylation 5 days after TAC operation. To analyze AMPKα2-specific phosphorylation, lysates from the left ventricle were subjected to immunoprecipitation with an anti-AMPKα2 antibody followed by immunoblotting with an anti-phospho-AMPKα (Thr172) antibody. Densitometric analysis of phospho-AMPKα (Thr172) is shown in the right bar graph. The value for the WT sham group in each experiment was set to 1 (n = 3). (H) Interaction between Bcl2-L-13 and AMPKα2 5 days after TAC. Lysates from the left ventricle were subjected to immunoprecipitation with an anti-AMPKα2 antibody. Co-precipitated Bcl2-L-13 was detected by immunoblotting. Densitometric analysis of Bcl2-L-13 is shown in the graph below. The value for the WT sham group in each experiment was set to 1 (n = 3). Results are shown as mean with 95% CI. Statistical analysis by unpaired, two-tailed t tests in (C), (D), (F), and (H) and one-way ANOVA followed by Tukey-Kramer’s post hoc test in (G). All pairwise comparisons were performed. p < 0.05, ∗∗p < 0.01, ∗∗∗p < 0.001. ns, not significant. See also Figures S6 and S7.
Figure 7
Figure 7
A model of the role of AMPK in Bcl2-L-13-mediated mitophagy under pressure overload Pressure overload damages mitochondria, leading to decreased ATP production and subsequent activation of AMPK. Activated AMPK initiates autophagosome formation and directly phosphorylates Bcl2-L-13 for mitophagy induction.

References

    1. McDonagh T.A., Metra M., Adamo M., Gardner R.S., Baumbach A., Böhm M., Burri H., Butler J., Čelutkienė J., Chioncel O., et al. 2021 ESC Guidelines for the diagnosis and treatment of acute and chronic heart failure: Developed by the Task Force for the diagnosis and treatment of acute and chronic heart failure of the European Society of Cardiology (ESC) With the special contribution of the Heart Failure Association (HFA) of the ESC. Rev. Esp. Cardiol. 2022;75:523. doi: 10.1016/j.rec.2022.05.005. - DOI - PubMed
    1. Ramaccini D., Montoya-Uribe V., Aan F.J., Modesti L., Potes Y., Wieckowski M.R., Krga I., Glibetić M., Pinton P., Giorgi C., Matter M.L. Mitochondrial Function and Dysfunction in Dilated Cardiomyopathy. Front. Cell Dev. Biol. 2020;8 doi: 10.3389/fcell.2020.624216. - DOI - PMC - PubMed
    1. Moyzis A.G., Sadoshima J., Gustafsson Å.B. Mending a broken heart: the role of mitophagy in cardioprotection. Am. J. Physiol. Heart Circ. Physiol. 2015;308:H183–H192. doi: 10.1152/ajpheart.00708.2014. - DOI - PMC - PubMed
    1. Dikic I., Elazar Z. Mechanism and medical implications of mammalian autophagy. Nat. Rev. Mol. Cell Biol. 2018;19:349–364. doi: 10.1038/s41580-018-0003-4. - DOI - PubMed
    1. Kanki T., Wang K., Cao Y., Baba M., Klionsky D.J. Atg32 is a mitochondrial protein that confers selectivity during mitophagy. Dev. Cell. 2009;17:98–109. doi: 10.1016/j.devcel.2009.06.014. - DOI - PMC - PubMed

Publication types

Substances

LinkOut - more resources