. 2024 Dec:78:103438.
doi: 10.1016/j.redox.2024.103438. Epub 2024 Nov 19.

RSL3 sensitizes glioma cells to ionizing radiation by suppressing TGM2-dependent DNA damage repair and epithelial-mesenchymal transition

Affiliations

RSL3 sensitizes glioma cells to ionizing radiation by suppressing TGM2-dependent DNA damage repair and epithelial-mesenchymal transition

Xuanzhong Wang et al. Redox Biol. 2024 Dec.

Abstract

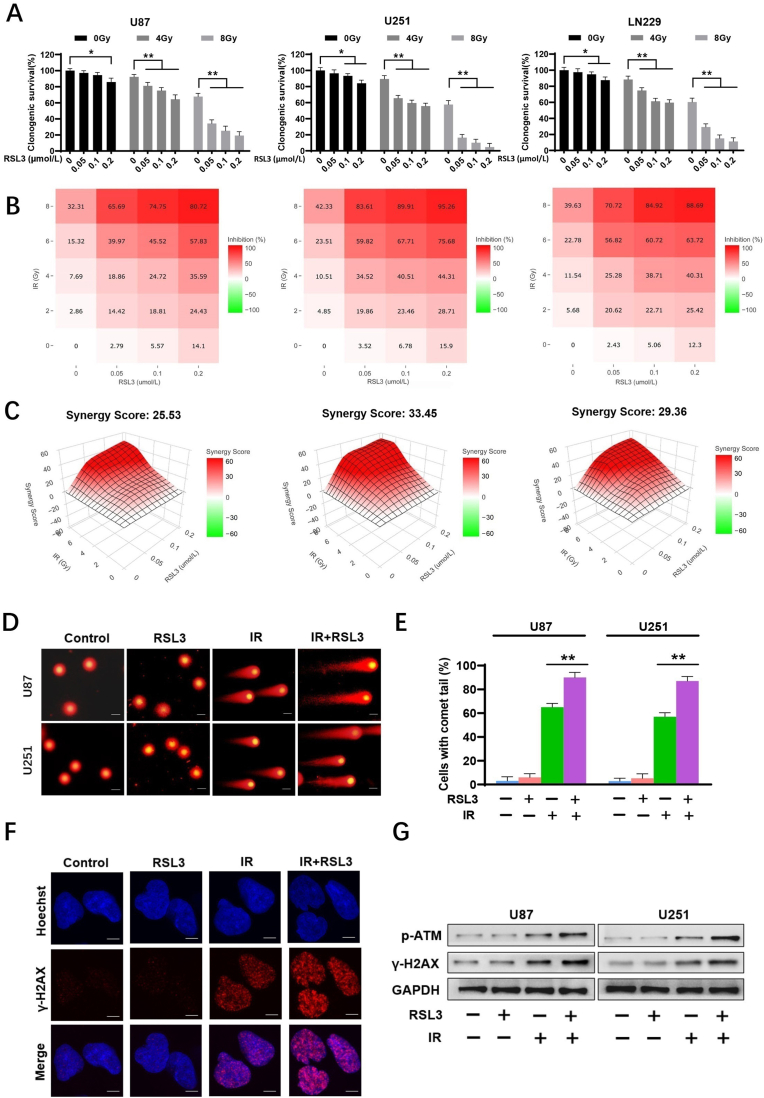
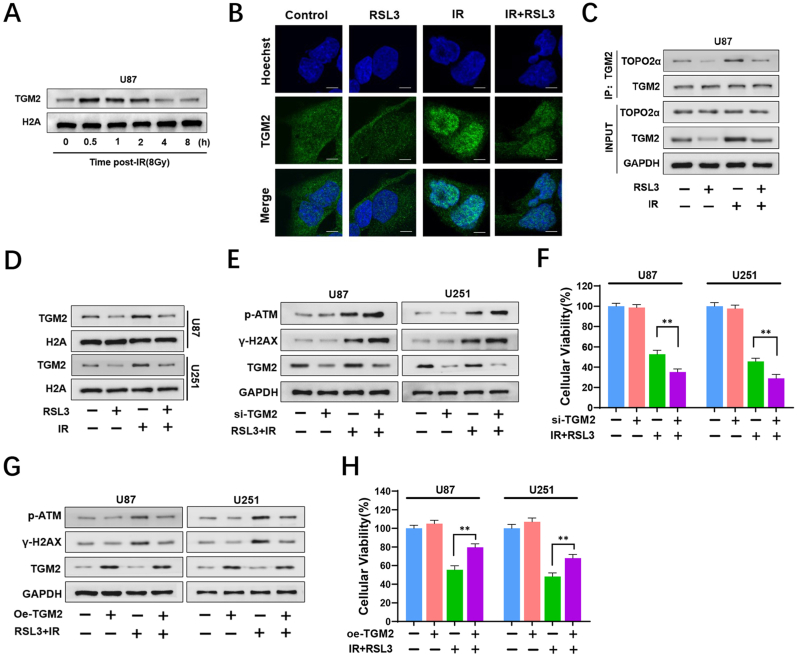
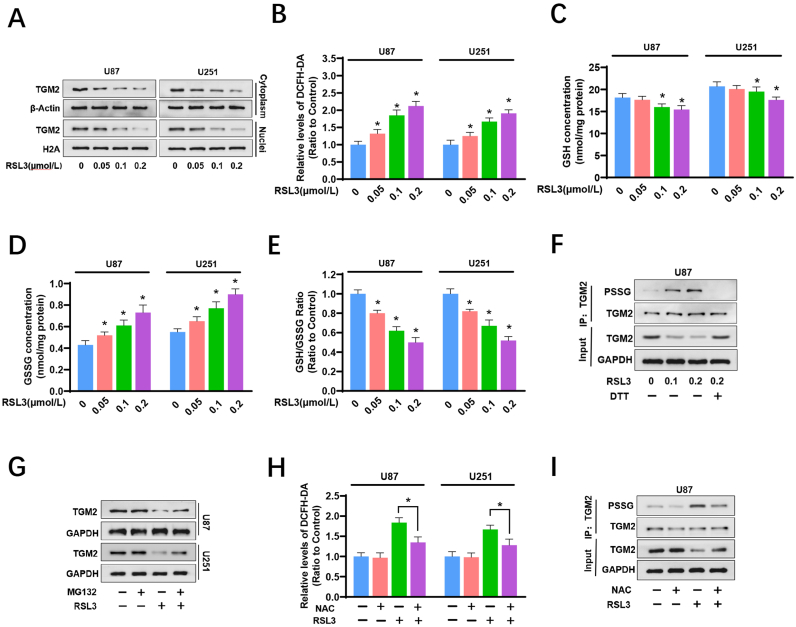
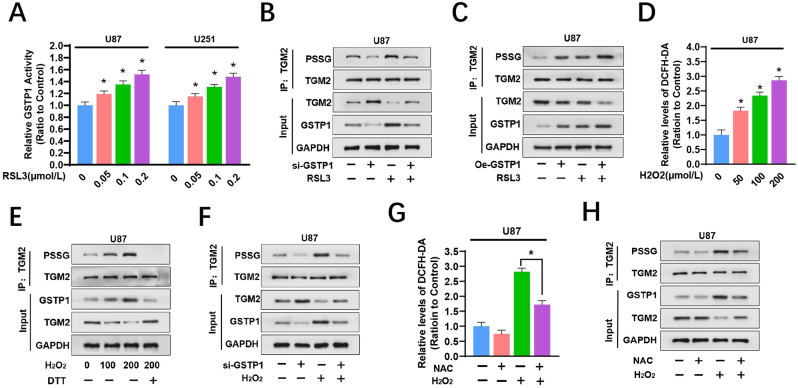
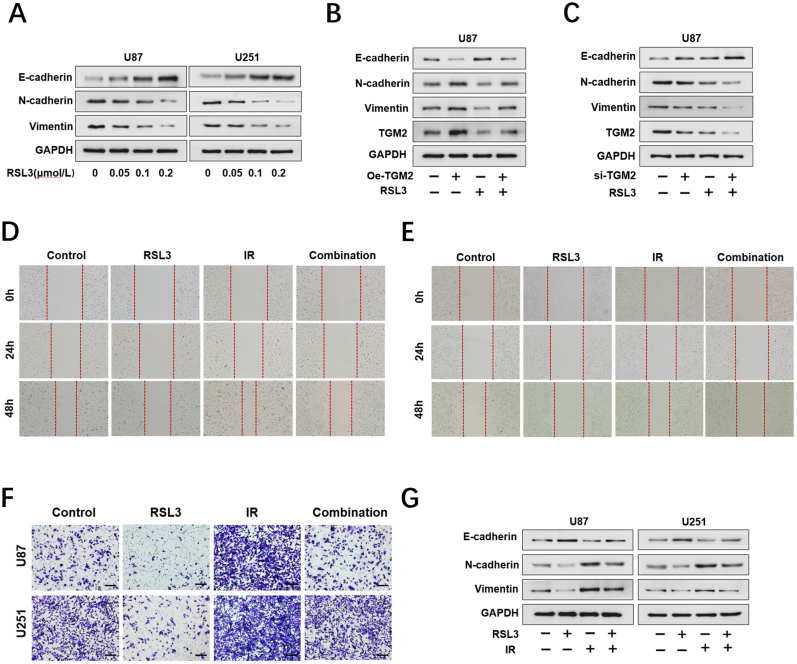
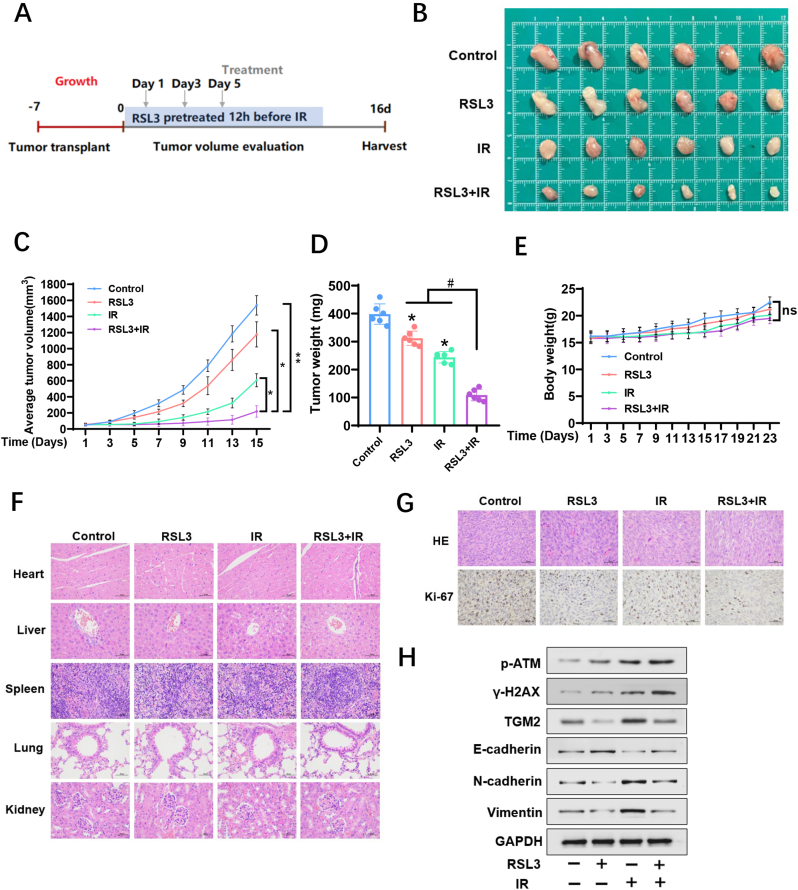
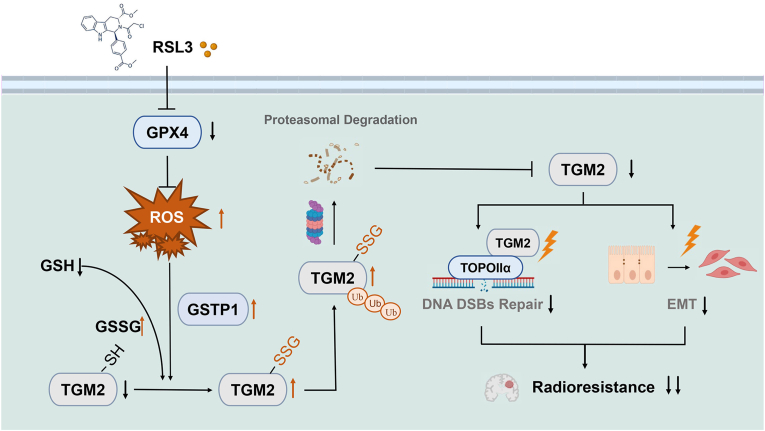
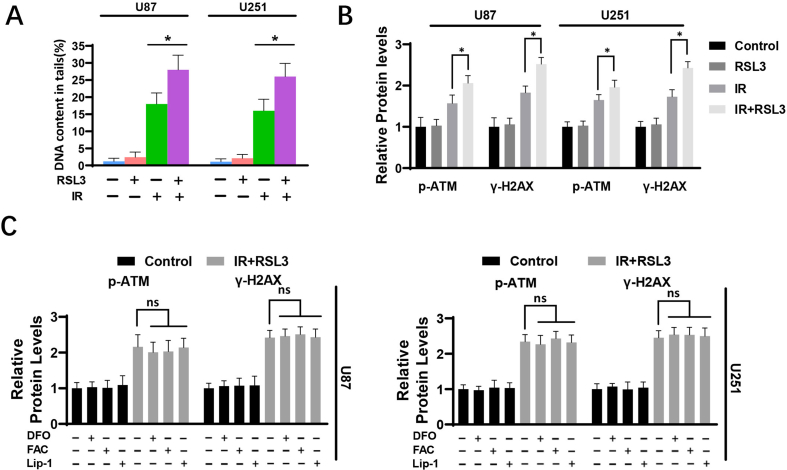
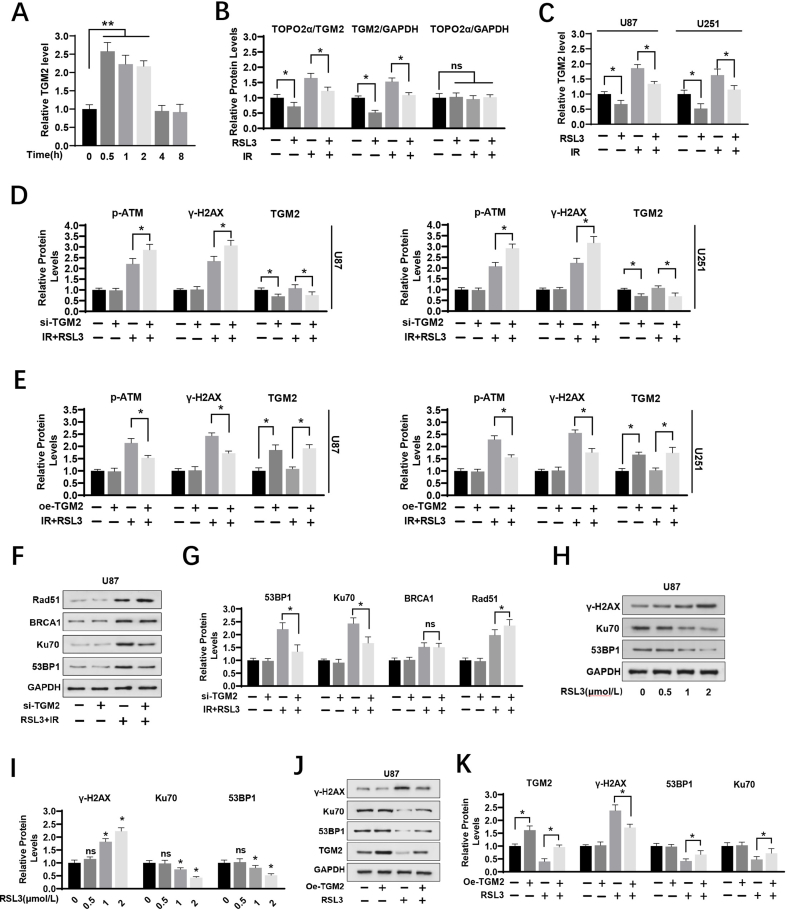
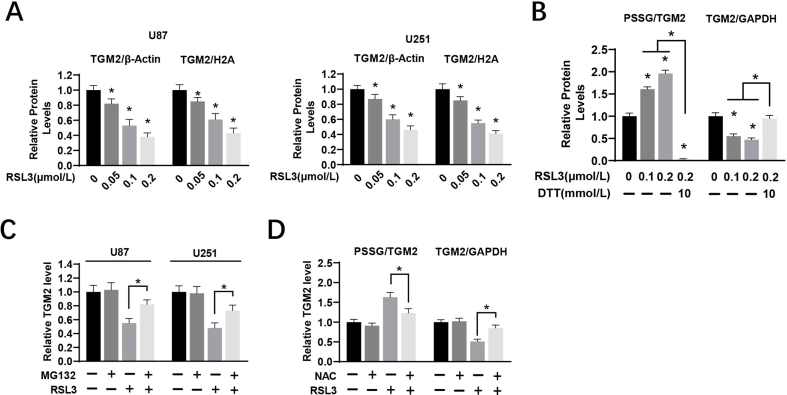
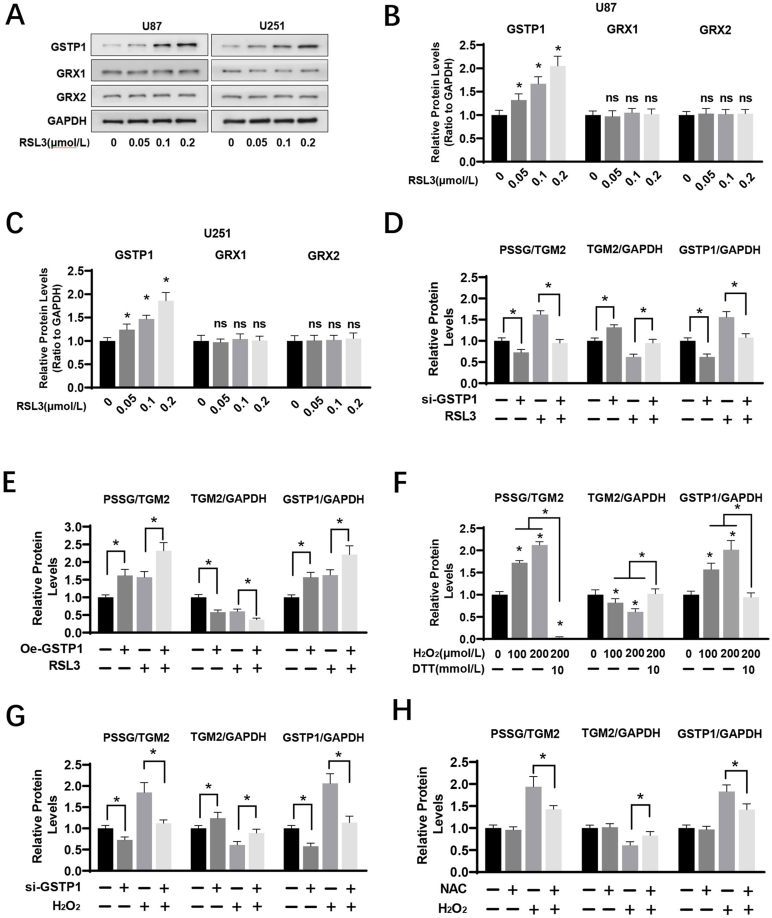
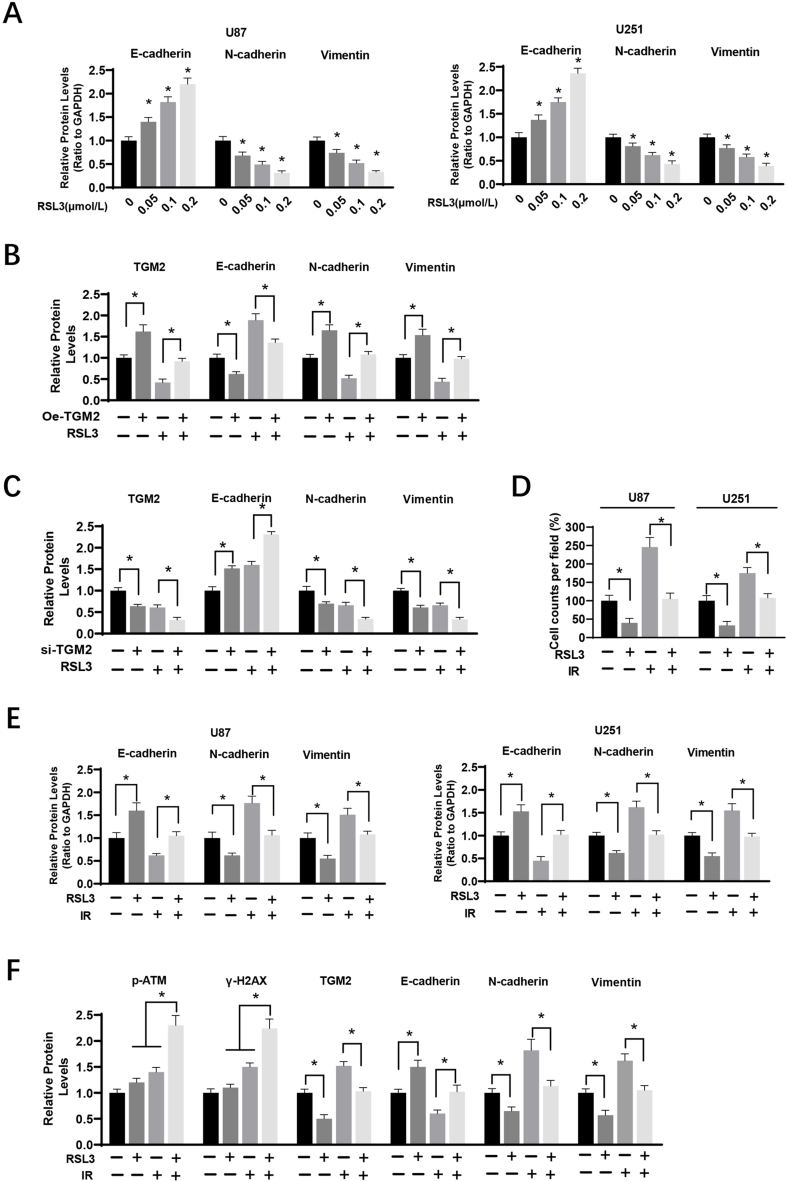
RAS-selective lethal small molecule 3 (RSL3) is a small-molecule compound that triggers ferroptosis by inactivating glutathione peroxidase 4. However, its effect on the radioresistance of glioma cells and the underlying mechanisms remains unclear. In this study, we found that RSL3 sensitized glioma cells to ionizing radiation (IR) and enhanced IR-induced DNA double-strand breaks (DSBs). Inhibition of ferroptosis pathways partly prevented the clonogenic death caused by the IR/RSL3 combination but did not alleviate the DNA DSBs, indicating that RSL3 promotes IR-induced DNA DSBs via a non-ferroptotic mechanism. We demonstrated that transglutaminase 2 (TGM2) plays a vital role in the radiosensitization effect of RSL3 on glioma cells. Treatment with RSL3 downregulated TGM2 in a dose-dependent manner. Overexpression of TGM2 not only alleviated DNA DSBs but also inhibited clonogenic death caused by the IR/RSL3 combination. Mechanistically, RSL3 triggered oxidative stress in glioma cells, which promoted the S-gluthathionylation of TGM2 via upregulation of glutathione S-transferase P1(GSTP1), culminating in the proteasomal degradation of TGM2. This process resulted in the suppression of DNA repair mechanisms by impeding the nuclear accumulation of TGM2 and disrupting the interaction between TGM2 and topoisomerase IIα after irradiation. We also found that RSL3 inhibited glioma cell epithelial-mesenchymal transition (EMT) in both IR-treated and non-IR-treated cells. Overexpression of TGM2 prevented, while knockdown of TGM2 aggravated the EMT inhibition caused by RSL3, indicating that RSL3 also sensitized glioma cells to IR by inhibiting EMT via a TGM2-dependent mechanism. Furthermore, in mice bearing human U87 tumor xenografts, RSL3 administration synergized with IR to inhibit tumor growth, accompanied by TGM2 inhibition, DNA DSBs, and EMT inhibition in tumor tissues. Taken together, we demonstrated that RSL3 sensitizes glioma cells to IR by suppressing TGM2-mediated DNA repair and EMT.

Keywords: Glioma; Oxidative stress; RAS-Selective lethal small molecule 3; S-Glutathionylation; Transglutaminase 2.


Conflict of interest statement

Declaration of competing interest The authors declare that they have no known competing financial interests or personal relationships that could have appeared to influence the work reported in this paper.

Figures

Fig. 1
Fig. 1
RSL3 radiosensitizes glioma cells and enhances IR-induced DSBs. (A) Quantitative analysis of the colony formation and inhibition of U87, U251, and LN229 cells treated with ionizing radiation (IR) and dimethyl sulfoxide (DMSO) (control) or RSL3 (0.05, 0.1, and 0.2 μmol/L). (B) Combined inhibitory effects of various combinations of RSL3 (0–0.2 μmol/L) and IR (0–8 Gy) were tested against glioma cells using the clonal formation analysis. The dose-response matrix was generated using the Bioconductor package. (C) Visualization of the calculated 3D synergy maps built from the Bioconductor package “synergyfinder”. The highest single agent (HSA) mode synergy score is presented as the average of all δ-scores across the dose-response landscape for glioma cells treated with RSL3 + IR. Generally, a synergy score that is less than −10 means the interaction between the two drugs is antagonistic; from −10 to 10, the interaction is likely to be additive, and when the score in higher than 10, the interaction is likely to be synergistic. (D–E) Representative images (D) and qualification of DSBs by measuring cells with comet tail (E) using neutral comet assay. U87 and U251 cells were pretreated with 0.1 μmol/L RSL3 for 24 h and then exposed to 8Gy IR for 0.5h. Scale bars:10 μm (F) Representative images of γ-H2AX (red) in nucleus (blue) of U87 cells treated with RSL3+IR using confocal microscopy combined with immunocytochemical staining. Scale bars:5 μm. (G) Western blotting analysis of p-ATM, γ-H2AX levels in U87 and U251 cells pretreated with 0.1 μmol/L RSL3 for 24 h and then exposed to 8Gy IR for 0.5h. ∗: P < 0.05. ∗∗: P < 0.01. (For interpretation of the references to color in this figure legend, the reader is referred to the Web version of this article.)
Fig. 2
Fig. 2
RSL3 promotes IR-induced DSBs via a non-ferroptosis mechanism. (A–B) Ferrous ion level (A) and MDA level (B) analysis of U87 and U251 cells pretreated with 0.1 μmol/L RSL3 for 24 h and then exposed to 8 Gy IR for 0.5h. (C–D) Viability analysis (CCK-8 assay) of U87 and U251 cells pretreated with 500 μmol/L Deferoxamine (DFO), 200 μmol/L Ferric ammonium citrate (FAC) or 10 μmol/L Liproxstatin-1(Lip-1) for 1 h and then treated with 0.1 μmol/L RSL3 for 24 h before exposed to 8Gy IR for 48h. (E) Western blotting analysis of p-ATM, γ-H2AX levels in U87 and U251 cells pretreated with 500 μmol/L Deferoxamine (DFO), 200 μmol/L Ferric ammonium citrate (FAC) or 10 μmol/L Liproxstatin-1(Lip-1) for 1 h and then treated with 0.1 μmol/L RSL3 for 24 h before exposed to 8Gy IR. ∗: P < 0.05.
Fig. 3
Fig. 3
RSL3 promotes IR-induced DSBs by suppressing TGM2-mediated DSB repair. (A) Western blotting analysis of nuclear TGM2 levels in U87 cells after exposed to 8Gy IR for 0.5, 1, 2, 4 and 8h. H2A was used as loading control of nucleus. (B) Representative images of TGM2 (green) in nucleus (blue) of U87 cells treated with RSL3+IR using confocal microscopy combined with immunocytochemical staining. Scale bars:5 μm. (C) Co-immunoprecipitation combined with western blotting analysis of the TOPOIIα level co-immunoprecipitated with TGM2 in U87 cells pretreated with 0.1 μmol/L RSL3 for 24 h and then exposed to 8 Gy IR for 0.5h. (D) Western blotting analysis of the nuclear TGM2 level in cells pretreated with 0.1 μmol/L RSL3 for 24 h and then exposed to 8 Gy IR for 0.5h. (E) Western blotting analysis of the p-ATM, γ-H2AX and TGM2 levels in cells treated with RSL3/IR combination with or without TGM2 knockdown. (F) Viability analysis (CCK-8 assay) of U87 and U251 cells transfected with TGM2 siRNA and treated with RSL3/IR combination. (G) Western blotting analysis of the p-ATM, γ-H2AX and TGM2 levels in cells treated with RSL3/IR combination with or without TGM2 overexpression. (H) Viability analysis (CCK-8 assay) of U87 and U251 cells transfected with TGM2 overexpression plasmid and treated with RSL3/IR combination. ∗∗: P < 0.01. (For interpretation of the references to color in this figure legend, the reader is referred to the Web version of this article.)
Fig. 4
Fig. 4
RSL3 promotes ROS-dependent degradation of TGM2 by protein S-glutathionylation (A) Western blotting analysis of the TGM2 levels in cells treated with RSL3 at indicated concentrations for 24h. β-Actin and H2A were used as loading control of cytoplasm and nucleus, respectively. (B) ROS level (detected by DCFH-DA probe) analysis in cells treated with RSL3 at indicated concentrations for 24h. (C–E) GSH, GSSG concentration as well as GSH/GSH ratio analysis in cells treated with RSL3 at indicated concentrations for 24h. (F) Co-immunoprecipitation combined with western blotting analysis of the PSSG level co-immunoprecipitated with Flag-tagged TGM2 in U87 cells pretreated with 10 mmol/L DTT for 1 h before incubated with RSL3. U87 cells were transfected with Flag-tagged TGM2 plasmids and then incubated with 0.1 and 0.2 μmol/L RSL3 for 24 h. The intracellular Flag-tagged TGM2 was captured by anti-Flag antibody and immunoblotted by using anti-PSSG antibody. (G) Western blotting analysis of the intracellular TGM2 levels in cells pretreated with 10 μmol/L MG132 for 1h before incubated with 0.1 μmol/L RSL3 for 24 h. (H) ROS level analysis in cells pretreated with 5 mmol/L NAC for 1h before incubated with 0.1 μmol/L RSL3 for 24 h. (I) Co-immunoprecipitation combined with western blotting analysis of the PSSG level co-immunoprecipitated with Flag-tagged TGM2 in U87 cells pretreated with 5 mmol/L NAC for 1 h before incubated with 0.1 μmol/L RSL3 for 24 h∗: P < 0.05 versus control group.
Fig. 5
Fig. 5
ROS contributed to RSL3-induced TGM2 glutathionylation via upregulation of GSTP1. (A) GSTP1 activity analysis in cells treated with RSL3 at indicated concentrations for 24h. (B) Co-immunoprecipitation combined with western blotting analysis of the PSSG level co-immunoprecipitated with Flag-tagged TGM2 in U87 cells transfected with GSTP1 siRNA before incubated with 0.1 μmol/L RSL3 for 24 h. (C) Western blotting analysis of the PSSG level co-immunoprecipitated with Flag-tagged TGM2 in U87 cells transfected with GSTP1 overexpressing plasmid before incubated with 0.1 μmol/L RSL3 for 24 h. (D) ROS level (detected by DCFH-DA probe) analysis in cells treated with H2O2 at indicated concentrations for 6h. (E)Western blotting analysis of the PSSG level co-immunoprecipitated with Flag-tagged TGM2 in U87 cells pretreated with 10 mmol/L DTT for 1 h before incubated with H2O2 for 6h. (F) Western blotting analysis of the PSSG level co-immunoprecipitated with Flag-tagged TGM2 in U87 cells transfected with GSTP1 siRNA before incubated with 200 μmol/L H2O2 for 6h. (G) ROS level analysis in cells pretreated with 5 mmol/L NAC for 1h before incubated with 200 μmol/L H2O2 for 6h. (H) Western blotting analysis of the PSSG level co-immunoprecipitated with Flag-tagged TGM2 in U87 cells pretreated with 5 mmol/L NAC for 1h before incubated with 200 μmol/L H2O2 for 6h. ∗: P < 0.05 versus control group.
Fig. 6
Fig. 6
RSL3 inhibits glioma cell EMT by suppressing TGM2 (A) Western blotting analysis of the E-cadherin, N-cadherin and Vimentin levels in cells treated with RSL3 at indicated concentrations for 24h. (B) Western blotting analysis of the E-cadherin, N-cadherin and Vimentin levels in U87 cells treated with 0.1 μmol/L RSL3 for 24 h after transfected with TGM2 overexpression plasmid. (C) Western blotting analysis of the E-cadherin, N-cadherin and Vimentin levels in U87 cells treated with 0.1 μmol/L RSL3 for 24 h after transfected with TGM2 siRNA. (D–E) Wound healing assay of U87 (D) and U251 (E) cells pretreated with 0.1 μmol/L RSL3 for 24 h and then exposed to 8Gy IR. (F) Representative images and matrigel-coated transwell assay using U87 and U251 cells pretreated with 0.1 μmol/L RSL3 for 24 h before exposed to 8Gy IR. Scale bars, 50 μm. (G) Western blotting analysis of the E-cadherin, N-cadherin and Vimentin levels in U87 and U251 cells pretreated with 0.1 μmol/L RSL3 for 24 h before exposed to 8Gy IR.
Fig. 7
Fig. 7
Combination of RSL3/IR treatment synergistically inhibits the growth of glioma in vivo (A) Schematic representation of treatment schedule for U87 xenografts. 2 mg/kg RSL3 was administrated intraperitonelly 12h before exposed to 5Gy IR at day 1, 3 and 5. (B) Image of the tumor tissues of the transplanted xenogeneic model. (C) Tumor growth curve of mice for 16-day treatment. (D) The tumor weights after removed from mice at Day 16. (E) The body weights of BLAB/c mice were measured every other day for no treatment and treatment groups. (F) H&E staining of the heart, liver, spleen, lung, and kidney, 16 days following various treatments as indicated. Scale bars: 50 μm. (G) IHC analyses of tumor tissues for the expression of KI-67. Scale bars: 50 μm. (H) Western blotting analysis of the E-cadherin, N-cadherin, Vimentin, p-ATM, γ-H2AX and TGM2 levels in tumor tissues removed from mice treated by IR/RSL3 combination. ∗: P < 0.05. #: P < 0.01 versus IR or RSL3 group. ns: not significant.
Fig. 8
Fig. 8
Schematic diagram for the role of TGM2 in RSL3-induced radiosensitization of glioma. Treatment of RSL3 inactivated GPX4 and caused ROS accumulation in glioma cells. The oxidative stress triggered by excessive ROS accumulation led to the S-glutathionylation of TGM2 via upregulation of GSTP1 and resulted in proteolysis degradation of TGM2. By suppressing intracellular TGM2 level. RSL3 (1) inhibited the nuclear accumulation of TGM2 after irradiation and disturbed the interaction between TGM2 and TOPOIIα, thereby suppressing TGM2-medaitied DNA repair and enhancing IR-induced DNA DSBs. (2) increased the radiosensitivity of glioma cells to IR by inhibiting EMT. Thus, RSL3 radiosensitizes glioma cells to IR by suppressing TGM2-dependent DNA damage repair and EMT.
Supplementary Figure S1
(A) Qualification of DSBs by measuring DNA content in tails using neutral comet assay. U87 and U251 cells were pretreated with 0.1 μmol/L RSL3 for 24 h and then exposed to 8Gy IR for 0.5h. (B) The quantification of western blotting analysis of p-ATM, γ-H2AX levels in U87 and U251 cells pretreated with 0.1 μmol/L RSL3 for 24 h and then exposed to 8Gy IR for 0.5h. The intensity was normalized to that of the loading control (GAPDH). (C) The quantification of western blotting analysis of p-ATM, γ-H2AX levels in U87 and U251 cells pretreated with 500 μmol/L deferoxamine (DFO), 200 μmol/L ferric ammonium citrate (FAC) or 10 μmol/L liproxstatin-1(lip-1) for 1 h and then treated with 0.1 μmol/L RSL3 for 24 h before exposed to 8Gy IR. ∗: P < 0.05. ns: not significant.
Supplementary Figure S2
(A) The quantification of western blotting analysis of nuclear TGM2 levels in U87 cells after exposed to 8Gy IR for 0.5, 1, 2, 4 and 8h. (B) The quantification of western blotting analysis of the TOPOIIα level co-immunoprecipitated with TGM2 in U87 cells pretreated with 0.1 μmol/L RSL3 for 24 h and then exposed to 8 Gy IR for 0.5h. (C) The quantification of western blotting analysis of the nuclear TGM2 level in cells pretreated with 0.1 μmol/L RSL3 for 24 h and then exposed to 8 Gy IR for 0.5h. (D) The quantification of western blotting analysis of the p-ATM, γ-H2AX and TGM2 levels in cells treated with RSL3/IR combination with or without TGM2 knockdown. (E) The quantification of western blotting analysis of the p-ATM, γ-H2AX and TGM2 levels in cells treated with RSL3/IR combination with or without TGM2 overexpression. (F-G) Western blotting analysis of the Ku70, 53BP1, BRCA1 and Rac51 levels in cells treated with RSL3/IR combination with or without TGM2 knockdown. (H–I) Western blotting analysis of the γ-H2AX, Ku70, 53BP1 levels in cells treated with RSL3 at indicated concentrations for 24h. (J-K) Western blotting analysis of the γ-H2AX, Ku70, 53BP1 levels in cells treated with 2 μmol/L RSL3 for 24 h with or without TGM2 overexpression. ∗:P < 0.05. ∗∗: P < 0.01. ns: not significant.
Supplementary Figure S3
(A) The quantification of western blotting assay for the cytoplasmic and nuclear TGM2 levels in U87 and U251 cells treated with RSL3 at indicated concentrations for 24h. (B) The quantification of western blotting assay for the PSSG level co-immunoprecipitated with Flag-tagged TGM2 in U87 cells pretreated with 10 mmol/L DTT for 1 h before incubated with RSL3 for 24h at indicated concentrations. (C) The quantification of western blotting assay for the intracellular TGM2 levels in cells pretreated with 10 μmol/L MG132 for 1h before incubated with 0.1 μmol/L RSL3 for 24 h. (D) The quantification of western blotting assay for the PSSG level co-immunoprecipitated with Flag-tagged TGM2 in U87 cells pretreated with 5 mmol/L NAC for 1h before incubated with 0.1 μmol/L RSL3 for 24h. ∗: P < 0.05.
Supplementary Figure S4
(A-C) Western blotting and corresponding statistical analyses for the GSTP1, GRX1 and GRX2 levels in U87 and U251 cells treated with RSL3 at indicated concentrations for 24h. (D-E) The quantification of western blotting assay for the PSSG level co-immunoprecipitated with Flag-tagged TGM2 in U87 cells transfected with GSTP1 siRNA and overexpressing plasmid before incubated with 0.1 μmol/L RSL3 for 24h. (F) The quantification of western blotting assay for the PSSG level co-immunoprecipitated with Flag-tagged TGM2 in U87 cells pretreated with 10 mmol/L DTT for 1 h before incubated with 200 μmol/L H2O2 for 6h. (G) The quantification of western blotting assay for the PSSG level co-immunoprecipitated with Flag-tagged TGM2 in U87 cells transfected with GSTP1 siRNA before incubated with 200 μmol/L H2O2 for 6h. (H) The quantification of western blotting assay for the PSSG level co-immunoprecipitated with Flag-tagged TGM2 in U87 cells pretreated with 5 mmol/L NAC for 1h incubated with 200 μmol/L H2O2 for 6h. ∗: P < 0.05. ns: not significant.
figs5
Supplementary Figure S5
(A) The quantification of western blotting assay for the E-cadherin, N-cadherin and vimentin levels in U87 and U251 cells treated with RSL3 at indicated concentrations for 24h.(B–C) The quantification of western blotting assay for the E-cadherin, N-cadherin and vimentin levels in U87 cells treated with 0.1 μmol/L RSL3 for 24 h after transfected with TGM2 overexpression plasmid (B) and TGM2 siRNA (C). (D) The quantification of U87 and U251 cells that penetrated through the membrane in transwell assay. (E) The quantification of western blotting assay for the E-cadherin, N-cadherin and vimentin levels in U87 and U251 cells pretreated with 0.1 μmol/L RSL3 for 24 h before exposed to 8Gy IR. (F) The quantification of western blotting assay for the E-cadherin, N-cadherin, Vimentin, p-ATM, γ-H2AX and TGM2 levels in tumor tissues removed from mice treated by IR/RSL3 combination. ∗: P < 0.05.

Similar articles

Cited by

References

    1. Chen X., Kang R., Kroemer G., Tang D. Broadening horizons: the role of ferroptosis in cancer. Nat. Rev. Clin. Oncol. 2021;18(5):280–296. - PubMed
    1. Lei G., Mao C., Yan Y., Zhuang L., Gan B. Ferroptosis, radiotherapy, and combination therapeutic strategies. Protein Cell. 2021;12(11):836–857. - PMC - PubMed
    1. Ye L.F., Chaudhary K.R., Zandkarimi F., Harken A.D., Kinslow C.J., Upadhyayula P.S., Dovas A., Higgins D.M., Tan H., Zhang Y., Buonanno M., Wang T.J.C., Hei T.K., Bruce J.N., Canoll P.D., Cheng S.K., Stockwell B.R. Radiation-induced lipid peroxidation triggers ferroptosis and synergizes with ferroptosis inducers. ACS Chem. Biol. 2020;15(2):469–484. - PMC - PubMed
    1. Zeng L., Zheng W., Liu X., Zhou Y., Jin X., Xiao Y., Bai Y., Pan Y., Zhang J., Shao C. SDC1-TGM2-FLOT1-BHMT complex determines radiosensitivity of glioblastoma by influencing the fusion of autophagosomes with lysosomes. Theranostics. 2023;13(11):3725–3743. - PMC - PubMed
    1. Zheng W., Chen Q., Liu H., Zeng L., Zhou Y., Liu X., Bai Y., Zhang J., Pan Y., Shao C. SDC1-dependent TGM2 determines radiosensitivity in glioblastoma by coordinating EPG5-mediated fusion of autophagosomes with lysosomes. Autophagy. 2023;19(3):839–857. - PMC - PubMed

Publication types

MeSH terms

Substances

LinkOut - more resources