

Distinct physiological, transcriptomic, and imaging characteristics of asthma-COPD overlap compared to asthma and COPD in smokers
- PMID: 39580967
- PMCID: PMC11621799
- DOI: 10.1016/j.ebiom.2024.105453
Distinct physiological, transcriptomic, and imaging characteristics of asthma-COPD overlap compared to asthma and COPD in smokers
Abstract
Background: The clinical and pathological features of asthma and chronic obstructive pulmonary disease (COPD) can converge in smokers and elderly individuals as asthma-COPD overlap (ACO). This overlap challenges the diagnosis and treatment of the distinct aetiologies underlying these conditions.
Methods: We analysed 2453 smokers (≥10 pack-years), aged 45-80 years, from the Genetic Epidemiology of COPD (COPDGene) Study, stratified as Control, Asthma, COPD, and ACO based on Global Initiative for Chronic Obstructive Lung Disease (GOLD) criteria. A comprehensive assessment was performed, encompassing symptomatology, pulmonary function tests (PFTs), complete blood counts (CBCs), bulk RNA sequencing (RNA-seq), and high-resolution quantitative computed tomography (QCT) imaging to evaluate clinical impact, lung function, systemic inflammation, and structural alterations contributing to disease progression across respiratory phenotypes. Differential expression (DE) analysis was performed using whole blood RNA-seq (BH-corrected FDR < 0.01), followed by Gene Ontology (GO) and Kyoto Encyclopedia of Genes and Genomes (KEGG) pathway enrichment analysis. Group differences were assessed using the Mann-Whitney U-test (MWU) or Chi-squared test (χ2), with Bonferroni correction applied for multiple comparisons. Multivariate linear regression models were used to adjust the associations between disease status and specific clinical outcomes for confounders, with one-way ANOVA and Tukey's Honest Significant Difference (HSD) post-hoc test applied for pairwise comparisons. Our analysis aimed to delineate the extent and variability of clinical features among disease phenotypes to guide targeted therapeutic strategies.
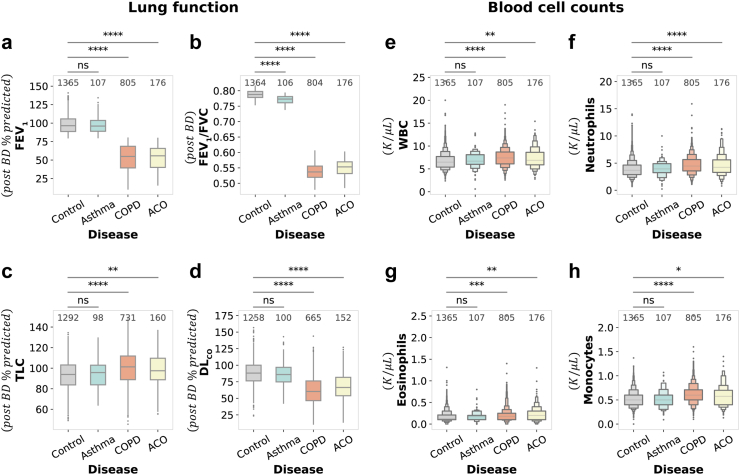
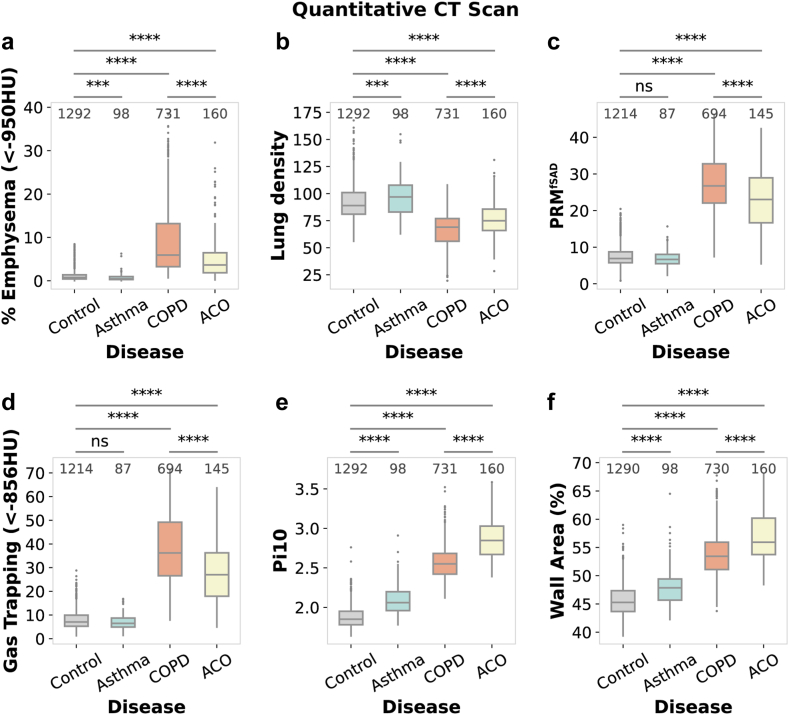
Findings: Our study highlights distinct yet overlapping profiles across ACO, asthma, and COPD. We effectively isolated disease-specific mechanisms by comparing each phenotype to smoking controls (GOLD 0) while accounting for baseline smoking-related inflammation. ACO exhibited the most severe symptom burden, with significantly higher COPD Assessment Test (CAT) score (18.32, 95% CI: [17.02, 19.63], P < 0.0001) and Modified Medical Research Council (mMRC) Dyspnea score (2.14, 95% CI: [1.92, 2.35], P < 0.0001) compared to COPD and asthma. ACO also displayed reduced lung capacity (forced expiratory volume in 1 s [FEV1]: 52.5%, 95% CI: [50.08, 54.93], P < 0.0001) and airflow limitation (FEV1/forced vital capacity [FVC]: 0.55, 95% CI: [0.5471, 0.5546], P < 0.0001), closely resembling COPD but significantly worse than asthma. The inflammatory profile of ACO exhibited a mixed response, featuring elevated neutrophil counts (4.57 K/μL, 95% CI: [4.28, 4.86], P < 0.0001) and eosinophil levels (0.22 K/μL, 95% CI: [0.20, 0.25], P < 0.01), contrasting with the predominantly neutrophilic inflammation in COPD and the absence of systemic inflammation in asthma. Structurally, ACO demonstrated significant airway remodelling (Pi10: 2.87, 95% CI: [2.83, 2.91], P < 0.0001), intermediate emphysema (5.66%, 95% CI: [4.72, 6.60], P < 0.0001), and moderate small airway disease (parametric response mapping for functional small airway disease [PRMfSAD]: 22.94%, 95% CI: [21.53, 24.34], P < 0.0001), reflecting features of both asthma and COPD. COPD was characterised by more extensive emphysema (8.9%, 95% CI: [8.34, 9.45], P < 0.0001), small airway disease (PRMfSAD: 27.09%, 95% CI: [26.51, 27.66], P < 0.0001), and gas trapping (37.34%, 95% CI: [36.33, 38.35], P < 0.0001), alongside moderate airway remodelling. At a molecular level, DE analysis revealed enrichment of the Hypoxia-Inducible Factor 1 (HIF-1) pathway in ACO, highlighting unique hypoxia-driven metabolic adaptations, while COPD was associated with neutrophil extracellular trap (NET) formation and necroptosis. In contrast, asthma exhibited significant airway remodelling (Pi10: 2.09, 95% CI: [2.05, 2.13], P < 0.0001), minimal parenchymal damage, and no systemic gene expression changes.
Interpretation: Collectively, our findings underscore the lung function impairments, systemic inflammation, molecular mechanisms, and structural correlates distinguishing ACO from COPD and asthma, emphasising the need for precise clinical management and the potential for novel therapeutic interventions.
Funding: This work was supported by National Heart, Lung, and Blood Institute (NHLBI) grants U01 HL089897 and U01 HL089856, as well as by National Institutes of Health (NIH) contract 75N92023D00011. Additional support was provided by grants R01 HL166231 (C.P.H.) and K01 HL157613 (A.S.).
Keywords: Asthma; Asthma-COPD overlap; COPD; COPDGene; Phenotypic characterisation; Pulmonary function test (PFT); Quantitative computed tomography (QCT).
Copyright © 2024 The Author(s). Published by Elsevier B.V. All rights reserved.
Conflict of interest statement
Declaration of interests S.T.W. receives royalties from UpToDate and serves on the Board of Histolix, a digital pathology company. C.P.H. reports research grants from Alpha-1 foundation, Bayer, Boehringer-Ingelheim, and Vertex, as well as consulting fees from Apogee therapeutics, Chiesi, Ono Pharma, Sanofi, and Takeda and Verona Pharma, unrelated to this manuscript. PJC reports grants from Sanofi and Bayer, as well as consulting fees from Verona Pharma and Genentech. The remaining authors declare no competing interests.
Figures


Similar articles
-
Identification of Asthma-COPD Overlap, Asthma, and Chronic Obstructive Pulmonary Disease Phenotypes in Patients with Airway Obstruction: Influence on Treatment Approach.Respiration. 2020;99(1):35-42. doi: 10.1159/000503328. Epub 2019 Nov 6. Respiration. 2020. PMID: 31694032
-
Differences in the Quantitative HRCT Characteristics of Patients with Asthma, COPD and Asthma-COPD Overlap and Their Relationships with Pulmonary Function.Int J Chron Obstruct Pulmon Dis. 2024 Aug 1;19:1775-1789. doi: 10.2147/COPD.S469956. eCollection 2024. Int J Chron Obstruct Pulmon Dis. 2024. PMID: 39104543 Free PMC article.
-
Differences in airway structural changes assessed by 3-dimensional computed tomography in asthma and asthma-chronic obstructive pulmonary disease overlap.Ann Allergy Asthma Immunol. 2018 Dec;121(6):704-710.e1. doi: 10.1016/j.anai.2018.08.006. Epub 2018 Aug 21. Ann Allergy Asthma Immunol. 2018. PMID: 30138669
-
The characteristics of the frequent exacerbators with chronic bronchitis phenotype and the asthma-chronic obstructive pulmonary disease overlap syndrome phenotype in chronic obstructive pulmonary disease patients: A meta-analysis and system review.Medicine (Baltimore). 2019 Nov;98(46):e17996. doi: 10.1097/MD.0000000000017996. Medicine (Baltimore). 2019. PMID: 31725666 Free PMC article.
-
Quantitative computed tomography measurements to evaluate airway disease in chronic obstructive pulmonary disease: Relationship to physiological measurements, clinical index and visual assessment of airway disease.Eur J Radiol. 2016 Nov;85(11):2144-2151. doi: 10.1016/j.ejrad.2016.09.010. Epub 2016 Sep 13. Eur J Radiol. 2016. PMID: 27776670 Free PMC article. Review.
Cited by
-
AutoCOPD-A novel and practical machine learning model for COPD detection using whole-lung inspiratory quantitative CT measurements: a retrospective, multicenter study.EClinicalMedicine. 2025 Apr 3;82:103166. doi: 10.1016/j.eclinm.2025.103166. eCollection 2025 Apr. EClinicalMedicine. 2025. PMID: 40242563 Free PMC article.
-
Global prevalence of cannabis and amphetamine/methamphetamine use among adolescents in 47 countries: a population-based study from WHO database.World J Pediatr. 2025 Mar;21(3):291-305. doi: 10.1007/s12519-025-00883-w. Epub 2025 Mar 20. World J Pediatr. 2025. PMID: 40108046
References
-
- Buist A.S. Similarities and differences between asthma and chronic obstructive pulmonary disease: treatment and early outcomes. Eur Respir J Suppl. 2003;39:30s–35s. - PubMed
-
- Hopkinson N.S., Molyneux A., Pink J., Harrisingh M.C., Guideline C. Chronic obstructive pulmonary disease: diagnosis and management: summary of updated NICE guidance. BMJ. 2019;366 - PubMed
MeSH terms
Substances
Grants and funding
LinkOut - more resources
Full Text Sources
Medical
Miscellaneous
