. 2024 Nov 24;12(11):e009805.
doi: 10.1136/jitc-2024-009805.

Propafenone facilitates mitochondrial-associated ferroptosis and synergizes with immunotherapy in melanoma

Affiliations

Propafenone facilitates mitochondrial-associated ferroptosis and synergizes with immunotherapy in melanoma

Qian Zhou et al. J Immunother Cancer. .

Abstract

Background: Despite the successful application of immunotherapy, both innate and acquired resistance are typical in melanoma. Ferroptosis induction appears to be a potential strategy to enhance the effectiveness of immunotherapy. However, the relationship between the status of ferroptosis and the effectiveness of immunotherapy, as well as viable strategies to augment ferroptosis, remains unclear.

Methods: A screening of 200 cardiovascular drugs obtained from the Food and Drug Administration-approved drug library was conducted to identify the potential ferroptosis sensitizer. In vitro and in vivo experiments explored the effects of propafenone on ferroptosis in melanoma. Animal models and transcriptomic analyses evaluated the therapeutic effects and survival benefits of propafenone combined with immune checkpoint blockades (ICBs). The relationship between propafenone targets and the efficacy of ICBs was validated using the Xiangya melanoma data set and publicly available clinical data sets.

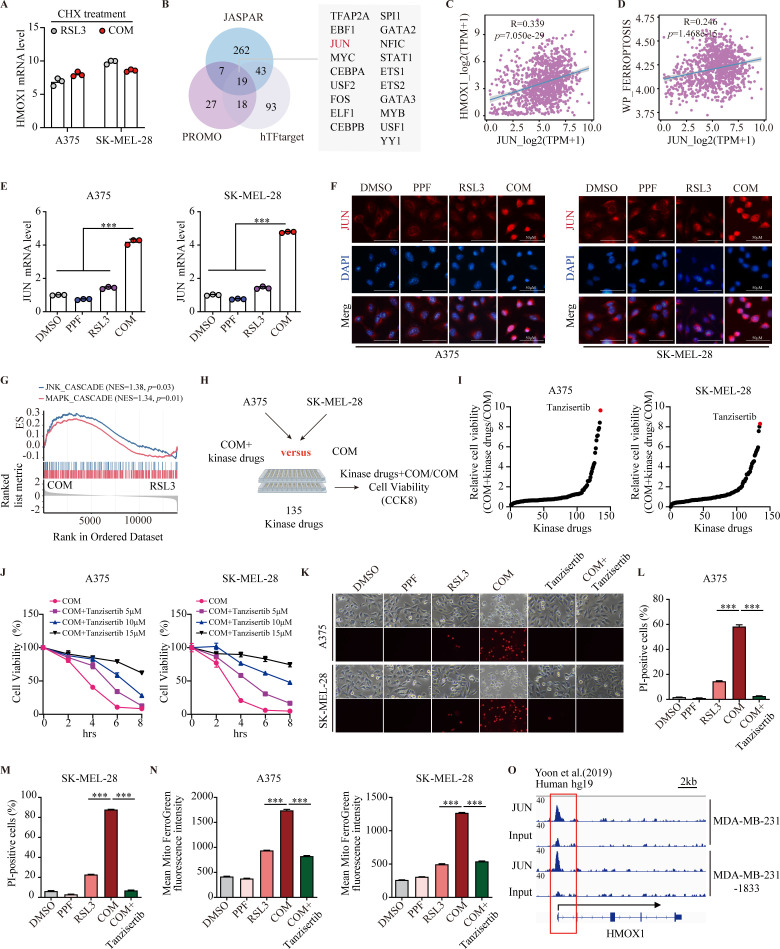
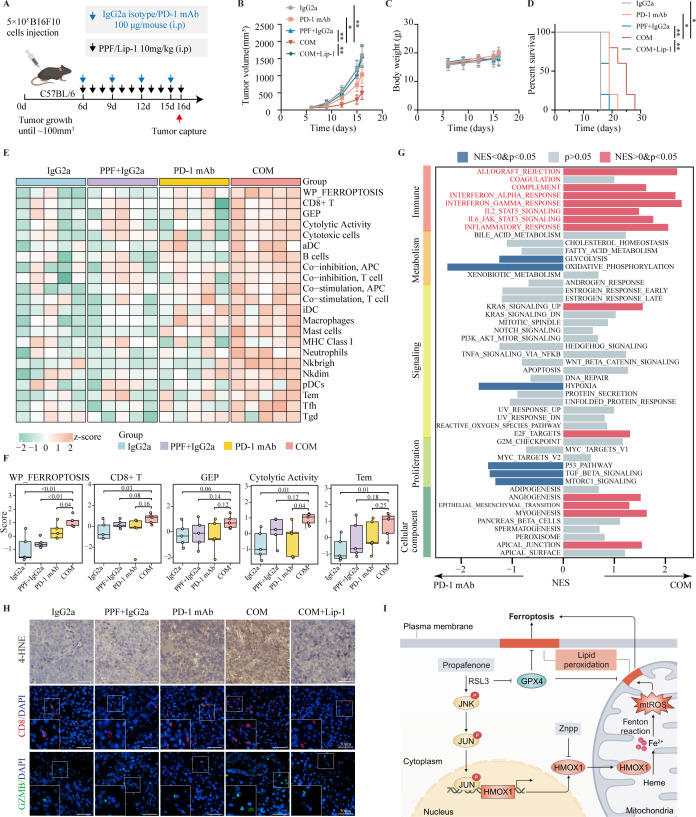
Results: Through large-scale drug screening of cardiovascular drugs, we identified propafenone, an anti-arrhythmia medication, as capable of synergizing with ferroptosis inducers in melanoma. Furthermore, we observed that propafenone, in combination with glutathione peroxidase 4 inhibitor RSL3, collaboratively induces mitochondrial-associated ferroptosis. Mechanistically, propafenone transcriptionally upregulates mitochondrial heme oxygenase 1 through the activation of the Jun N-terminal kinase (JNK)/JUN signaling pathway under RSL3 treatment, leading to overloaded ferrous iron and reactive oxygen species within the mitochondria. In xenograft models, the combination of propafenone and ferroptosis induction led to nearly complete tumor regression and prolonged survival. Consistently, propafenone enhances immunotherapy-induced tumorous ferroptosis and antitumor immunity in tumor-bearing mice. Significantly, patients exhibiting high levels of ferroptosis/JUN/HMOX1 exhibited improved efficacy of immunotherapy and prolonged progression-free survival.

Conclusions: Taken together, our findings suggest that propafenone holds promise as a candidate drug for enhancing the efficacy of immunotherapy and other ferroptosis-targeted therapies in the treatment of melanoma.

Keywords: Immunotherapy; Melanoma.


Conflict of interest statement

Competing interests: None declared.

Figures

Figure 1
Figure 1. Identification and validation of propafenone to synergize with ferroptosis inducers in melanoma. (A) Schematic of the identification of clinically applicable cardiovascular drugs that sensitize melanoma to RSL3. (B) Scatter plot shows the viability ratio of A375 and SK-MEL-28 cells treated with single-drug versus dual-drug treatment. The red plot shows propafenone (PPF). (C) Percentage of cell viability rate was presented in a series of 6×6 screening experiments in A375 and SK-MEL-28 cells. Synergy was evaluated by the Chou-Talalay Combination Index (CI) for PPF and RSL3 across the indicated cell lines. The x-axis of CI plots represents the fraction affected. (D–E) Cell morphological features (D) and cell viability (E) of A375 and SK-MEL-28 cells at different time points of treatment with DMSO, PPF, RSL3, or the combination of PPF and RSL3 (COM). PPF, 5 µM; RSL3, 2.5 µM. Images were taken at 200× magnification. (F) Clonogenic assay of A375 and SK-MEL-28 cells treated with PPF, RSL3 or a combination as indicated. (G) GPX4 protein levels were quantified by western blotting in control (sgCtrl) and GPX4 deficient (sgGPX4) cells. (H) Cell viability of sgCtrl or sgGPX4 cells treated with different concentrations of PPF for 12 hours. (I) Heatmap shows the cell viability of WM35, A375, A2058, SK-MEL-2, SK-MEL-5 and SK-MEL-28 cell lines treated with PPF, various ferroptosis inducers IKE, RSL3, ML210, ML162, and FINO2, or a combination as indicated. COM, combination; CCK-8, Cell Counting Kit-8; DMSO, dimethyl sulfoxide; FDA, Food and Drug Administration; GPX4, glutathione peroxidase 4.
Figure 2
Figure 2. Propafenone boosts glutathione peroxidase 4 inhibition-induced ferroptosis in vitro and in vivo. (A) Indicated melanoma cells were treated with PPF (5 µM), RSL3 (2.5 µM), or a combination of both drugs with or without cell death inhibitors (Z-VAD-FMK, 5 µM; necrostatin-1s (Nec-1s), 10 µM; chloroquine (CQ), 10 µM; deferoxamine (DFO), 100 µM; ferrostatin-1 (Fer-1), 4 µM) for 6 hours, and cell viability was assessed. (B–C) Cell death of A375 and SK-MEL-28 cells induced by the indicated treatment for 6 hours was shown by fluorescence microscopy and quantified by PI-staining coupled with flow cytometry. Representative images are presented at 200× magnification. (D–F) Lipid peroxidation was quantified with BODIPY-C11 using flow cytometry. Cells were treated as indicated for 3 hours. (G) The relative levels of glutathione were assayed in A375 and SK-MEL-28 cells after indicated treatment for 3 hours. (H) Cell viability of sgCtrl or sgGPX4 cells treated with different concentrations of PPF for 12 hours in the absence or presence of Fer-1 (4 µM). (I–K) BALB/c nude mice were injected with SK-MEL-28 cells and treated with PPF (10 mg/kg, every day) or RSL3 (50 mg/kg, intratumorally, every 3 days) as indicated when the tumor size reached approximately 100 mm3 (I). Tumor volume (J), and body weight (K) in the indicated groups. (L) Survival curves of SK-MEL-28 tumor-bearing mice treated as indicated. (M–O) BALB/c nude mice were injected with sgCtrl or sgGPX4 A375 cells and treated with PPF (10 mg/kg) and vehicle intraperitoneally every day as indicated. Lip-1 was given 10 mg/kg intraperitoneally every day (M). Tumor weight (N), and tumor volume (O) in the indicated groups. n=5 per group. P values were calculated using one-way analysis of variance analysis in A–G and N, or mixed effects models in J and O, or log-rank test in L. ns, p>0.05; *p<0.05; **p<0.01; ***p<0.001. COM, combination; DMSO, dimethyl sulfoxide; GPX4, glutathione peroxidase 4; GSH, glutathione; i.t, intratumorally; i.p, intraperitoneally; Lip-1, liproxstatin-1; PI, propidium iodide; PPF, propafenone.
Figure 3
Figure 3. Propafenone combination with RSL3 collaboratively triggers mitochondrial-associated ferroptosis. (A) Transmission electron microscopy images of A375 cells after the indicated treatment for 3 hours. PPF, 5 µM; RSL3, 2.5 µM. Scale bar, upper, 2 µm; lower, 500 nm. (B–C) Mitochondrial membrane potential (B) or mitochondrial ROS (C) was determined in A375 and SK-MEL-28 cells after indicated treatment for 3 hours by flow cytometry using JC-1 staining or Mito-SOX red fluorescence probe, respectively. (D) Dose response of RSL3-induced death of PPF-treated A375 and SK-MEL-28 cells in the presence of TEMPO (20 µM) or Mito-TEMPO (10 µM) for 6 hours. (E–F) Mito-lipid peroxidation (E) and PTGS2 mRNA (F) were measured in A375 and SK-MEL-28 cells after the indicated treatment for 3 hours. PPF, 5 µM; RSL3, 2.5 µM. TEMPO, 20 µM; Mito-TEMPO, 10 µM. (G) Western blotting showing GPX4 protein levels in sgGPX4 A375 cells that overexpress the cytosolic or mitochondrial GPX4. (H) Cell viability measurement in sgGPX4 A375 cells that express the indicated GPX4 constructs treated with different doses of PPF for 6 hours. (I) Relative levels of overall cellular ferrous iron were assessed in A375 and SK-MEL-28 cells after the indicated treatment for 3 hours. (J) Mitochondrial ferrous iron levels were assessed by fluorescence microscopy using Mito-FerroGreen (green) in A375 cells after the indicated treatment for 1 hour. PPF, 5 µM; RSL3, 2.5 µM; DFO, 100 µM. Mitochondria stained with Mito-Tracker (red). Nuclei counterstained by Hoechst (blue). Scale bar, 100 µm. (K) Mitochondrial ferrous iron levels were assessed by flow cytometry using Mito-FerroGreen in A375 and SK-MEL-28 cells after the indicated treatment for 1 hour. Then the mean Mito-FerroGreen fluorescence intensity of each cell was quantified. P values were calculated using one-way analysis of variance analysis. ns, p>0.05; ***p<0.001. COM, combination; DFO, deferoxamine; DMSO, dimethyl sulfoxide; GPX4, glutathione peroxidase 4; mRNA, messenger RNA; PPF, propafenone; PTGS2, prostaglandin-endoperoxide synthase 2; ROS, reactive oxygen species; TEMPO, 2,2,6,6-tetramethylpiperidin-1-oxyl.
Figure 4
Figure 4. Propafenone facilitates mitochondria-associated ferroptosis through synergistic upregulation of HMOX1 when combined with RSL3. (A) Volcano plots of RNA sequencing data showing the most differentially expressed genes in combination versus DMSO (left), combination versus PPF (median), and combination versus RSL3 (right). Significantly expressed genes above and below 1.5-fold are shown in red and blue, respectively; PPF, 5 µM; RSL3, 2.5 µM. (B) Venn diagram showing the overlap of common differentially expressed upregulated genes and mitochondrial iron metabolism-related genes identified from GeneCards. (C) Heatmap represents the normalized expression of five genes in each group. (D) Real-time PCR analysis of HMOX1 mRNA levels in A375 and SK-MEL-28 cells after the indicated treatment for 3 hours. (E–F) Western blotting showing HMOX1 protein levels in whole cell and mitochondrial fractions from A375 (E) and SK-MEL-28 cells (F) after indicated treatment for 3 hours. PPF, 5 µM; RSL3, 2.5 µM. (G) Gene Set Enrichment Analysis showing the enrichment of response to endoplasmic reticulum stress pathway (blue) and heme metabolism pathway (red) between co-treatment group and RSL3 group in RNA sequencing. (H) HMOX1 was positively correlated with WP_ferroptosis score using Spearman’s correlation in cell lines from the Cancer Cell Line Encyclopedia database. (I) Relative cell viability of indicated cells treated with DMSO, 20 µM or 30 µM hemin in the presence of RSL3 for 6 hours. (J) Mitochondrial ferrous iron levels were assessed by fluorescence microscopy using Mito-FerroGreen (green) in A375 cells after the indicated treatment for 1 hour. PPF, 5 µM; RSL3, 2.5 µM; ZnPP, 10 µM. Mitochondria stained with Mito-Tracker (red). Nuclei counterstained by Hoechst (blue). Scale bar, 100 µm. (K) Mitochondrial ferrous iron levels were assessed by flow cytometry using Mito-FerroGreen in A375 and SK-MEL-28 cells after the indicated treatment for 1 hour. (L–M) Mito-lipid peroxidation (L) and lipid peroxidation (M) were measured by flow cytometry in A375 and SK-MEL-28 cells after the indicated treatment for 3 hours. (N) Dose-response of RSL3-induced death of DMSO or PPF-treated A375 and SK-MEL-28 cells in the absence or presence of ZnPP for 6 hours. (O) Cell viability of shCtrl and shHMOX1 A375 and SK-MEL-28 cells following PPF and RSL3 co-treatment for 3 hours. P values were calculated using one-way ANOVA analysis in D,I, k, L and M or two-way ANOVA analysis in O. *p<0.05; ***p<0.001. ANOVA, analysis of variance; COM, combination; DMSO, dimethyl sulfoxide; HMOX1, heme oxygenase 1; PPF, propafenone; TPM, transcripts per million; ZnPP, zinc protoporphyrin IX.
Figure 5
Figure 5. JNK/JUN signaling-mediated HMOX1 upregulation promotes mitochondria-associated ferroptosis. (A) Relative mRNA levels of HMOX1 in A375 and SK-MEL-28 cells treated with RSL3 alone or in combination with PPF, compared with the DMSO group, were assessed in the presence of CHX (5 µg/mL). (B) Venn diagram showing the putative upstream transcription factors of HMOX1 predicted by JASPAR, PROMO, and hTFtarget databases. (C) Correlation between JUN and HMOX1 using Spearman’s correlation in cell lines from the CCLE database. (D) Correlation between JUN and WP_ferroptosis score using Spearman’s correlation in cell lines from the CCLE database. (E) JUN mRNA level in A375 and SK-MEL-28 cells after indicated treatment. (F) A375 and SK-MEL-28 cells were treated with PPF, RSL3 or a combination for 3 hours and subjected to immunofluorescence microscopy with antibodies against JUN. Nuclei counterstained by DAPI (blue). Scale bar, 50 µm. (G) GSEA shows the enrichment of the JNK cascade pathway (blue) and MAPK pathway (red) between the co-treatment group and the RSL3 group in RNA sequencing. (H–I) The relative viability of A375 and SK-MEL-28 cells treated with the combination of PPF and RSL3 with or without compounds from the kinase drug library for 6 hours. Specific compounds are annotated. (J) Cell viability of A375 and SK-MEL-28 cells at different time points after co-treatment of PPF and RSL3 in the absence or presence of tanzisertib (5 µM, 10 µM or 15 µM). (K–M) Cell death of A375 and SK-MEL-28 cells induced by the indicated treatment for 6 hours was shown using fluorescence microscopy and quantified by PI-staining coupled with flow cytometry. Representative images are presented at 200× magnification. PPF, 5 µM; RSL3, 2.5 µM; tanzisertib, 10 µM. (N) Mitochondrial ferrous iron levels were assessed by flow cytometry in A375 and SK-MEL-28 cells after the indicated treatment for 1 hour. (O) Genome browser view of binding peaks on the HMOX1 promoter in JUN ChIP and input control of MDA-MB-231 cells and MDA-MB-231–1833 cells based on data from GSE112444. P values were calculated using one-way analysis of variance analysis. ***p<0.001. CCK-8, Cell Counting Kit-8; CCLE, Cancer Cell Line Encyclopedia; ChIP, chromatin immunoprecipitation; CHX, cycloheximide; COM, combination; DMSO, dimethyl sulfoxide; GSEA, Gene Set Enrichment Analysis; HOMX1, heme oxygenase 1; JUN/JNK, Jun N-terminal kinase (JNK)/JUN; MDA, malondialdehyde; mRNA, messenger RNA; NES, normalized enrichment score; PI, propidium iodide; PPF, propafenone; TPM, transcripts per million.
Figure 6
Figure 6. Enhanced efficacy of immunotherapy combined with propafenone in vivo. (A) Heatmap showing the WP_ferroptosis score and normalized ferroptosis-related pathway enrichment scores of each sample calculated by single-sample Gene Set Enrichment Analysis (Ribas’s cohort, n=437). (B) VlnPlot showing the differences of WP_ferroptosis, JUN and HMOX1 between responses to the immunotherapy group and non-responses to the immunotherapy group. (C) The proportion of patients with different responses to immunotherapy in the melanoma immune checkpoint inhibitor (ICI) cohort (PRJEB23709). (D) Kaplan-Meier curves compare progression-free survival (PRJEB23709; ICI cohorts) between the high WP_ferroptosis/JUN/HMOX1 and low WP_ferroptosis/JUN/ HMOX1 groups. (E) The differences in immunotherapy outcome-related scores between high WP_ferroptosis/JUN/HMOX1 and low WP_ferroptosis/JUN/ HMOX1 groups. (F) Schedule for administration of PPF (10 mg/kg) or anti-PD-1 (100 µg/per mouse) in YUMM1.7 tumor-bearing C57BL/6 mice. (G–I) Tumor volume (G), body weight (H), and survival curves (I) in the indicated groups. n=5 per group. Statistical significance was assessed using the Fisher’s exact test/χ2 test in C, or log-rank test in D and I, or mixed-effects models in G. Wilcoxon rank-sum test was used in E. ns, p>0.05; *p<0.05, **p<0.01, and ***p<0.001. BCR, B-cell receptor; COM, combination; CTL, cytotoxic T lymphocytes; CYT, cytolytic activity; GEP, gene expression profile; HMOX1, heme oxygenase 1; IFN, interferon; i.p, intraperitoneally; JUN, Jun proto-oncogene; mAb, monoclonal antibody; PD-1, programmed cell death 1; PPF, propafenone; MDSC, myeloid-derived suppressor cells; TAM, tumor-associated macrophages; TCR, T-cell receptor.
Figure 7
Figure 7. Propafenone enhances the efficacy of immunotherapy through ferroptosis. (A) Schedule for administration of PPF (10 mg/kg), anti-PD-1 (100 µg/per mouse) or Lip-1 (10 mg/kg) in B16F10 tumor-bearing C57BL/6 mice. (B–D) Tumor volume (B), body weight (C), and survival curves (D) in the indicated groups. n=5 per group. (E) Heatmap showing the normalized WP_ferroptosis score and immune infiltration pathway enrichment scores of each sample calculated by single-sample Gene Set Enrichment Analysis (mice tumor, n=20). (F) WP_ferroptosis pathway scores, CD8+ cell infiltration levels, T-cell inflammatory gene expression profile, cytolytic activity, and effector memory T-cell infiltration levels in the indicated groups. (G) Bar plot showing the enrichment level of 50 cancer hallmark gene sets between the combination group and anti-PD-1 group. (H) Representative images of immunohistochemistry and immunofluorescence staining of 4-HNE, CD8+ and GZMB+ cells in B16F10 tumors after indicated treatment. Scale bars=50 µm. (I) A schematic diagram about the mechanism of co-treatment with PPF and RSL3 in mitochondria-associated ferroptosis induction. Statistical significance was assessed using mixed-effects models in B, or log-rank test in D, or Bonferroni correction in F. ns, p>0.05; *p<0.05; **p<0.01; ***p<0.001. COM, combination; GEP, gene expression profile; GPX4, glutathione peroxidase 4; HMOX1, heme oxygenase 1; i.p, intraperitoneally; JNK, Jun N-terminal kinase; JUN, Jun proto-oncogene proto-oncogene; Lip-1, liproxstatin-1; mAb monoclonal antibody; NES, normalized enrichment score; PD-1, programmed cell death 1; PPF, propafenone; Tem, effector memory T cell; ZnPP, zinc protoporphyrin IX.

References

    1. Wang M, Li S, Wang Y, et al. Gambogenic acid induces ferroptosis in melanoma cells undergoing epithelial-to-mesenchymal transition. Toxicol Appl Pharmacol. 2020;401:115110. doi: 10.1016/j.taap.2020.115110. - DOI - PubMed
    1. Hangauer MJ, Viswanathan VS, Ryan MJ, et al. Drug-tolerant persister cancer cells are vulnerable to GPX4 inhibition. Nature New Biol. 2017;551:247–50. doi: 10.1038/nature24297. - DOI - PMC - PubMed
    1. Tsoi J, Robert L, Paraiso K, et al. Multi-stage Differentiation Defines Melanoma Subtypes with Differential Vulnerability to Drug-Induced Iron-Dependent Oxidative Stress. Cancer Cell. 2018;33:890–904. doi: 10.1016/j.ccell.2018.03.017. - DOI - PMC - PubMed
    1. Liao P, Wang W, Wang W, et al. CD8+ T cells and fatty acids orchestrate tumor ferroptosis and immunity via ACSL4. Cancer Cell. 2022;40:365–78. doi: 10.1016/j.ccell.2022.02.003. - DOI - PMC - PubMed
    1. Wang W, Green M, Choi JE, et al. CD8+ T cells regulate tumour ferroptosis during cancer immunotherapy. Nature New Biol. 2019;569:270–4. doi: 10.1038/s41586-019-1170-y. - DOI - PMC - PubMed