

Impact of pulse pressure variability evaluated by visit-to-visit on heart failure events in patients with hypertension: insights from the SPRINT trial
- PMID: 39582008
- PMCID: PMC11587737
- DOI: 10.1186/s40001-024-02164-0
Impact of pulse pressure variability evaluated by visit-to-visit on heart failure events in patients with hypertension: insights from the SPRINT trial
Abstract
Objectives: In adult hypertensive patients, blood pressure variability is considered a risk factor for heart failure. The relationship between pulse pressure variability and the risk of heart failure remains unclear. This study aims to explore the impact of pulse pressure variability (PPV) on heart failure through a secondary analysis of the SPRINT randomized controlled trial.
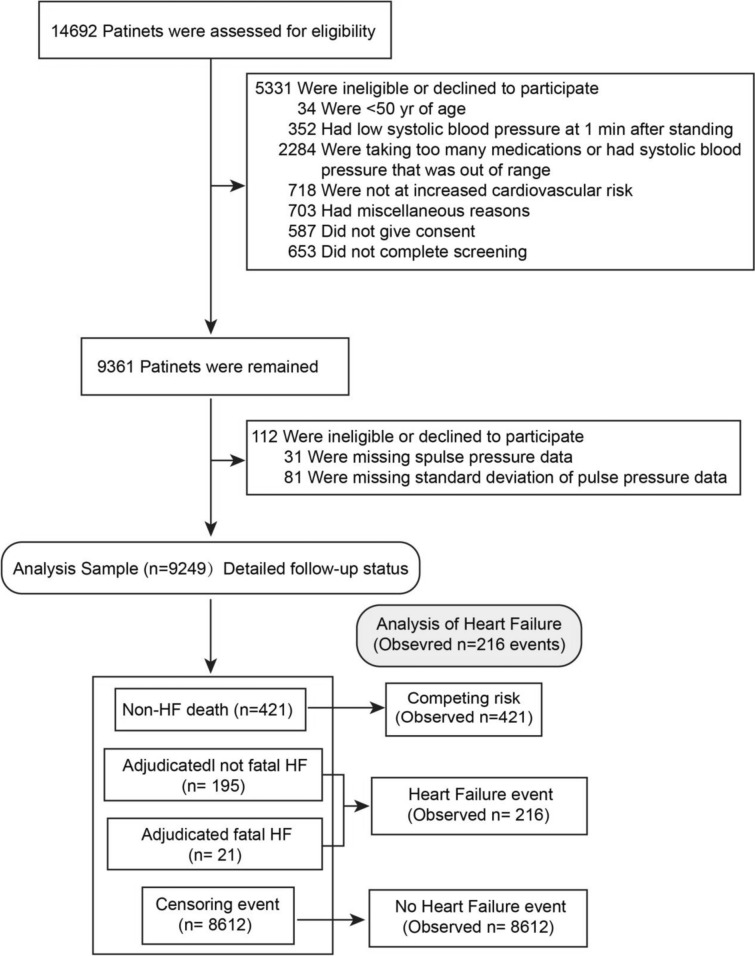
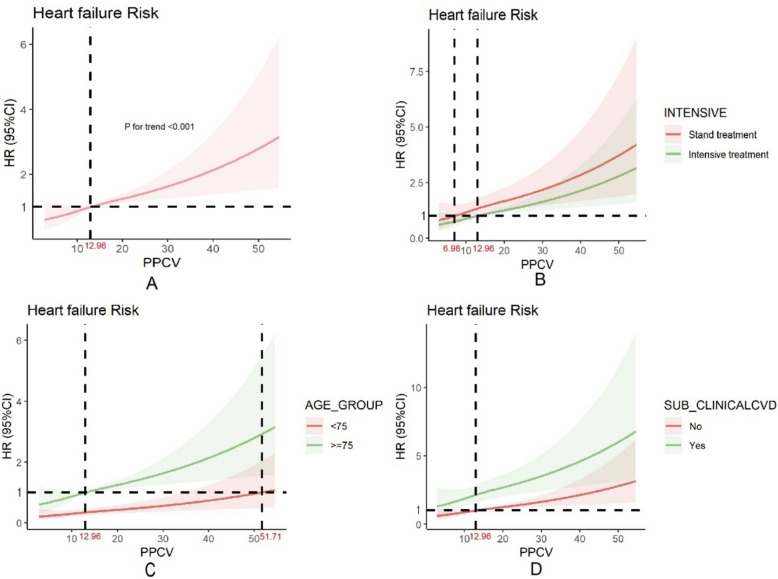
Methods: The data were derived from the SPRINT (Systolic Blood Pressure Intervention Trial) study. The trial recruited participants 50 years or older, with SBP ≥ 130 mm Hg and at least one additional CVD risk factor. We calculated pulse pressure based on the systolic and diastolic blood pressure obtained during follow-up, and used the coefficient of variation to represent pulse pressure variability (PPV) for statistical analysis. We considered the incidence of acute decompensated heart failure as the outcome measure. We employed multivariable Cox regression analysis to examine the relationship between PPV and the risk of heart failure occurrence. Additionally, we used a restricted cubic spline model to analyze the dose-response relationship between PPV and the risk of heart failure occurrence.
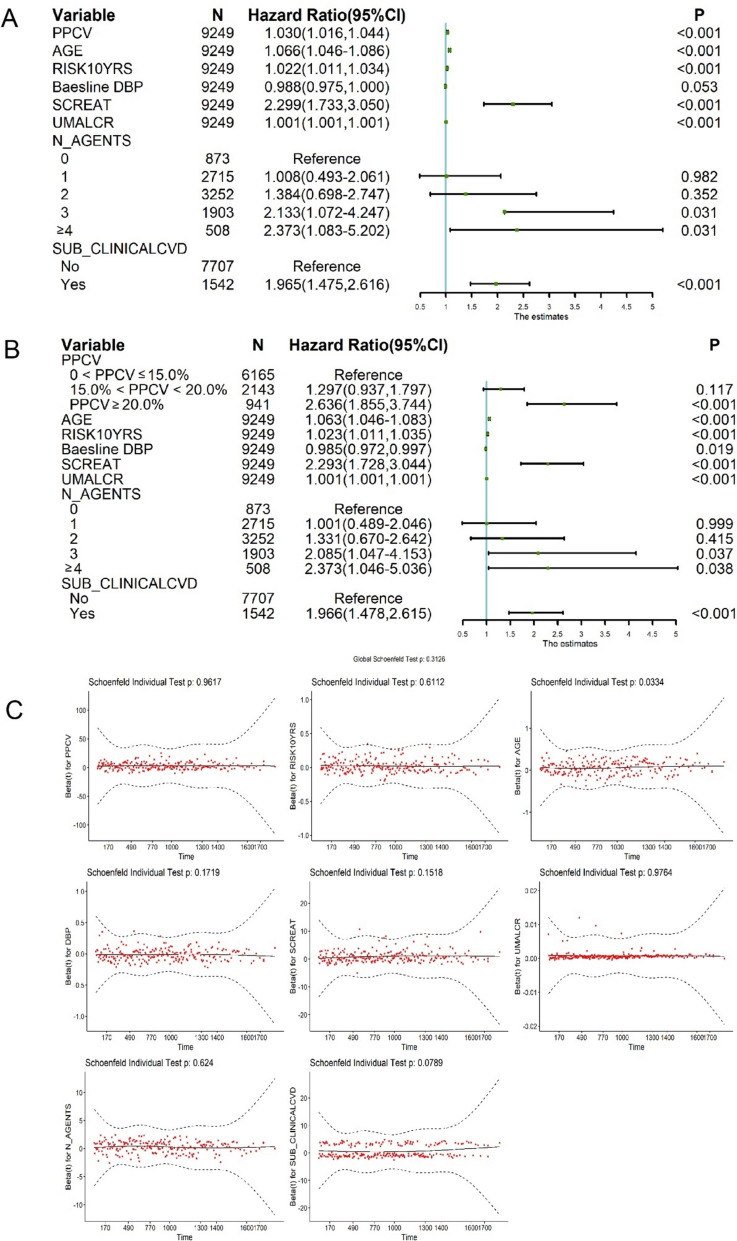
Results: In this study, a total of 9429 participants were included. During a median follow-up time of 3.87 years, 188 new cases of heart failure were observed. The mean age of the study population was 67.9 ± 9.4 years and 3382 participants (35.5%) were females. The average PPCV was 13.85 ± 5.37%. The results from the multivariable Cox regression analysis indicated that the risk of heart failure increased by 3% for every 1% increase in PPCV (HR = 1.030 [95% CI 1.016-1.044]; P < 0.001).
Conclusions: The study found that PPV is an independent risk factor for the occurrence of heart failure. This underscores the importance of maintaining long-term stability in pulse pressure, in preventing the development of heart failure.
Keywords: Coefficient; Heart failure; Hypertension; Pulse pressure variability; Risk prediction.
© 2024. The Author(s).
Conflict of interest statement
Declarations. Ethics approval and consent to participate: This study was approved by the Ethics Committee of Zhejiang Chinese Medical University. Consent for publication: Not applicable. Competing interests: The authors declare no competing interests.
Figures
Similar articles
-
Systolic and diastolic blood pressure time in target range and cardiovascular outcomes in patients with hypertension and pre-frailty or frailty status.J Clin Hypertens (Greenwich). 2024 May;26(5):514-524. doi: 10.1111/jch.14797. Epub 2024 Mar 29. J Clin Hypertens (Greenwich). 2024. PMID: 38552135 Free PMC article. Clinical Trial.
-
Applicability and cost-effectiveness of the Systolic Blood Pressure Intervention Trial (SPRINT) in the Chinese population: A cost-effectiveness modeling study.PLoS Med. 2021 Mar 4;18(3):e1003515. doi: 10.1371/journal.pmed.1003515. eCollection 2021 Mar. PLoS Med. 2021. PMID: 33661907 Free PMC article. Clinical Trial.
-
Potential Deaths Averted and Serious Adverse Events Incurred From Adoption of the SPRINT (Systolic Blood Pressure Intervention Trial) Intensive Blood Pressure Regimen in the United States: Projections From NHANES (National Health and Nutrition Examination Survey).Circulation. 2017 Apr 25;135(17):1617-1628. doi: 10.1161/CIRCULATIONAHA.116.025322. Epub 2017 Feb 13. Circulation. 2017. PMID: 28193605 Free PMC article.
-
Heart Failure Primary Prevention: What Does SPRINT Add?: Recent Advances in Hypertension.Hypertension. 2021 Jun;77(6):1804-1814. doi: 10.1161/HYPERTENSIONAHA.121.16503. Epub 2021 Apr 5. Hypertension. 2021. PMID: 33813850 Free PMC article. Review.
-
Blood pressure targets in adults with hypertension.Cochrane Database Syst Rev. 2020 Dec 17;12(12):CD004349. doi: 10.1002/14651858.CD004349.pub3. Cochrane Database Syst Rev. 2020. PMID: 33332584 Free PMC article.
References
-
- Olsen MH, Angell SY, Asma S, Boutouyrie P, Burger D, Chirinos JA, et al. A call to action and a lifecourse strategy to address the global burden of raised blood pressure on current and future generations: the Lancet Commission on hypertension. Lancet. 2016;388(10060):2665–712. - PubMed
Publication types
MeSH terms
Substances
Grants and funding
- 2023YFC3606200/Research Center for the Development of Medicine and Health Science and Technology of the National Health Commission
- No.2023ZL360/Zhejiang Provincial Health Commission
- No.2024KY1195/Zhejiang Provincial Health Commission
- 2023C25012/the Department of Science and Technology of Zhejiang Province
LinkOut - more resources
Full Text Sources
Medical
