. 2024 Nov 24;15(11):856.
doi: 10.1038/s41419-024-07179-3.

Enhancing mitochondrial one-carbon metabolism is neuroprotective in Alzheimer's disease models

Affiliations

Enhancing mitochondrial one-carbon metabolism is neuroprotective in Alzheimer's disease models

Yizhou Yu et al. Cell Death Dis. .

Abstract

Alzheimer's disease (AD) is the most common form of age-related dementia. In AD, the death of neurons in the central nervous system is associated with the accumulation of toxic amyloid β peptide (Aβ) and mitochondrial dysfunction. Mitochondria are signal transducers of metabolic and biochemical information, and their impairment can compromise cellular function. Mitochondria compartmentalise several pathways, including folate-dependent one-carbon (1C) metabolism and electron transport by respiratory complexes. Mitochondrial 1C metabolism is linked to electron transport through complex I of the respiratory chain. Here, we analysed the proteomic changes in a fly model of AD by overexpressing a toxic form of Aβ (Aβ-Arc). We found that expressing Aβ-Arc caused alterations in components of both complex I and mitochondrial 1C metabolism. Genetically enhancing mitochondrial 1C metabolism through Nmdmc improved mitochondrial function and was neuroprotective in fly models of AD. We also found that exogenous supplementation with the 1C donor folinic acid improved mitochondrial health in both mammalian cells and fly models of AD. We found that genetic variations in MTHFD2L, the human orthologue of Nmdmc, were linked to AD risk. Additionally, Mendelian randomisation showed that increased folate intake decreased the risk of developing AD. Overall, our data suggest enhancement of folate-dependent 1C metabolism as a viable strategy to delay the progression and attenuate the severity of AD.


Conflict of interest statement

Competing interests: YY is an inventor on a filed patent that is related to enhancing folate one-carbon metabolism to protect against Alzheimer’s disease. YY is a founder and holds equity in Healthspan Biotics.

Figures

Fig. 1
Fig. 1. Expression of a toxic form of Aβ increases components of 1C metabolism and mitochondrial respiration.
a Workflow employed for the identification of protein changes in adult flies expressing toxic Aβ-Arc. For each genotype, proteins from 5 samples of 30 male flies aged for 10 days after eclosion were compared. Significance was determined using a linear mixed model moderated by empirical Bayes methods. Multiple comparisons were adjusted using the Benjamin‒Hochberg method. b PCA of the proteins that were altered upon expression of toxic Aβ-Arc in adult flies. c Pathway analysis of the top proteins (299 proteins) selected by PC1 in the unsupervised PCA. The analysis was performed based on UniProt functional enrichment (see also Materials and Methods). Significant pathways are on the left side, and only proteins linked to the enriched pathways are shown (17 proteins). The symbols beside the protein names indicate the pathway they belong to. Protein subunits of mitochondrial respiratory complex I are highlighted in bold. All protein levels were significantly changed, with the proteins with increased levels in red and those with decreased levels in blue, respectively. d Alterations in protein composition of mitochondrial respiratory complex, mapped at the individual subunit level of the respiratory complexes (I, II, III or IV). Red and blue indicate subunits with protein levels that are, respectively, increased and decreased. Subunits labelled in grey represent protein levels that were not significantly altered. Genotypes: w; +; daGal4/+ (Control), w; UAS Aβ42Arc/+; daGal4/+ (Aβ-Arc).
Fig. 2
Fig. 2. Expression of Aβ-Arc decreases mitochondrial complex I activity and folate levels.
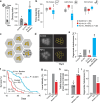
a Mitochondrial complex I activity is decreased in flies expressing toxic Aβ-Arc (means ± SDs; asterisks, two-tailed Student’s t test). b Expression of Aβ-Arc does not affect overall mitochondrial mass. Mitochondrial mass was assessed by measuring the activity of the mitochondrial matrix enzyme citrate synthase in adults (NS, P > 0.05, two-tailed unpaired t test compared to control). c Increased NADH levels in the heads of Aβ-expressing flies (means ± SDs; asterisks, two-tailed Student’s t test). d Fold-changes in metabolite abundance upon expression of Aβ-Arc in flies. Blue corresponds to metabolites that were significantly downregulated. ND corresponds to a metabolite below the detection threshold. Enzymes that were upregulated in Aβ-Arc-expressing flies are shown in red. The metabolite levels are shown to the right of each individual chemical entity. The statistical significance was determined using Welch’s two-sample t-test (n = 8). e Analysis of MTHFD2L expression levels in clustered neurons from both AD patients and controls. Cells are represented by dots and the expression level of MTHFD2L is represented as a two-colour heatmap. Data were obtained from a study by Otero-Garcia and colleagues [25]. f Neurons derived from AD patients have a higher expression of MTHFD2L (β = 0.37, standard error = 0.12, P = 0.008, linear regression). Supplementary analysis with additional covariates and a linear mixed model accounting for the different patients were performed (see GitHub repository: https://m1gus.github.io/AD-FA/). g Analysis of MTHFD2L protein levels in the brains of AD patients (median with interquartile range; asterisks, two-tailed Student’s t test). Data were obtained from a proteomics study on AD patients [75]. h Upregulation of the Nmdmc transcript in the heads of Aβ-expressing flies (means ± SD; asterisks, two-tailed Student’s t test). i Levels of Nmdmc protein are not altered in Aβ-expressing flies. Protein levels were measured by mass spectrometry (means ± SD; asterisks, two-tailed Student’s t-test). Neuronal expression of Nmdmc in adult flies increases Δψm in the brain (j, means ± SD; asterisks, two-tailed unpaired t test); alters the percentage of time spent asleep during the light and dark phases (k, asterisks, two-tailed unpaired t test) and increases the lifespan of adult flies (l, log-rank, Mantel–Cox test). Genotype: (a, b, c, h, j, k and l) elavGal4; +;+ (Control), elavGal4; UAS Aβ42Arc/+; + (Aβ-Arc) and elavGal4; UAS-Nmdmc/+ ;+ (Nmdmc) ; (d and i) w; +; daGal4/+ (Control), w; UAS Aβ42Arc/+; daGal4/+ (Aβ-Arc).
Fig. 3
Fig. 3. Mitochondrial defects caused by Aβ toxicity are reduced by Nmdmc.
a Mitochondrial 1C folate metabolism. Dhfr reduces folate to dihydrofolic acid (DHF) and subsequently to THF. The NAD-dependent methylenetetrahydrofolate dehydrogenase (Nmdmc) protein converts 5,10-methylene-THF to 5,10-methenyl-THF and 10-formyl-THF in 2 steps, reducing the cofactor nicotinamide adenine dinucleotide phosphate (NAD(P)+) to NAD(P)H. Mitochondrial complex I oxidises NADH to NAD+ to translocate protons. For simplicity, some intermediate metabolites and enzymes are missing from this illustration. Red and blue correspond to metabolites or proteins with levels that were, respectively, significantly increased or decreased. Subunits of the mitochondrial complex I are shown as circles and follow the same colour convention. b Neuronal expression of Nmdmc improves complex I function in flies expressing Aβ-Arc (mean ± SD; asterisks, one-way ANOVA with Dunnett’s multiple comparison test, comparisons were relative to Aβ-Arc). c Improvement of Δψm in the brain following the expression of Nmdmc in Aβ-Arc-expressing flies (mean ± SD; asterisks, one-way ANOVA with Dunnett’s multiple comparison test, comparisons were relative to Aβ-Arc). The increase in mitochondrial ROS in the brains of Aβ-Arc flies is suppressed by the expression of Nmdmc. Representative confocal images (d) and quantitative analysis (e) of mitochondrial ROS using the MitoSOX Red fluorescent indicator in the indicated genotypes are shown (means ± SDs; asterisks, one-way ANOVA with Dunnett’s multiple comparison test, dots correspond to biological replicates i.e., brains). The intensity levels are visualised using a five-tone heatmap. f, g ultrastructural analysis of adult brains in control and Aβ-Arc expressing flies showing mitochondria with fragmented cristae in neuropiles (m, mitochondria) caused by the expression of Aβ-Arc. Representative TEM micrographs of the indicated genotypes are shown (g). f Percentages of mitochondria in the neuropiles that exhibited fragmented cristae (asterisks, two-tailed chi-square test, 95% confidence interval). Genotype: (bg) Genotypes: elavGal4; +; + (Control), elavGal4; +; UAS Aβ42Arc/+ (Aβ-Arc), elavGal4; UAS Nmdmc/+; UAS Aβ42Arc/+ (Aβ-Arc, Nmdmc).
Fig. 4
Fig. 4. Neurodegeneration in fly models of AD is reduced by Nmdmc.
a Flies expressing Aβ-Arc exhibited motor impairment. Expression of Nmdmc suppresses this locomotor defect (asterisks, one-way ANOVA with Dunnett’s multiple comparison test). b Expression of Nmdmc rescues the total percentage of time spent asleep, as well as sleep during the light phase in Aβ-Arc-expressing flies (asterisks, pairwise t test with the Benjamini‒Hochberg correction for multiple comparison). c An illustration of the typical layout of the visible photoreceptors (yellow, R1–R7) at the surface of the adult Drosophila ommatidia (grey hexagon). d Pseudopupil images from control and Aβ-Arc expressing flies. In the control ommatidia, seven rhabdomeres are visible (illustrated as yellow circles in the panel on the right). Neurodegeneration in Aβ-Arc resulted in ommatidia with a lower number of visible rhabdomeres. e Quantitation of the percentage of neurodegeneration of the photoreceptor cells in Aβ-expressing flies with up- or downregulation of Nmdmc (asterisks, two-tailed chi-square test, 95% confidence interval). f Neuronal expression of Nmdmc increases the lifespan of Aβ-Arc-expressing flies (log-rank, Mantel–Cox test). Increasing Nmdmc levels in tau-expressing flies reduces larval lethality (g, asterisks, two-tailed chi-square test, 95% confidence interval), improves Δψm (h, means ± SDs; asterisks, two-tailed unpaired t test) and decreases neurodegeneration (i, asterisks, two-tailed chi-square test, 95% confidence interval). Genotypes: elavGal4; +; + (Control), elavGal4; +; UAS Aβ42Arc/+ (Aβ-Arc), elavGal4; UAS Nmdmc/+; UAS Aβ42Arc/+ (Aβ-Arc, Nmdmc), elavGal4; +; UAS Tau0N4R/+ (Tau) and elavGal4; UAS Nmdmc/+; UAS Tau0N4R/+ (Nmdmc,Tau).
Fig. 5
Fig. 5. Higher MTHFD2L levels in neurons decreases AD risk.
a MR uses SNPs to infer the causal effect of MTHFD2L expression on AD risk. MR uses genetic variants (SNPs in grey) that are associated with an exposure (MTHFD2L in red) as instrumental variables to evaluate the causal effect of that exposure on an outcome (AD risk in blue). Mendelian randomisation shows that higher MTHFD2L expression decreases AD risk in excitatory (b, β = −0.022, standard error = 0.0045, P < 0.00001, 337 SNPs, inverse variance weighted model) and inhibitory neurons (c, β = −0.012, standard error = 0.0042, P = 0.006, 154 SNPs, inverse variance weighted model).
Fig. 6
Fig. 6. FiA improves mitochondrial function in cellular models of AD.
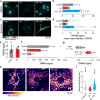
Incubation of rat primary neurons (a, b) or human neuroblastoma cells (c, d) with FiA blocks the loss of mitochondrial Δψm caused by Aβ1-42 oligomers. Representative immunofluorescence images of 2 independent experiments (a, c) and quantitative analysis of TMRM fluorescence (b, d) in cells treated with the indicated agents. The intensity levels are visualised using a five-tone heatmap (mean ± SD; asterisks, one-way ANOVA with Dunnett’s multiple comparison test for b and pairwise Mann‒Whitney test with false discovery rate correction due to non normal distribution for d). e Addition of FiA in rat primary neurons does not alter TMRM levels (means ± SDs; asterisks, two-tailed unpaired t test). Cells were treated with 300 µM of FiA for 3 days. f SH-SY5Y cells over-expressing APPswe have lower levels of Δψm (mean ± SD; asterisks, one-way ANOVA with Dunnett’s multiple comparison test). g Addition of FiA increases Δψm in SH-SY5Y cells over-expressing APPswe (means ± SDs; asterisks, two-tailed unpaired t test). h, i Incubation of rat primary neurons with Aβ1-42 oligomers reduces mitochondrial length and this is reduced by FiA. Representative images of cells stained with anti-TOMM20 (h) and quantification of mitochondrial length (i). The total number (n) of analysed mitochondria is indicated (median with IQR; asterisks, Friedman test due to non-normal distribution of the data determined using the Shapiro–Wilk test).
Fig. 7
Fig. 7. FiA restores mitochondrial health and is neuroprotective in fly models of AD.
An FiA-supplemented diet in flies expressing Aβ-Arc improves Δψm in the brains (a, means ± SDs; asterisks, two-tailed unpaired t test); improves climbing abilities (b, asterisks, one-way ANOVA with Tukey’s multiple comparison test); reduces the degree of mitochondria cristae fragmentation (c, asterisk, two-tailed chi-square test, 95% confidence interval); reduces the neurodegeneration of photoreceptor cells (d, asterisks, two-tailed chi-square test, 95% confidence interval); rescues the percentage of time spent asleep during the dark phase (e, asterisks, pairwise t test with the Benjamini‒Hochberg correction for multiple comparison) and increases lifespan (f, log-rank, Mantel–Cox test). An FiA-supplemented diet in flies expressing Tau improves Δψm in the brains (g, means ± SDs; asterisks, two-tailed unpaired t test) and decreases neurodegeneration (h, asterisks, two-tailed chi-square test, 95% confidence interval). Genotype: elavGal4; +;+ (Control), elavGal4; UAS Aβ42Arc/+; + (Aβ-Arc), elavGal4; +; UAS Tau2N4R/+ (Tau).
Fig. 8
Fig. 8. Higher folate intake is linked to decreased AD risk and pathologies.
a Genome-wide association on folate intake in the UK Biobank. The source analysis was obtained from the Pan-UKB repository (https://pan.ukbb.broadinstitute.org). Genome-wide significant SNPs at a P value smaller than 10−8 are labelled in red and the rest in grey. Chromosomes are on the x axis. The top genes are labelled and the SNP localisation information was obtained from SNPdb [76]. b MR uses SNPs to infer the causal effect of folate intake on AD risk. MR uses genetic variants that are associated with an exposure (folate in red) as instrumental variables to evaluate the causal effect of that exposure on an outcome (AD risk in blue). MR is less prone to bias and confounding factors (in grey) than observational studies and can provide more robust evidence about causality. The origin of the genetic instruments are indicated beside each latent variable without boxes. We used genetic variants associated with the intake of folate from the UK Biobank and SNPs associated with AD risk from a GWAS conducted by Kunkle et al., 2019 to evaluate the causal relationship between the nutrient and AD. c Folate intake is causally associated with a decreased risk of developing AD (scaled estimate [95% CIs], asterisks, inverse variance weighted in blue and Egger regression in red). The error bars in grey show the standard error of the estimated effect (black dot) between the SNP on the exposure and the SNP on the outcome. SNPs related to folate intake were estimated based on the UK Biobank data, and AD-related SNPs were obtained from published data [71]. Folate intake is causally associated with higher hippocampal grey volume (d), decreased daytime sleepiness (e) and improved markers of cognitive function (f) (scaled estimate [95% CIs], asterisks, two-stage least square regression). The error bars in grey show the 95% CIs of the estimated effect (red dot). The investigated variable is in red. g Higher expression of the Folate receptor 3 (FOLR3) gene is causally associated with a decreased risk of developing AD (scaled estimate [95% CIs], asterisks, inverse variance weighted in blue and Egger regression in red). The error bars in grey show the standard error of the estimated effect (black dot) between the SNP on the exposure and the SNP on the outcome.

References

    1. Schwarzinger M, Dufouil C. Forecasting the prevalence of dementia. Lancet Public Health. 2022;7:e94–e95. - PubMed
    1. Bekris LM, Yu CE, Bird TD, Tsuang DW. Genetics of Alzheimer disease. J Geriatr Psychiatry Neurol. 2010;23:213–27. - PMC - PubMed
    1. Selkoe DJ. The molecular pathology of Alzheimer’s disease. Neuron. 1991;6:487–98. - PubMed
    1. Levy E, Carman MD, Fernandez-Madrid IJ, Power MD, Lieberburg I, van Duinen SG, et al. Mutation of the Alzheimer’s disease amyloid gene in hereditary cerebral hemorrhage, Dutch type. Science. 1990;248:1124–6. - PubMed
    1. Hardy J, Selkoe DJ. The amyloid hypothesis of Alzheimer’s disease: progress and problems on the road to therapeutics. Science. 2002;297:353–6. - PubMed

MeSH terms

LinkOut - more resources