. 2024 Dec;42(8):e70019.
doi: 10.1002/cbf.70019.

Identification of a Nuclear Localization Signal (NLS) in Human Transcription Elongation Factor ELL2

Affiliations

Identification of a Nuclear Localization Signal (NLS) in Human Transcription Elongation Factor ELL2

Stephan Kohrt et al. Cell Biochem Funct. 2024 Dec.

Abstract

ELL2 is a transcription elongation factor suppressing transcriptional pausing of RNA polymerase II, thereby enhancing gene expression. In accordance with the nuclear localization of ELL2, the protein is supposed to carry out its function in promoting transcription in the nucleus. Yet, it is unknown whether ELL2 carries a nuclear localization signal (NLS). In this study, we identify the NLS of ELL2. In silico analysis resulted in prediction of a strong bipartite NLS with an exceptionally high score at amino acids 311-338 in the conserved region R1 of ELL2. Confocal laser scanning microscopy of a series of ELL2 truncation mutants and quantitative analysis of images verified the presence of R1 to be decisive for nuclear localization of ELL2 suggesting that the predicted NLS is accurate. Deletion of key basic amino acids within the putative NLS in silico and in vitro showed that K319, R320, and K333/K334 are crucial for ELL2's nuclear accumulation, thus confirming the predictions. The isolated ELL2-NLS was able to translocate an unrelated NLS-mapping system into the nucleus underlining the strength of the NLS. Taken together, we identified the NLS of ELL2 and mapped individual aa that are crucial for nuclear localization of ELL2.

Keywords: ELL2; NLS; nuclear localization signal; transcription elongation factor.


Conflict of interest statement

The authors declare no conflicts of interest.

Figures
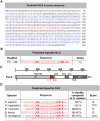
Figure 1
Figure 1
Bioinformatics predicts a strong bipartite nuclear localization signal (NLS) in ELL2. (A) Amino acid (aa) sequence of ELL2 and results from cNLS Mapper with low‐scoring NLS sequences (blue) and an exceptional high‐scoring NLS sequence (red). (B) Depiction of the bipartite NLS with the highest score. Bold: motif‐specific basic aa in NLS; underlined: linker. (C) Scheme of ELL2 with localization of the putative NLS sequence highlighted in red. R1, R2, and R3, conserved regions 1, 2, and 3, respectively. Met 186, alternative start codon at Met 186. (D) Multiple sequence alignment of ELL2 NLS sequences of different species and the percent of identity matrix (PIM) compared to human ELL2. Score indicates results from cNLS Mapper . (dot) indicates a conserved position with similar but not identical residues; * (asterisk), a fully conserved position where all the aligned residues are identical; : (colon), a conserved position where the aligned residues are strongly similar in their biochemical properties (e.g., hydrophobicity, charge, and size).
Figure 2
Figure 2
The ELL2 region R1 is crucial for nuclear localization of ELL2. (A) Schematic representation of ELL2 wildtype (ELL2‐WT) and ELL2 truncation mutants with C‐terminal myc‐his tag. R1, R2, and R3, conserved regions 1, 2, and 3, respectively. Red box: localization of putative NLS. (B) Immunofluorescence analysis of ELL2‐WT, ELL2 truncations, and the nucleus was conducted in 293T cells. Cells were transfected with 1 µg of expression plasmids pEF‐ELL2‐myc (ELL2‐WT, 1–3), pEF‐ELL2‐R1‐myc (ELL2‐R1, 4–6), pEF‐ELL2‐N‐myc (ELL2‐N, 7–9), pEF‐ELL2‐ΔR2‐myc (ELL2‐ΔR2, 10–12), pEF‐ELL2‐R2‐myc (ELL2‐R2, 13–14), pEF‐ELL2‐R3‐myc (ELL2‐R3, 16–18), pEF‐ELL2‐C‐myc (ELL2‐C, 19–21) or an empty vector control (pEF1α, 22–24). After 48 h, cells were stained intracellularly with primary mouse anti‐myc followed by anti‐mouse Alexa Fluor 488 (green) antibodies. Nuclei were counterstained with DAPI (blue). Images were acquired on a Leica TCS SP5 confocal laser scanning microscope with a 63 × 1.4 HCX PL APO CS oil immersion objective. Images depicting ELL2‐WT and ELL2 truncations (green), the nucleus (blue), and the merged stains are displayed. Scale bars indicate 4, 5, 7, or 40 µm as indicated. (C) Quantitation of images as displayed in B and Supporting Information S1: Figure S2. At least 182 cells in 15 optical fields of four independent experiments were analyzed. The frequency of cells expressing ELL2‐WT or ELL2 truncation mutants in the nucleus (black) or the cytoplasm (gray) is indicated. (D) The ratio of mean fluorescence intensities between proteins located in the nucleus and the cytoplasm (Fn/c) in single cells like those shown in (B) expressing the indicated ELL2 constructs are shown. Each data point corresponds to quantification of a single cell, bars indicate mean values. Ten randomly selected cells per condition were analyzed, and values were compared to those obtained upon expression of ELL2‐WT using Kruskal–Wallis test and Dunn's multiple comparisons test (**p < 0.01; ***p < 0.001).
Figure 3
Figure 3
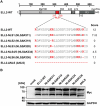
In silico and in vitro mutagenesis of the ELL2 NLS. (A) Schematic overview of ELL2‐WT and ELL2 deletion mutants. The ELL2‐WT aa sequence carrying the predicted nuclear localization signal (NLS, aa 311–338), in silico designed deletion mutants (minus, red) of all basic amino acids (bold, red) within the predicted ELL2 NLS (ELL2‐NLS1 to ELL2‐NLS6), or deletions of the whole NLS (ELL2‐∆NLS) were analyzed by cNLS Mapper. Scores of the respective sequences are indicated. (B) Test expression of ELL2‐NLS deletion mutants upon transfection of 293T cells with 1 µg of myc‐tagged expression plasmids, including pEF‐1α‐ELL2‐myc (ELL2), ELL2 truncations pEF‐1α‐ELL2‐NLS‐1‐myc (NLSΔR311), pEF‐1α‐ELL2‐NLS‐2‐myc (NL2ΔK319), pEF‐1α‐ELL2‐NLS‐3‐myc (NLSΔR320), pEF‐1α‐ELL2‐NLS‐5‐myc (NLSΔK334), and the control vector pEF‐1α (mock). After 48 h, Western Blot analysis was performed using antibodies specific for myc and the housekeeping gene glyceraldehyde 3‐phosphate dehydrogenase (GAPDH). Images were cropped due to technical reasons and original blots are presented in Supporting Information S1: Figure S4.
Figure 4
Figure 4
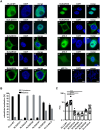
Basic residues K319, R320, K333/K334 are essential for the nuclear localization of ELL2. (A) Immunofluorescence analysis of ELL2‐WT, ELL2‐NLS mutants and the nucleus in 293T cells transfected with the expression plasmids (1 µg each) pEF‐1α‐ELL2‐myc (ELL2‐WT, 1–3), ELL2 deletion mutants pEF‐1α‐ELL2‐NLS‐1‐myc (NLSΔR311, 4–6), pEF‐1α‐ELL2‐NLS‐2‐myc (NL2ΔK319, 7–9), pEF‐1α‐ELL2‐NLS‐3‐myc (NLSΔR320, 10–12), pEF‐1α‐ELL2‐NLS‐4/5‐myc (NLSΔK334, 13–15), pEF‐1α‐ELL2‐NLS‐6‐myc (NLSΔR336, 16–21), pEF‐1α‐ELL2‐∆NLS‐myc (∆NLS, 22–27), or the empty vector pEF‐1α (28–30) as negative control. After 48 h, cells were stained intracellularly with primary mouse anti‐myc followed by anti‐mouse Alexa Fluor 488 (green) antibodies. Nuclei were counterstained with DAPI (blue). Images were acquired on a Leica TCS SP5 confocal laser scanning microscope with a 63 × 1.4 HCX PL APO CS oil immersion objective. Images depicting ELL2‐WT and ELL2‐NLS deletion mutants (green), the nucleus (blue), and the merged stains are displayed. Scale bars indicate 3, 4, 5, or 40 µm as indicated. (B) Quantitative analysis of images as displayed in B and Supporting Information S1: Figure S5. At least 64 cells in three optical fields of three independent experiments were analyzed. The frequency of cells expressing ELL2‐WT or ELL2‐NLS deletion mutants in the nucleus (black) or the cytoplasm (gray) is indicated. (C) The ratio of mean fluorescence intensities between proteins located in the nucleus and the cytoplasm (Fn/c) in single cells like those shown in (B) expressing the indicated ELL2 constructs are shown. Each data point corresponds to quantification of a single cell, bars indicate mean values. Ten randomly selected cells per condition were analyzed, and values were compared to those obtained upon expression of ELL2‐WT using Kruskal–Wallis test and Dunn's multiple comparisons test (*p < 0.05; ***p < 0.001; ****p < 0.0001).
Figure 5
Figure 5
The ELL2 NLS relocalizes GFP‐β‐Gal fusion constructs to the nucleus. (A) Overview of an established NLS mapping system (pHM830) encoding an N‐terminal green fluorescent protein (GFP) and a C‐terminal beta‐galactosidase separated by a multiple cloning site (MCS). The MCS was utilized to introduce the NLS of ELL2‐WT (GFP‐NLS‐WT) and of the ELL2‐NLS deletion mutants as shown in Figure 3A (GFP‐NLS‐1 to GFP‐NLS‐4/5). (B) Immunofluorescence analysis was conducted in 293 T cells transfected with expression plasmids including GFP‐NLS‐WT‐β‐gal (GFP‐NLS‐WT, 1–3), GFP‐NLSΔR311‐β‐gal (GFP‐NLS‐1, 4–6), GFP‐NLSΔK319‐β‐gal (GFP‐NLS‐2, 7–9), GFP‐NLSΔR320‐β‐gal (GFP‐NLS‐3, 10–12), GFP‐NLSΔK334‐β‐gal (GFP‐NLS‐4/5, 13–15) or the empty vector pHM830 (GFP‐β‐gal, 16–18) without any NLS serving as control. After 48 h, cells were fixed with 2% para‐formaldehyde (1 h) followed by staining of the nuclei with DAPI. Images were acquired on a Leica TCS SP5 confocal laser scanning microscope with a 63 × 1.4 HCX PL APO CS oil immersion objective. Images of GFP expressed from pHM830 and the indicated ELL2‐NLS mutants (green), the nucleus (blue), and the merged stains are displayed. Scale bars indicate 3, 4, or 5 μm as indicated. (C) Quantitation of nuclear‐cytoplasmic localization of GFP‐NLS‐β‐Gal fusion constructs as displayed in B and Supporting Information S1: Figure S6. At least 382 cells in four optical fields of three independent experiments were analyzed. The frequency of cells expressing the respective GFP‐labeled constructs in the nucleus (black) or the cytoplasm (gray) are presented. (D) The ratio of mean fluorescence intensities between proteins located in the nucleus and the cytoplasm (Fn/c) in single cells like those shown in (B) expressing the indicated GFP‐NLS fusion constructs are shown. Each data point corresponds to quantification of a single cell, bars indicate mean values. Ten randomly selected cells per condition were analyzed, and values were compared to those obtained upon expression of ELL2‐WT using Kruskal–Wallis test and Dunn's multiple comparisons test (****p < 0.0001).

References

    1. Shilatifard A., Duan D. R., Haque D., et al., “ELL2, a New Member of an ELL Family of RNA Polymerase Ii Elongation Factors,” Proceedings of the National Academy of Sciences United States of America 94 (1997): 3639–3643. - PMC - PubMed
    1. Martincic K., Alkan S. A., Cheatle A., Borghesi L., and Milcarek C., “Transcription Elongation Factor ELL2 Directs Immunoglobulin Secretion in Plasma Cells by Stimulating Altered RNA Processing,” Nature Immunology 10 (2009): 1102–1109, 10.1038/ni.1786. - DOI - PMC - PubMed
    1. Ghobrial A., Flick N., Daly R., Hoffman M., and Milcarek C., “ELL2 Influences Transcription Elongation, Splicing, Ig Secretion and Growth,” Journal of Mucosal Immunology Research 3 (2019): 112. - PMC - PubMed
    1. Kohrt S., Strobel S., Mann M., Sticht H., Fleckenstein B., and Thoma‐Kress A., “Characterizing the Interaction Between the HTLV‐1 Transactivator Tax‐1 With Transcription Elongation Factor ELL2 and Its Impact on Viral Transactivation,” International Journal of Molecular Sciences 22 (2021): 13597. - PMC - PubMed
    1. Liu M., Hsu J., Chan C., Li Z., and Zhou Q., “The Ubiquitin Ligase Siah1 Controls ELL2 Stability and Formation of Super Elongation Complexes to Modulate Gene Transcription,” Molecular Cell 46 (2012): 325–334. - PMC - PubMed

MeSH terms

Substances

LinkOut - more resources