. 2024 Nov 2:24:100164.
doi: 10.1016/j.mbplus.2024.100164. eCollection 2024 Dec.

A human stem cell-derived model reveals pathologic extracellular matrix remodeling in diabetic podocyte injury

Affiliations

A human stem cell-derived model reveals pathologic extracellular matrix remodeling in diabetic podocyte injury

Yasmin Roye et al. Matrix Biol Plus. .

Abstract

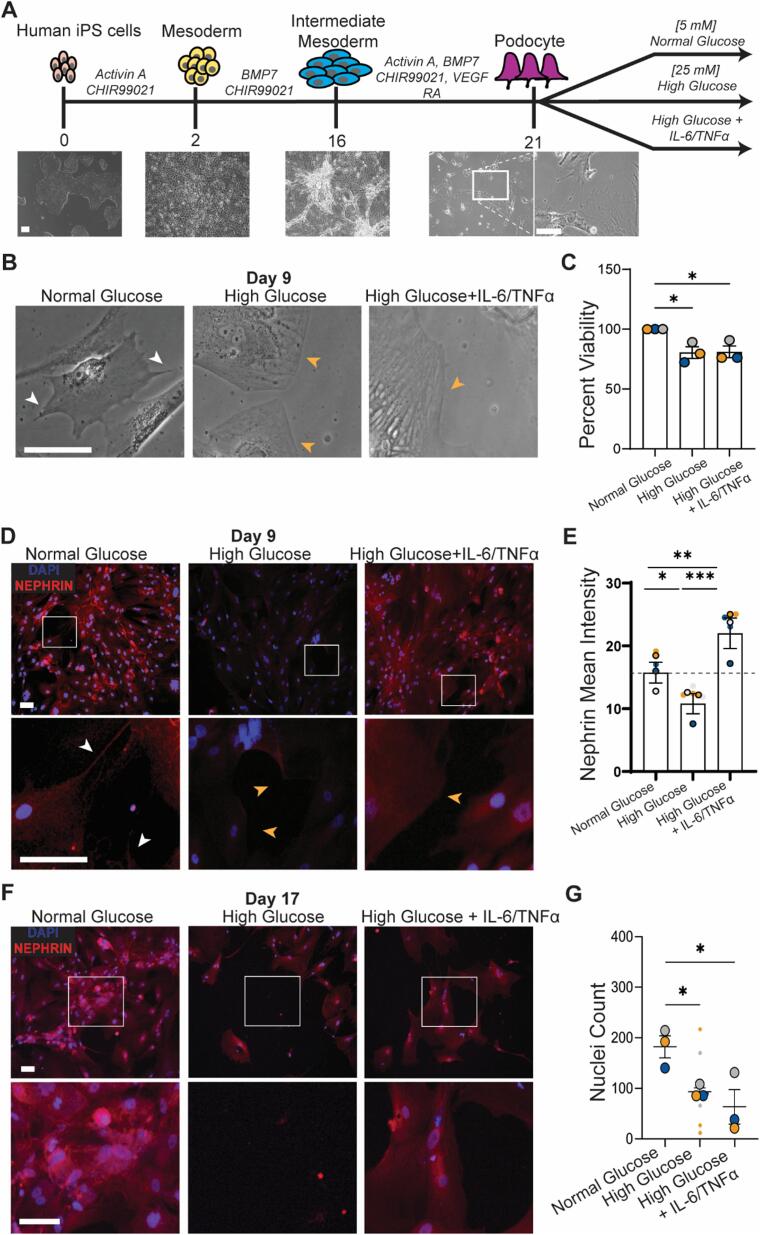
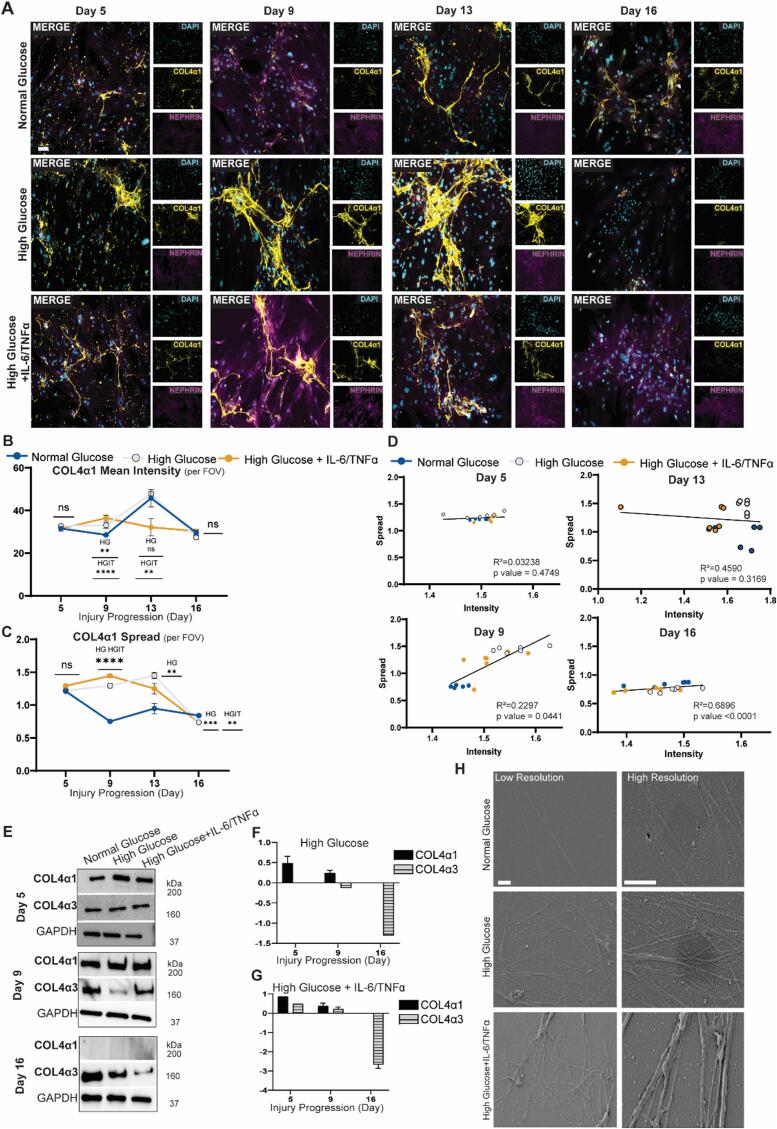
Diabetic nephropathy results from chronic (or uncontrolled) hyperglycemia and is the leading cause of kidney failure. The kidney's glomerular podocytes are highly susceptible to diabetic injury and subsequent non-reversible degeneration. We generated a human induced pluripotent stem (iPS) cell-derived model of diabetic podocytopathy to investigate disease pathogenesis and progression. The model recapitulated hallmarks of podocytopathy that precede proteinuria including retraction of foot processes and podocytopenia (detachment from the extracellular matrix (ECM)). Moreover, hyperglycemia-induced injury to podocytes exacerbated remodeling of the ECM. Specifically, mature podocytes aberrantly increased expression and excessively deposited collagen (IV)α1α1α2 that is normally abundant in the embryonic glomerulus. This collagen (IV) imbalance coincided with dysregulation of lineage-specific proteins, structural abnormalities of the ECM, and podocytopenia - a mechanism not shared with endothelium and is distinct from drug-induced injury. Intriguingly, repopulation of hyperglycemia-injured podocytes on decellularized ECM scaffolds isolated from healthy podocytes attenuated the loss of synaptopodin (a mechanosensitive protein associated with podocyte health). These results demonstrate that human iPS cell-derived podocytes can facilitate in vitro studies to uncover the mechanisms of chronic hyperglycemia and ECM remodeling and guide disease target identification.

Keywords: Collagen (IV); Decellularized extracellular matrix; Diabetic nephropathy; Human induced pluripotent stem cells; Hyperglycemia; Podocytes.


Conflict of interest statement

The authors declare the following financial interests/personal relationships which may be considered as potential competing interests: S.M. is an inventor on a patent regarding podocyte differentiation, U.S. Patent No. 11,083,754 B2. U.S. Patent and Trademark Office. All other authors declare no other competing interests.

Figures

Fig. 1
Fig. 1
Establishment and characterization of the diabetic injury model. A. Schematic and representative brightfield microscopy images of podocyte derivation from human iPS cells (adapted from Musah et al. 2017) and culture conditions for diabetic injury. B. Brightfield images highlighting the structure of podocyte foot processes in health and disease. White arrows indicate primary cell processes/extensions in normoglycemia; yellow arrows indicate foot process retraction from diabetic injury. C. Podocyte viability at day 9 diabetic injury, n = 3 color-matched biological replicates (WST-8/CCK8 assay) D. Immunofluorescent images showing differential nephrin expression in podocyte foot processes from diabetic injury (DAPI, blue; nephrin, red). E. Quantification of nephrin mean intensity per field of view. Baseline expression level denoted as dotted line; n = 4 images for normal glucose, n = 6 images for high glucose and high glucose + IL-6/TNFα. F. Immunofluorescence images showing severe podocyte detachment upon prolonged exposure to diabetic conditions (DAPI, blue; nephrin, red). G. Nuclei (DAPI) count of injured podocytes at day 17 of culture; n = 3 color-matched biological (large dots) and technical (small dots) replicates. A-C, E Scale bars, 100 µm. D,F Data are mean ± S.E.M. *p < 0.05; **p < 0.01; ***p < 0.001. (For interpretation of the references to color in this figure legend, the reader is referred to the web version of this article.)
Fig. 2
Fig. 2
Characteristic ECM remodeling correlates with diabetic injury progression. A. Immunofluorescence images of podocyte (DAPI, cyan; nephrin, magenta) collagen (IV)α1 deposition (COL4α1, yellow) over diabetic injury progression. B. Quantification of collagen (IV)α1 mean intensity per field of view; n = 6 images per condition. C. Quantification of collagen (IV)α1 spread per field of view; n = 6 images per condition. D. Linear regression analysis of spread vs. intensity on days 5, 9, 13, and 16 of diabetic injury E. Western blot images of embryonic and mature isoforms of collagen (IV), α1 and α3, respectively, over diabetic injury progression. F. Densitometric analysis of collagen (IV) α1 and α3 during hyperglycemic injury progression, relative to GAPDH and fold change of the normal glucose control condition. G. Densitometric analysis of collagen (IV) α1 and α3 of hyperglycemic with inflammation injury progression, relative to GAPDH and fold change of the normal glucose control condition. H. SEM of decellularized podocyte ECM at high and low resolution. Scale bars, 100 µm (A) and 2 µm (H). B-D *p < 0.05; **p < 0.01; ***p < 0.001; ****p < 0.0001. (For interpretation of the references to color in this figure legend, the reader is referred to the web version of this article.)
Fig. 3
Fig. 3
Excess collagen (IV)α1α1α2 deposition common among glomerular cell types; cytopenia specific to podocytes. A. Schematic and brightfield microscopy images of vascular endothelium derivation from human iPS cells (adapted from Atchinson et al. 2017) and culture conditions for diabetic injury. B. Brightfield microscopy images of healthy and injured vascular endothelial cell phenotype, time-matched to podocytopenia (day 17). C. Immunofluorescence images of PECAM-1 expression (green) in healthy and injured vascular endothelium (DAPI, blue) after 26 days of injury. D. Nuclei (DAPI) count of injured endothelial cells at 26 days of culture; n = 3 color-matched biological replicates. E. Quantification of PECAM-1 mean intensity per field of view; n = 6 images per condition. F. Immunofluorescence images of endothelial cell (DAPI, blue; PECAM, green) collagen (IV)α1 deposition (COL4A1, magenta) at 26 days of injury. G. Quantification of collagen (IV)α1 mean intensity per field of view; n = 6 images per condition. H. Quantification of collagen (IV)α1 spread per field of view; n = 6 images per condition. I. Linear regression analysis of collagen (IV)α1 spread vs. intensity at 26 days of endothelial cell exposure to normal and high glucose conditions; n = 5 images for normal glucose, n = 6 images for high glucose. A-C, F Scale bars, 100 µm. D, F-H *p < 0.05; **p < 0.01; ***p < 0.001; ****p < 0.0001. (For interpretation of the references to color in this figure legend, the reader is referred to the web version of this article.)
Fig. 4
Fig. 4
ECM remodeling mechanism in hyperglycemia is distinct from drug-induced injury A. Schematic of the experimental strategy for hyperglycemia- and drug-induced disease treatments. B. Immunofluorescence microscopy images of podocyte foot process morphology (top and middle row panels: DAPI, blue; nephrin, red) and actin cytoskeleton (bottom row panel: DAPI, blue; F-actin, gray) via hyperglycemia- and drug-induced injury. White arrowheads indicate primary and secondary foot processes, yellow arrowheads indicate foot process retraction, dashed lines denote cell body perimeter C. Podocyte viability before and after hyperglycemia- and drug-induced podocyte injury; n = 3. D. Immunofluorescence images of podocytes (DAPI, cyan; Nephrin, magenta) collagen (IV)α1 (magenta) deposition in hyperglycemia- and drug-induced injury. E. Western blot analysis of embryonic isoform collagen (IV)α1 following nine days of injury. F. Densitometric analysis of collagen (IV)α1 after nine days of injury.; n = 3. G. Gelatinase (MMP-2 and MMP-9) activity normalized to total protein; n = 3 color matched biological replicates. H. Western blot of TIMP-1 expression after 9 days of injury. I. Densitometric analysis of TIMP-1 levels after 9 days of injury; n = 3 color-matched biological replicates for Adriamycin, n = 4 color-matched biological replicates for all other conditions. B, D Scale bars, 100 µm. C, F, G, I *p < 0.05; **p < 0.01. (For interpretation of the references to color in this figure legend, the reader is referred to the web version of this article.)
Fig. 5
Fig. 5
Proposed model for podocyte-ECM interactions and matrix remodeling in distinct injury modes. Higher collagen (IV)α1α1α2 deposition, mediated by a hyperglycemic microenvironment, results in podocyte detachment despite similar levels of gelatinase activity compared to normoglycemia due to differences in interchain disulfide bond density. Podocyte exposure to Adriamycin results in no significant changes to ECM composition but cell detachment is mediated by dramatically higher gelatinase activity. Pamidronate exposure causes higher collagen (IV)α1α1α2 deposition but does not result in immediate podocyte loss or detachment, partly due to elevated gelatinase inhibition by TIMP-1.
Fig. 6
Fig. 6
Signals from healthy matrix can attenuate hyperglycemic injury phenotype. A. Schematic of experimental strategy to isolate and repopulate normal glucose (NG) and high glucose (HG) podocyte-derived ECM scaffolds. B. Analysis of ECM scaffold genetic material via immunofluorescence microscopy of nuclei (top panel; DAPI, blue) and brightfield microscopy. C. ECM scaffold mRNA quantification; n ≥ 3 color-matched biological replicates. D. Immunofluorescence images of normal glucose and high glucose podocytes (DAPI, cyan; nephrin, magenta) adherence to their respective ECM scaffolds (COL4α1, yellow). White arrowheads indicate primary and secondary foot processes, yellow arrowheads indicate effacement. E. Immunofluorescence images of YAP (green) localization in healthy and injured podocytes (DAPI, greyscale) on ECM scaffolds. F. Immunofluorescence images of podocyte morphology (DAPI, blue; podocin, red) on decellularized scaffolds G. Western blot of synaptopodin expression (bottom band) of healthy and injured cells on ECM scaffolds. H. Densitometric analysis of synaptopodin expression relative to GAPDH; n = 3 color matched biological replicates. I. Fold change of synaptopodin expression compared to normal glucose control on the same substrate. B, D-F Scale bar, 275 µm; inset scale bar, 90 µm. C and I*p < 0.05; **p < 0.01; ***p < 0.001; ****p < 0.0001. (For interpretation of the references to color in this figure legend, the reader is referred to the web version of this article.)
Supplementary Fig. 1

Similar articles

References

    1. Centers for Disease Control and Prevention. Chronic Kidney Disease in the United States, 2023. Atlanta, GA: US Department of Health and Human Services, Centers for Disease Control and Prevention; 2023.
    1. P. Rossing, M.L. Caramori, J.C.N. Chan, H.J.L. Heerspink, C. Hurst, K. Khunti, A. Liew, E.D. Michos, S.D. Navaneethan, W.A. Olowu, T. Sadusky, N. Tandon, K.R. Tuttle, C. Wanner, K.G. Wilkens, S. Zoungas, J.C. Craig, D.J. Tunnicliffe, M.A. Tonelli, M. Cheung, A. Earley, I.H. De Boer, Executive summary of the KDIGO 2022 Clinical Practice Guideline for Diabetes Management in Chronic Kidney Disease: an update based on rapidly emerging new evidence, Kidney Int. 102 (2022) 990–999. https://doi.org/10.1016/j.kint.2022.06.013. - PubMed
    1. McCullough K.P., Morgenstern H., Saran R., Herman W.H., Robinson B.M. Projecting ESRD incidence and prevalence in the United States through 2030. J. Am. Soc. Nephrol. 2019;30:127–135. doi: 10.1681/ASN.2018050531. - DOI - PMC - PubMed
    1. United States Renal Data System, 2023 USRDS Annual Data Report: Epidemiology of kidney disease in the United States Annual Data Report, National Institutes of Health, National Institute of Diabetes and Digestive and Kidney Diseases (2023).
    1. Dąbrowska-Bender M., Dykowska G., Żuk W., Milewska M., Staniszewska A. The impact on quality of life of dialysis patients with renal insufficiency. Patient Prefer. Adherence. 2018;12:577–583. doi: 10.2147/PPA.S156356. - DOI - PMC - PubMed

LinkOut - more resources