. 2024 Nov;60(11):e2023WR036511.
doi: 10.1029/2023WR036511. Epub 2024 Nov 22.

Combining a Multi-Lake Model Ensemble and a Multi-Domain CORDEX Climate Data Ensemble for Assessing Climate Change Impacts on Lake Sevan

Affiliations

Combining a Multi-Lake Model Ensemble and a Multi-Domain CORDEX Climate Data Ensemble for Assessing Climate Change Impacts on Lake Sevan

Muhammed Shikhani et al. Water Resour Res. 2024 Nov.

Abstract

Global warming is shifting the thermal dynamics of lakes, with resulting climatic variability heavily affecting their mixing dynamics. We present a dual ensemble workflow coupling climate models with lake models. We used a large set of simulations across multiple domains, multi-scenario, and multi GCM- RCM combinations from CORDEX data. We forced a set of multiple hydrodynamic lake models by these multiple climate simulations to explore climate change impacts on lakes. We also quantified the contributions from the different models to the overall uncertainty. We employed this workflow to investigate the effects of climate change on Lake Sevan (Armenia). We predicted for the end of the 21st century, under RCP 8.5, a sharp increase in surface temperature ( 4.3 ± 0.7 K ) and substantial bottom warming ( 1.7 ± 0.7 K ) , longer stratification periods (+55 days) and disappearance of ice cover leading to a shift in mixing regime. Increased insufficient cooling during warmer winters points to the vulnerability of Lake Sevan to climate change. Our workflow leverages the strengths of multiple models at several levels of the model chain to provide a more robust projection and at the same time a better uncertainty estimate that accounts for the contributions of the different model levels to overall uncertainty. Although for specific variables, for example, summer bottom temperature, single lake models may perform better, the full ensemble provides a robust estimate of thermal dynamics that has a high transferability so that our workflow can be a blueprint for climate impact studies in other systems.

Keywords: CORDEX; LakeEnsemblR; climate change impacts; lake modeling; multi model ensemble (MME); variance decomposition.


Conflict of interest statement

The authors declare no conflicts of interest relevant to this study.

Figures

Figure 1
Figure 1
Map of the geographical coverage of the CORDEX domains used in this study. West Asian domain (WAS), Centerial Asian domain (CAS), and Middle East North African domain (MNA). The upper left inset shows the location of Lake Sevan and its catchment. The lower right inset shows the bathymetric map of Lake Sevan as meters above sea level.
Figure 2
Figure 2
The conceptual workflow of the used methodology. The blue circles show the input data, the text on the edges show the software/package used to achieve the next step (white boxes).
Figure 3
Figure 3
Time series plots of the temperature at 0.1, 20, and 77 m depth from the surface as well as the ice thickness for Lake Sevan during the calibration period between 2008 and 2014 for each of the models and the ensemble mean as well as the observed temperature. The dots in the ice thickness panel represent the observed fraction of ice covered area from remote sensing data.
Figure 4
Figure 4
Anomalies of projected annual temperatures for (a) CORDEX air temperature, (b) variability of the last decade of each of the scenarios for air temperature, (c) Lake ensemble mean surface temperature (surface temperature), (d) variability of the last decade of each of the scenarios for surface temperature, (e) Lake ensemble mean bottom temperature (bottom temperature), (f) variability of the last decade of each of the scenarios for bottom temperature. The thick lines represent the mean of the ensemble mean for each of the scenarios.
Figure 5
Figure 5
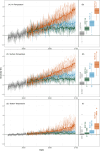
Lake temperature projections and variability of the lake models. Anomalies of projected annual temperatures by each lake model for (a) surface temperature under RCP 8.5 and the variability of surface temperature in the last decade of RCP 8.5, (b) surface temperature under RCP 4.5 and the variability of surface temperature in the last decade of RCP 4.5, (c) surface temperature under RCP 2.6, and the variability of surface temperature in the last decade of RCP 2.6, (e) bottom temperature under RCP 8.5 and the variability of bottom temperature in the last decade of RCP 8.5, (f) bottom temperature under RCP 4.5, and the variability of bottom temperature in the last decade of RCP 4.5, (h) bottom temperature under RCP 2.6 and the variability of bottom temperature in the last decade of RCP 2.6. The thick lines represent the mean of the each of the models for the GCM‐RCM. The dark thick line represents the mean of the ensemble mean. (g) The lake models ensemble variability across the GCM‐RCM combinations for surface water temperature under RCP 8.5 (averaged between 2006 and 2099).
Figure 6
Figure 6
Projection of stratification and ice indices. The lake models ensemble mean (a) Stratification onset anomalies, (b) stratification end anomaly, (c) absolute values of annual maximum ice duration, and (d) maximum annual ice thickness. The thick line in a panels (a and b) represents the mean while thick points in panels (c and d) represents the median.
Figure 7
Figure 7
Contribution of Climate Data and Lake Models to Variance of Surface (upper row) and Bottom Temperature (lower row) under Different Emission Scenarios.

References

    1. Amadori, M. , Bresciani, M. , Giardino, C. , & Dijkstra, H. A. (2024). Slow response of surface water temperature to fast atmospheric variability reveals mixing heterogeneity in a deep lake. Scientific Reports, 14(1), 8459. 10.1038/s41598-024-58547-0 - DOI - PMC - PubMed
    1. Andersen, T. K. , Nielsen, A. , Jeppesen, E. , Hu, F. , Bolding, K. , Liu, Z. , et al. (2020). Predicting ecosystem state changes in shallow lakes using an aquatic ecosystem model: Lake Hinge, Denmark, an example. Ecological Applications, 30(7), e02160. 10.1002/eap.2160 - DOI - PMC - PubMed
    1. Bedia, J. , Baño‐Medina, J. , Legasa, M. N. , Iturbide, M. , Manzanas, R. , Herrera, S. , et al. (2020). Statistical downscaling with the downscaleR package (v3.1.0): Contribution to the VALUE intercomparison experiment. Geoscientific Model Development, 13(3), 1711–1735. 10.5194/gmd-13-1711-2020 - DOI
    1. Bedia, J. , miturbide, & Felice, M. D. (2017). SantanderMetGroup/transformeR: EMS paper visualizeR [Software]. Zenodo. 10.5281/zenodo.846294 - DOI
    1. Benson, B. J. , Magnuson, J. J. , Jensen, O. P. , Card, V. M. , Hodgkins, G. , Korhonen, J. , et al. (2012). Extreme events, trends, and variability in Northern Hemisphere lake‐ice phenology (1855–2005). Climatic Change, 112(2), 299–323. 10.1007/s10584-011-0212-8 - DOI

References From the Supporting Information

    1. Ayala, A. I. , Moras, S. , & Pierson, D. C. (2020). Simulations of future changes in thermal structure of Lake Erken: Proof of concept for ISIMIP2b lake sector local simulation strategy. Hydrology and Earth System Sciences, 24(6), 3311–3330. 10.5194/hess-24-3311-2020 - DOI
    1. Salgado, R. , & Le Moigne, P. (2010). Coupling of the flake model to the surfex externalized surface model.