. 2024 Aug 20;6(12):101186.
doi: 10.1016/j.jhepr.2024.101186. eCollection 2024 Dec.

Development of mutated β-catenin gene signature to identify CTNNB1 mutations from whole and spatial transcriptomic data in patients with HCC

Affiliations

Development of mutated β-catenin gene signature to identify CTNNB1 mutations from whole and spatial transcriptomic data in patients with HCC

Brandon M Lehrich et al. JHEP Rep. .

Abstract

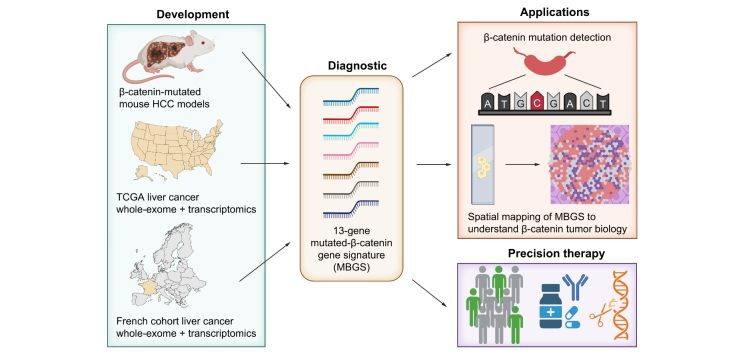
Background & aims: Patients with β-catenin (encoded by CTNNB1)-mutated hepatocellular carcinoma (HCC) demonstrate heterogenous responses to first-line immune checkpoint inhibitors (ICIs). Precision-medicine based treatments for this subclass are currently in clinical development. Here, we report derivation of the Mutated β-catenin Gene Signature (MBGS) to predict CTNNB1-mutational status in patients with HCC for future application in personalized medicine treatment regimens.

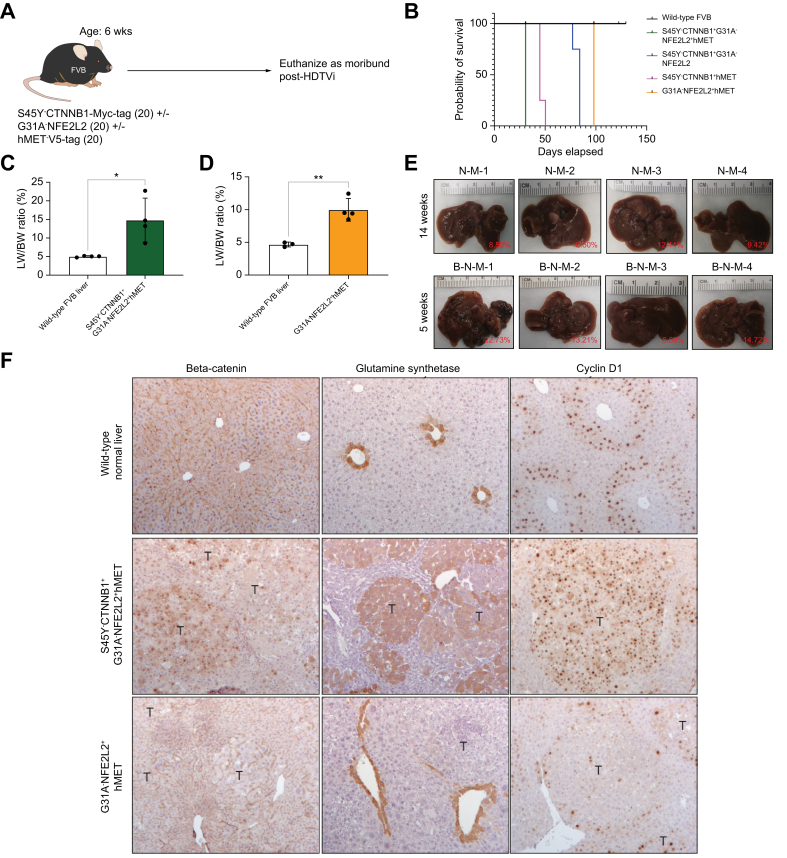
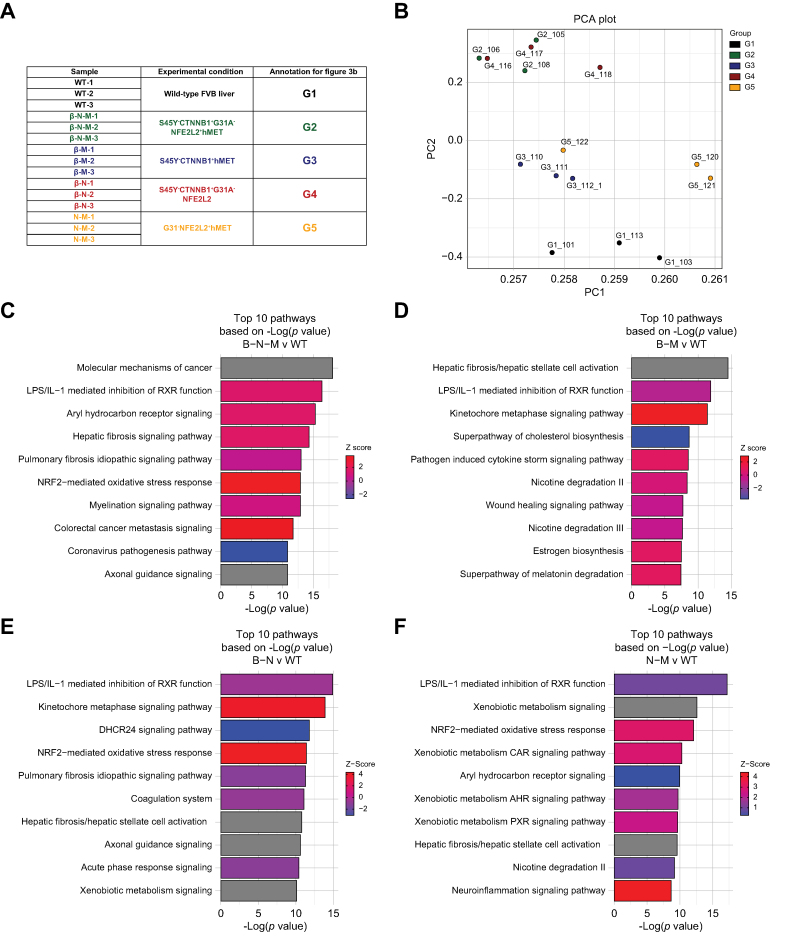
Methods: Co-expression of mutant-Nrf2 and hMet ± mutant-β-catenin in murine livers in mice led to HCC development. The MBGS was derived using bulk RNA-seq and intersectional transcriptomic analysis of β-catenin-mutated and non-mutated HCC models. Integrated RNA/whole-exome-sequencing and spatial transcriptomic data from multiple cohorts of patients with HCC was assessed to address the ability of MBGS to detect CTNNB1 mutation, the tumor immune microenvironment, and/or predict therapeutic responses.

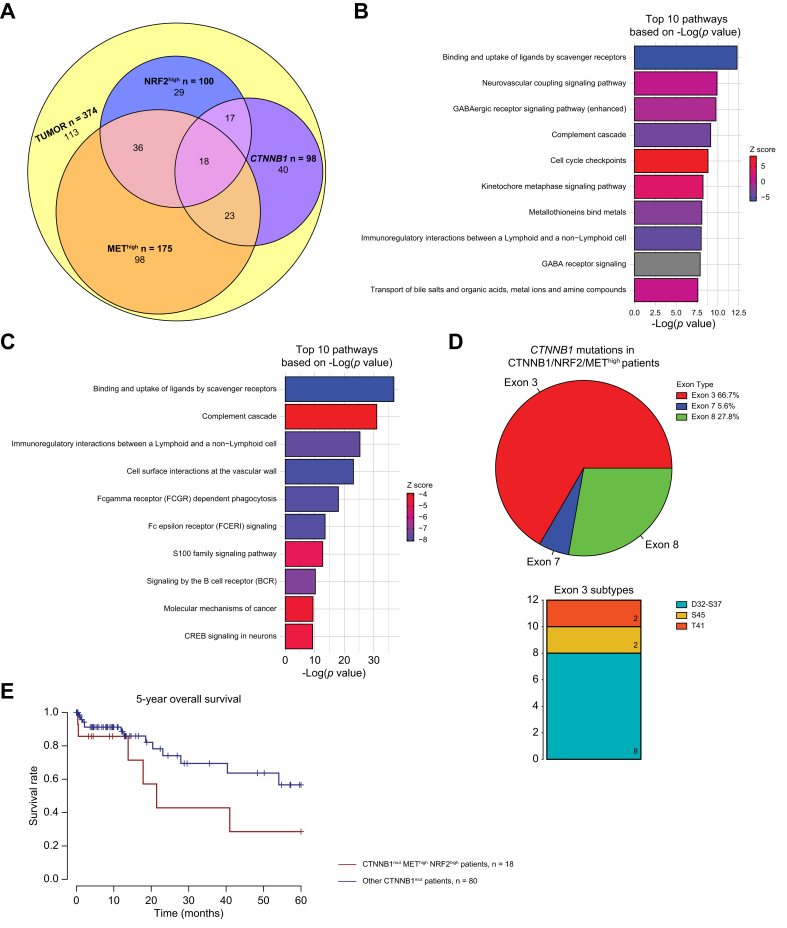
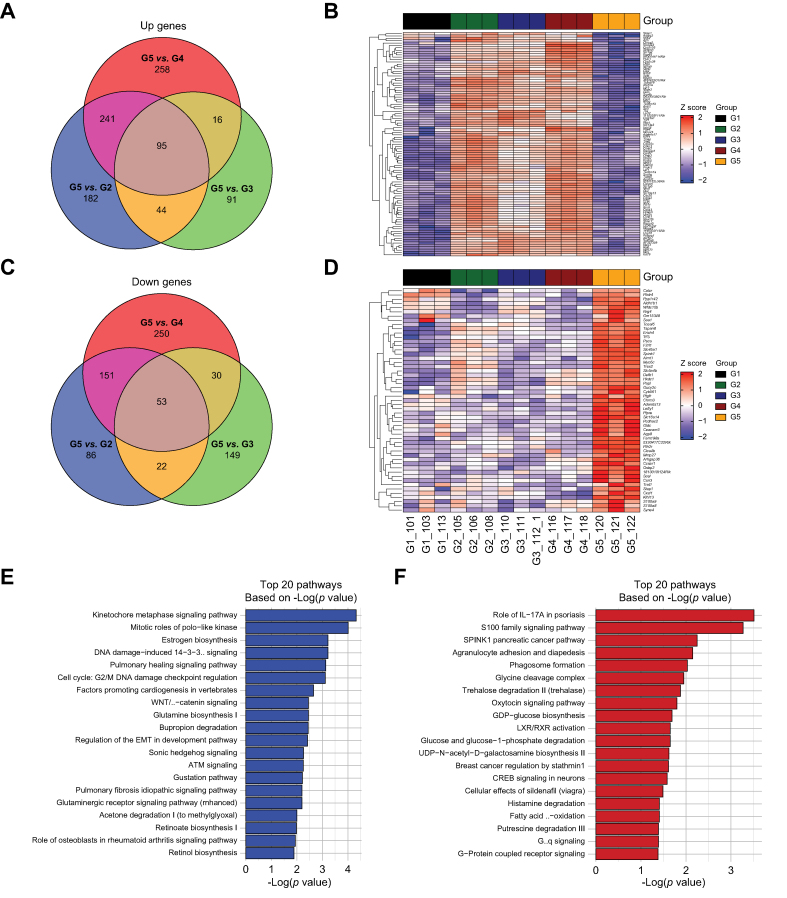
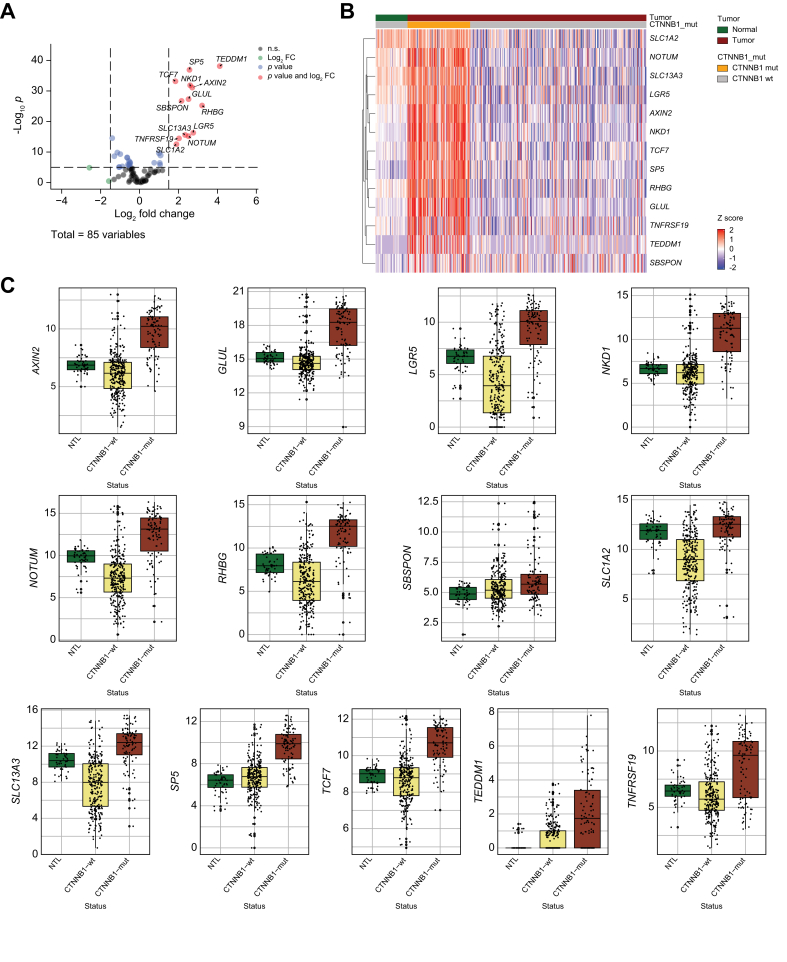
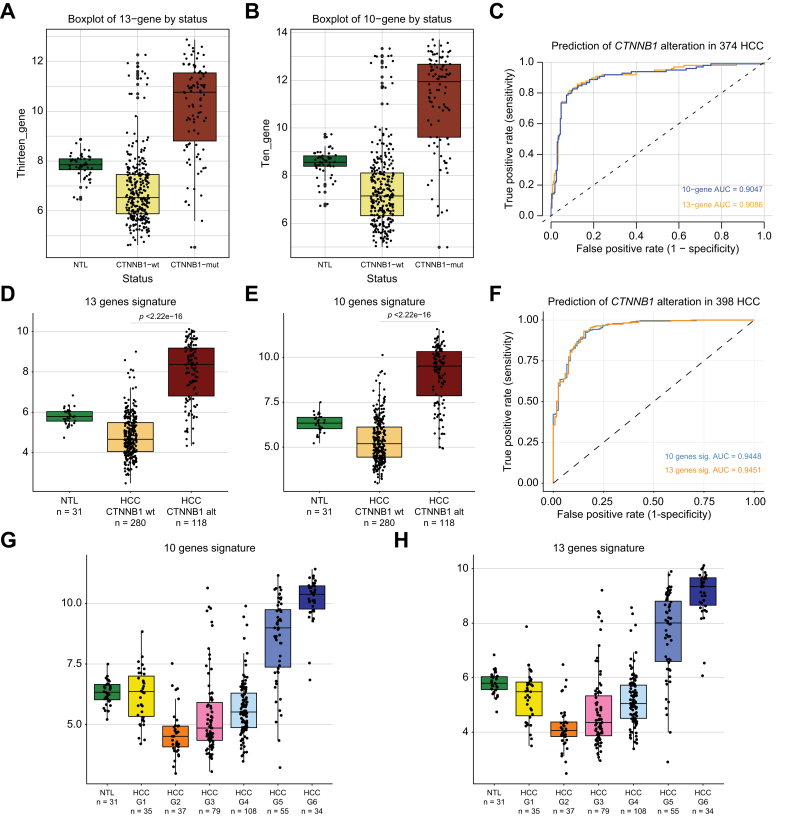
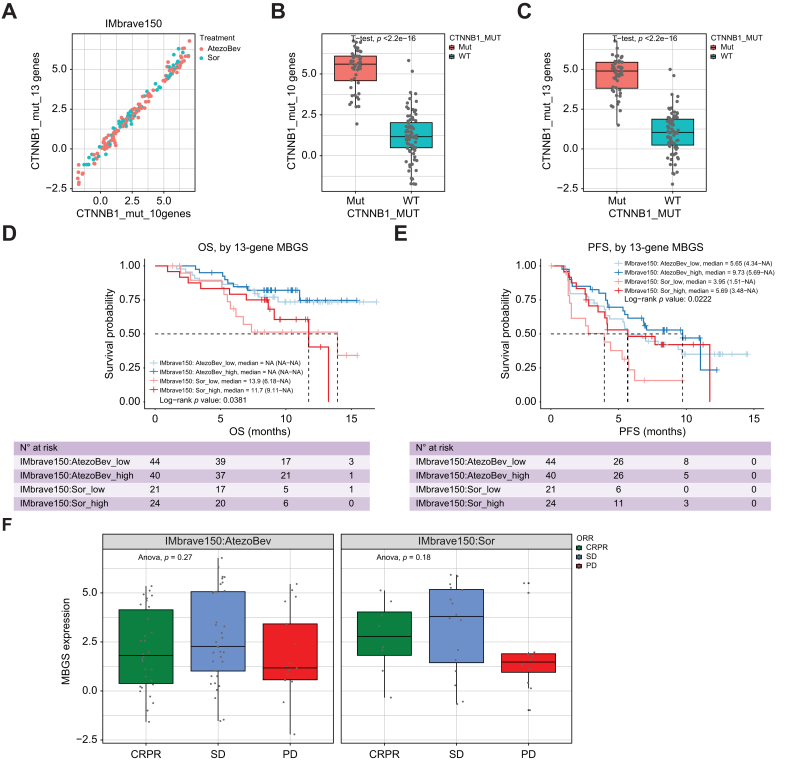
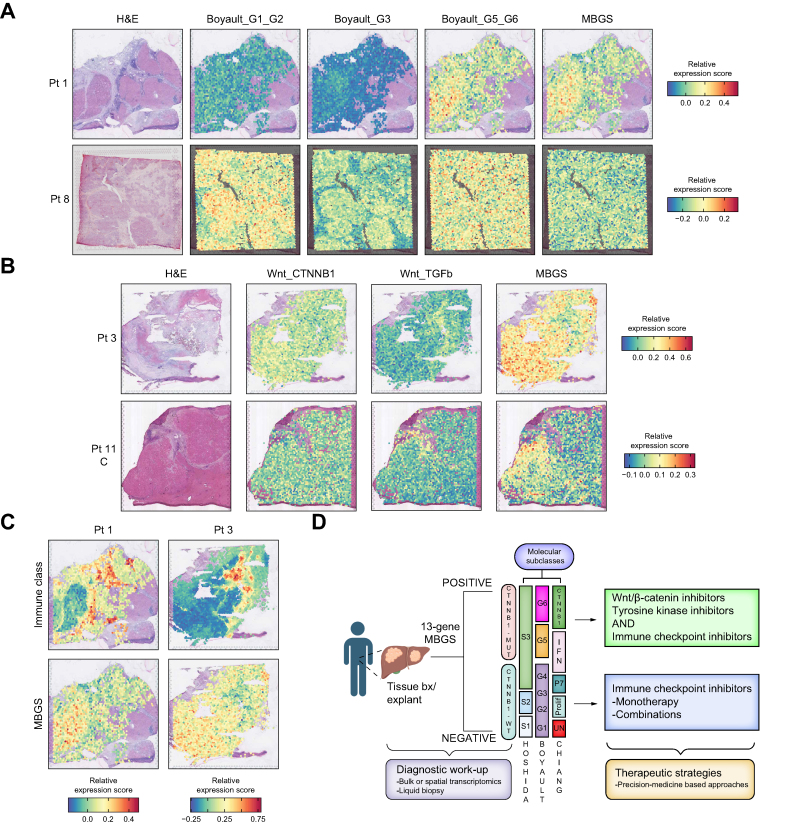
Results: Bulk RNA-seq comparing HCC specimens in mutant β-catenin-Nrf2, β-catenin-Met and β-catenin-Nrf2-Met to Nrf2-Met HCC model yielded 95 common upregulated genes. In The Cancer Genome Atlas (TCGA)-LIHC dataset, differential gene expression analysis with false discovery rate (FDR) = 0.05 and log2(fold change) >1.5 on the 95 common genes comparing CTNNB1-mutated vs. wild-type patients narrowed the gene panel to a 13-gene MBGS. MBGS predicted CTNNB1-mutations in TCGA (n = 374) and French (n = 398) patient cohorts with AUCs of 0.90 and 0.94, respectively. Additionally, a higher MBGS expression score was associated with lack of significant improvement in overall survival or progression-free survival in the atezolizumab-bevacizumab arm vs. the sorafenib arm in the IMbrave150 cohort. MBGS performed comparable or superior to other CTNNB1-mutant classifiers. MBGS overlapped with Hoshida S3, Boyault G5/G6, and Chiang CTNNB1 subclass tumors in TCGA and in HCC spatial transcriptomic datasets visually depicting these tumors to be situated in an immune excluded tumor microenvironment.

Conclusions: MBGS will aid in patient stratification to guide precision medicine therapeutics for CTNNB1-mutated HCC subclass as a companion diagnostic, as anti-β-catenin therapies become available.

Impact and implications: As precision medicine for liver cancer treatment becomes a reality, diagnostic tools are needed to help classify patients into groups for the best treatment choices. We have developed a molecular signature that could serve as a companion diagnostic and uses bulk or spatial transcriptomic data to identify a unique subclass of liver tumors. This subgroup of liver cancer patients derive limited benefit from the current standard of care and are expected to benefit from specialized directed therapies that are on the horizon.

Keywords: Gene signature; Hepatocellular carcinoma; Immunotherapy; Liver cancer; Precision medicine; Spatial transcriptomics; β-catenin.


Figures

Image 1
Graphical abstract
Fig. 1
Fig. 1
Influence of Nrf2 and Met pathway activation on gene expression in HCC with and without CTNNB1-mutations. (A) Venn diagram of 374 The Cancer Genome Atlas-Liver Hepatocellular Carcinoma (TCGA-LIHC) patients categorized as Nrf2-high, Met-high, or CTNNB1-mutated, and their patient overlap. Eighteen (4.8% all HCC) patients had overlap of CTNNB1-mutation, Nrf2-high, Met-high. (B) Top 10 pathways based on p value from Ingenuity pathway analysis (IPA) of differentially expressed genes comparing patients categorized as Nrf2-/Met-high (n = 54) vs. normal (n = 50). Specifically, 5,238 differentially expressed genes were applied to IPA analysis with cutoff of false discovery rate (FDR) = 0.001 and absolute logFC >3. (C) Top 10 pathways based on p value from IPA of differentially expressed genes comparing patients categorized as CTNNB1-mutated/Nrf2-/Met-high (n = 18) vs. normal (n = 50). Specifically, 5,114 differentially expressed genes were subjected to IPA analysis with cutoff of FDR = 0.001 and absolute logFC >3. For both (A) and (B) ranking of pathways based on -log(p value) and activation/inhibition of pathway determined by z-score. Percentages and frequencies are shown. (D) (Left) Pie chart depicting the distribution of exon mutations and (Right) stacked bar plot depicting the frequency of different exon 3 mutations in CTNNB1-mutated/Nrf2-/Met-high patients. (E) Kaplan-Meier curve showing trending decreased overall survival (OS) in CTNNB1-mutated/Nrf2-/Met-high (n = 18) compared with other CTNNB1 mutated cases (n = 80). Log-rank test p = 0.104. Levels of significance: p <0.05, ∗∗p <0.001, ∗∗∗p <0.0001.
Fig. 2
Fig. 2
Establishing murine liver cancer models of mutated-CTNNB1 with or without mutated-NFE2L2 and hMET. (A) Schematic showing the timeline of sleeping beauty transposon/transposase with hydrodynamic tail vein injection (SB-HDTVi) of S45Y-CTNNB1 with or without G31A-NFE2L2 and hMET in 6-week-old FVB mice. (B) Kaplan-Meier curve showing decreased survival of S45Y-CTNNB1-G31A-NFE2L2-hMET compared with G31A-NFE2L2-hMET mice. Log-rank test p <0.0001 for global comparisons. (C) Bar graph shows significant increase in liver weight (LW)/body weight (BW) ratio in S45Y-CTNNB1-G31A-NFE2L2-hMET mice compared with wild-type FVB liver at same timepoint of euthanasia (Student’s t-test ∗p = 0.0159). (D) Bar graph showing significant increase in LW/BW ratio in G31A-NFE2L2-hMET mice compared with wild-type FVB liver at the same timepoint of euthanasia (Student’s t-test; ∗∗p = 0.0036). For both (C) and (D) bars represent standard deviation and individual data points are plotted with top of the bar representing the mean. (E) Macroscopic images of the whole livers from S45Y-CTNNB1-G31A-NFE2L2-hMET and G31A-NFE2L2-hMET at 14-weeks (upper panel) and ∼5-week (lower panel) post injection. Gross images suggest presence of advanced liver tumors in each group. LW/BW ratio for each picture shown as percentage in red in the image. (F). Immunohistochemistry shows tumor foci to be positive for β-catenin targets glutamine synthetase (GS) and Cyclin D1 in S45Y-CTNNB1-G31A-NFE2L2-hMET (middle panel) compared with G31A-NFE2L2-hMET (lower panel). Levels of significance: ∗p <0.05, ∗∗p <0.001, ∗∗∗p <0.0001.
Fig. 3
Fig. 3
Transcriptomic analysis of multiple β-catenin-mutated and non-mutated models reveals differences in gene expression. (A) Description of the samples used for transcriptomic analysis. Each mouse tumor model had three replicates sequenced. (B) Principal component analysis demonstrates clustering of wild-type distinct from the tumor models, with models of high Met activity clustering similarly and models of high Nrf2 activity clustering similarly. (C) Top 10 pathways based on p value from ingenuity pathway analysis (IPA) of differentially expressed genes comparing S45Y-CTNNB1-G31A-NFE2L2-hMET to wild-type. Specifically, 4,577 differentially expressed genes were applied to IPA analysis with cutoff of false discovery rate (FDR) = 0.05 and absolute log fold change >1.5. (D) Top 10 pathways based on p value from IPA of differentially expressed genes comparing S45Y-CTNNB1-hMET to wild-type. Specifically, 1,543 differentially expressed genes were applied to IPA analysis with cutoff of FDR = 0.05 and absolute log fold change >1.5. (E) Top 10 pathways based on p value from IPA of differentially expressed genes comparing S45Y-CTNNB1-G31A-NFE2L2 to wild-type. Specifically, 4,355 differentially expressed genes were applied to IPA analysis with cutoff of FDR = 0.05 and absolute log fold change >1.5. (F) Top 10 pathways based on p value from IPA of differentially expressed genes comparing G31A-NFE2L2-hMET to wild-type. Specifically, 1,864 differentially expressed genes were applied to IPA analysis with cutoff of FDR = 0.05 and absolute log fold change >1.5. For (C–F) ranking of pathways based on -log(p value) and activation/inhibition of pathway determined by z-score.
Fig. 4
Fig. 4
Transcriptomic analysis comparing β-catenin-mutated to non-mutated models identifies β-catenin specific gene expression signatures. (A) Common 95 upregulated genes comparing the three β-catenin-mutated models to the G31A-NFE2L2-hMET model based on differential gene expression with cutoff of false discovery rate (FDR) = 0.05 and absolute log2 fold change >3. (B) Heatmap of 95 upregulated genes shows high expression in each of the three β-catenin-mutated models compared with the G31A-NFE2L2-hMET model. Normalized and scaled gene expression based on z-score is shown. (C) Common 53 downregulated genes comparing the three β-catenin-mutated models to the G31A-NFE2L2-hMET model based on differential gene expression with cutoff of FDR = 0.05 and absolute log2 fold change >3. (D) Heatmap of 53 downregulated genes shows low expression in each of the three β-catenin-mutated models compared with the G31A-NFE2L2-hMET model. Normalized and scaled gene expression based on z-score is shown. (E) Top 20 pathways based on p value from ingenuity pathway analysis (IPA) of the 95 common upregulated genes from (A). (F) Top 20 pathways based on p value from IPA of the 53 common downregulated genes from (C). For (E, F) ranking of pathways based on -log(p value). G1: wild-type liver; G2: S45Y-CTNNB1-G31A-NFE2L2-hMET; G3: S45Y-CTNNB1-hMET; G4: S45Y-CTNNB1-G31A-NFE2L2; G5: G31A-NFE2L2-hMET.
Fig. 5
Fig. 5
Transcriptomic analysis of mouse-specific β-catenin activated genes in TCGA-LIHC identifies mutated-β-catenin gene signature (MBGS). (A) Volcano plot of differentially expressed genes comparing CTNNB1-mutated (n = 98) vs. CTNNB1-wild-type (n = 276) The Cancer Genome Atlas-Liver Hepatocellular Carcinoma (TCGA-LIHC) cases using the 85 human orthologs of the 95 mouse genes based on differential gene expression with cutoff of false discovery rate (FDR) = 0.05 and absolute log fold change >1.5. (B) Heatmap of the 13 differentially expressed in TCGA-LIHC showing enrichment of the genes in CTNNB1-mutated cases. Normalized and scaled gene expression based on z-score is shown. (C) Boxplot of normalized expression values of each individual gene in the 13-gene panel showing enrichment in CTNNB1-mutated compared with CTNNB1-wild-type and normal tumor liver. Individual values per patient are depicted with bold line in middle representing the median and outside boxes showing inner quartile ranges. One-way ANOVA p value for each gene is as follows: AXIN2 (∗∗∗p <2.22e-16), GLUL (∗∗∗p <2.22e-16), LGR5 (∗∗∗p <2.22e-16), NKD1 (∗∗∗p <2.22e-16), NOTUM (∗∗∗p <2.22e-16), RHBG (∗∗∗p <2.22e-16), SBSPON (∗∗∗p <8.24e-6), SLC1A2 (∗∗∗p <2.22e-16), SLC13A3 (∗∗∗p <2.22e-16), SP5 (∗∗∗p <2.22e-16), TCF7 (∗∗∗p <2.22e-16), TEDMM1 (∗∗∗p <2.22e-16), and TNFRSF19 (∗∗∗p <2.22e-16). Levels of significance: ∗p <0.05, ∗∗p <0.001, ∗∗∗p <0.0001.
Fig. 6
Fig. 6
MBGS classifies CTNNB1-mutated HCC with high accuracy. (A) Boxplot of 13-gene mutated-β-catenin gene signature (MBGS) stratified by CTNNB1-mutated (n = 98), CTNNB1-wild-type (n = 276), and normal tumor liver (n = 50) in The Cancer Genome Atlas-Liver Hepatocellular Carcinoma (TCGA-LIHC). One-way ANOVA p value for 13-gene is ∗∗∗p <2.22e-16. (B) Boxplot of 10-gene MBGS stratified by CTNNB1-mutated (n = 98), CTNNB1-wild-type (n = 276), and normal tumor liver (n = 50) in TCGA-LIHC. One-way ANOVA p value for 10-gene is ∗∗∗p <2.22e-16. For (A) and (B) Individual values per patient are depicted with bold line in middle representing the median and outside boxes showing inner quartile ranges. (C) AUC/ROC curve showing high sensitivity and specificity to classify CTNNB1-mutated cases with 13-gene MBGS of 0.91 and 10-gene MBGS of 0.90 in TCGA-LIHC. (D) Boxplot of 13-gene MBGS stratified by CTNNB1-mutated (n = 118), CTNNB1-wild-type (n = 280), and normal tumor liver (n = 31) in French cohort. One-way ANOVA p value for 13-gene is ∗∗∗p <2.22e-16. (E) Boxplot of 10-gene MBGS stratified by CTNNB1-mutated (n = 118), CTNNB1-wild-type (n = 280), and normal tumor liver (n = 31) in French cohort. One-way ANOVA p value for 13-gene is ∗∗∗p <2.22e-16. For (E) and (F) Individual values per patient are depicted with bold line in middle representing the median and outside boxes showing inner quartile ranges. (F) AUC/ROC curve showing high sensitivity and specificity to classify CTNNB1-mutated cases with 13-gene MBGS of 0.95 and 10-gene MBGS of 0.94 in French cohort. (G) Stratification of 10-gene MBGS by HCC Hoshida G1-G6 subgroups showing enrichment in G5/G6 groups. (H) Stratification of 13-gene MBGS by HCC Hoshida G1-G6 subgroups showing enrichment in G5/G6 groups. For (G) and (H) Individual values per patient are depicted with the bold line in middle representing the median and outside boxes showing inner quartile ranges; no statistical test was used, but depicted this way for visual representation across the different subclasses. Levels of significance: ∗p <0.05, ∗∗p <0.001, ∗∗∗p <0.0001.
Fig. 7
Fig. 7
MBGS predicts relative response to sorafenib in IMbrave150 trial cohort. (A) Correlation based on expression of 10-gene and 13-gene mutated-β-catenin gene signature (MBGS) in IMbrave150 trial cohort. (B) Box plot of expression of 10-gene MBGS in CTNNB1 wild-type (n = 82) and mutant (n = 48) cases in IMbrave150 cohort. Student’s t-test p value comparing mutated vs. wild-type patients is ∗∗∗p <2.22e-16. (C) Box plot of expression of 13-gene MBGS in CTNNB1 wild-type (n = 82) and mutant (n = 48) cases in the IMbrave150 cohort. Student’s t-test p value comparing mutated vs. wild-type patients is ∗∗∗p <2.22e-16. For (B) and (C) Individual values per patient are depicted with bold line in middle representing the median and outside boxes showing inner quartile ranges (D) Kaplan–Meier curve for overall survival demonstrating improved response to sorafenib in MBGS-high patients. Log-rank p value is ∗p = 0.0381. (E) Kaplan–Meier curve for progression-free survival (PFS) demonstrating improved response to sorafenib in MBGS-high patients. Response to atezolizumab/bevacizumab is comparable between MBGS-high/low patients. Log-rank p value is ∗p = 0.0222. Log-rank test was used to determine differences in mean survival time. (F) MBGS expression stratified by complete/partial response (CR/PR), stable disease (SD), or progressive disease (PD) defined by mRECIST criteria in each arm. Higher MBGS expression correlated well with sorafenib response. In atezo/bev arm, one-way ANOVA p = 0.27. In sorafenib arm, One-way ANOVA p = 0.18. For (F), individual values per patient are depicted with bold line in middle representing the median and outside boxes showing inner quartile ranges; no statistical test was used but depicted this way for visual representation across the different subclasses. Levels of significance: ∗p <0.05, ∗∗p <0.001, ∗∗∗p <0.0001.
Fig. 8
Fig. 8
Spatial mapping of molecular gene signatures reveals MBGS-hot tumors are immune excluded. (A) Representative H&E and spatial gene expression plots of Boyault molecular subclassification and mutated-β-catenin gene signature (MBGS) on same tissue section for a MBGS-hot and MBGS-low tumor. MBGS overlaps with Boyault G5/G6 but is exclusive to Boyault G1/G2 tumors. (B) Representative H&E and spatial gene expression plots of Lachenmayer Wnt signatures and MBGS on same tissue section. Spatial mapping of MBGS highlights tumor nodules more clearly than previously published Wnt-CTNNB1 signatures. (C) Representative H&E and spatial gene expression plots of Sia immune signatures and MBGS on same tissue section. MBGS-hot tumors are immune excluded inside tumor nodules but may have an inflamed stroma. For (A–C), relative expression module scores are depicted with red being higher expression and blue being lower expression. (D) Diagnostic and therapeutic proposed work-up algorithm using MBGS as a companion diagnostic. Patients which are MBGS-high may benefit from anti-β-catenin therapies + ICIs. Figure created using BioRender.com.

References

    1. Sung H., Ferlay J., Siegel R.L., et al. Global cancer statistics 2020: GLOBOCAN estimates of incidence and mortality worldwide for 36 cancers in 185 countries. CA Cancer J Clin. 2021;71:209–249. - PubMed
    1. Toh M.R., Wong E.Y., Wong S.H., et al. Global epidemiology and genetics of hepatocellular carcinoma. Gastroenterology. 2023;164:766–782. - PubMed
    1. Llovet J.M., Zucman-Rossi J., Pikarsky E., et al. Hepatocellular carcinoma. Nat Rev Dis Primers. 2016;2 - PubMed
    1. Cheng A.L., Qin S., Ikeda M., et al. Updated efficacy and safety data from IMbrave150: atezolizumab plus bevacizumab vs. sorafenib for unresectable hepatocellular carcinoma. J Hepatol. 2022;76:862–873. - PubMed
    1. Abou-Alfa G.K., Lau G., Kudo M., et al. Tremelimumab plus durvalumab in unresectable hepatocellular carcinoma. NEJM Evid. 2022;1 - PubMed