. 2024 Nov 19:19:11973-11996.
doi: 10.2147/IJN.S488532. eCollection 2024.

Targeted Delivery and ROS-Responsive Release of Lutein Nanoassemblies Inhibit Myocardial Ischemia-Reperfusion Injury by Improving Mitochondrial Function

Affiliations

Targeted Delivery and ROS-Responsive Release of Lutein Nanoassemblies Inhibit Myocardial Ischemia-Reperfusion Injury by Improving Mitochondrial Function

Pilong Shi et al. Int J Nanomedicine. .

Abstract

Purpose: Myocardial ischemia-reperfusion injury (MI/RI) is associated with increased oxidative damage and mitochondrial dysfunction, resulting in an elevated risk of mortality. MI/RI may be alleviated by protecting cardiomyocytes from oxidative stress. Lutein, which belongs to a class of carotenoids, has proven to be effective in cardiovascular disease treatment due to its remarkable antioxidant properties, but its application is limited due to its poor stability and low bioavailability in vivo.

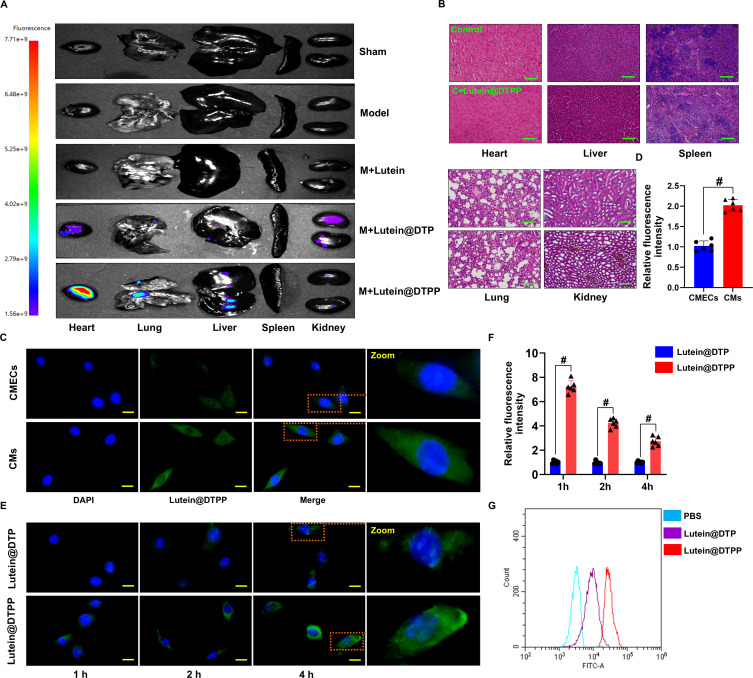
Methods: In this study, a delivery system was developed based on distearoyl phosphatidyl ethanolamine (DSPE)-thiol-ketone (TK)-PEG2K (polyethylene glycol 2000) (abbreviated as DTP) and PCM-SH (CWLSEAGPVVTVRALRGTGSW) to deliver lutein (abbreviated as lutein@DTPP) to damaged myocardium. First, lutein, lutein@DTP, or lutein@DTPP were injected through the tail vein once a day for 3 days and then MI/RI model rats were established by exposing rats to ischemia for 45 min and reperfusion for 6 h. We employed a range of experimental techniques including qRT-PCR, Western blotting, transmission electron microscopy, immunohistochemistry, immunofluorescence, flow cytometry, immunoprecipitation, molecular docking, and molecular dynamics simulations.

Results: Lutein@DTPP exhibited good myocardial targeting and ROS-responsive release. Our data suggested that lutein@DTPP effectively suppresses ferroptosis in cardiomyocytes. Mechanistically, we observed an upregulation of mouse double minute-2 (MDM2) in the hearts of MI/RI models and cardiomyocytes exposed to hypoxia/reoxygenation (H/R) conditions. In addition, NADH-ubiquinone oxidoreductase 75 kDa Fe-S protein 1 (NDUFS1) translocation from the cytosol to the mitochondria was inhibited by MDM2 upregulation. Notably, no significant variation in the total NDUFS1 expression was observed in H/R-exposed cardiomyocytes following treatment with siMDM2. Further study indicated that lutein facilitates the translocation of NDUFS1 from the cytosol to mitochondria by directly binding and sequestering MDM2, thereby improving mitochondrial function and inhibiting ferroptosis.

Conclusion: Lutein@DTPP promoted the mitochondrial translocation of NDUFS1 to restore mitochondrial function and inhibited the ferroptosis of cardiomyocytes by directly binding and sequestering MDM2.

Keywords: MDM2; NDUFS1; ROS; ferroptosis; lutein; myocardial ischemia-reperfusion injury.


Conflict of interest statement

The authors declare that they have no conflicts of interest.

Figures

None
Graphical abstract
Figure 1
Figure 1
The synthesis formula of DSPE-PEG2K-MAL and PCM-SH. (A) The synthetic route of DSPE-PEG2K-MAL and PCM-SH.
Figure 2
Figure 2
Preparation and Characteristics of lutein@DTPP. (A) Schematic illustration of lutein@DTPP preparation. (B) Nuclear magnetic resonance spectroscopy of DSPE-PEG2K-PCM-SH. (C) TEM image of lutein@DTPP. (D) Size of lutein@DTP and lutein@DTPP. (E and F) Fluorescence spectrum analysis of lutein@DTPP and lutein@DTP. (G) Zeta potential of lutein@DTP and lutein@DTPP. (H) Release profiles of lutein from nanoparticles. Data are presented as mean ± SD (n = 3).
Figure 3
Figure 3
Assessment of the targeting ability of lutein@DTPP and cellular uptake. (A) Vivo fluorescence imaging of nanoparticles in the rat heart and other organs following lutein, lutein@DTP, or lutein@DTPP administration. (B) Histology characteristics of major organs of lutein@DTPP treated healthy rat were detected by HE staining. (C and D) Visualization of lutein@DTPP uptake by CMECs and CMs by fluorescence microscopy. Data are presented as mean ± SD (n=6). #P < 0.05 vs CMECs group. (E and F) Intercellular localization of lutein@DTP and lutein@DTPP in CMs at various periods is shown in immunofluorescence imaging. Green-labeled lutein@DTP and lutein@DTPP with DAPI-stained nuclei (blue). (G) Analysis via flow cytometry of the uptake of FITC-labeled nanoparticles by CMs. Data are presented as mean ± SD (n=6). #P < 0.05 vs lutein@DTP group. Model: rats treated with ischemia for 45 min and then reperfusion for 6 h. Scale bars: (B) 50 μm; (C and E) 10 μm.
Figure 4
Figure 4
Injection of lutein@DTPP decreased the infarct area and improved cardiac function in rats. (A) The time axis scheme that illustrates the experimental design for the animal study. (B) Images of echocardiography that are representative of each group. (C and D) Analysis of LVFS and LVEF. (E) Histopathological images of the cardiac tissue sections of rats stained with HE. (F and G) Detection of infarct areas in cardiac tissue sections with TTC staining. (H) Representative immunohistochemical staining of γH2AX in hearts of rats. γH2AX positive cells were labeled with DAB. DAPI (blue, nuclei); γH2AX positive (brown). (I) The LASCA technique was used to assess the spatial vascular profile and flow velocity in the infarct area of various groups. (J) The mean flux was qualified. Data are presented as mean ± SD (n=6). #P < 0.05 vs Sham group; *P < 0.05 vs Model group. Scale bars: (E) 50 μm; (H) 25 μm.
Figure 5
Figure 5
Lutein@DTPP decreased ROS to inhibit ferroptosis in MI/RI rats. (A) ROS levels were detected after treatment with lutein, lutein@DTP, or lutein@DTPP in the hearts of MI/RI rats. (B) Representative immunohistochemical staining of 4-HNE. (C) Production of MDA in rats after MI/RI. (D) Representative transmission electron-microscopic images of mitochondria in rats treated with lutein, lutein@DTP, or lutein@DTPP. (E) Quantification of relative ptgs2 mRNA expression in cardiac tissue by qRT-PCR. Data are presented as mean ± SD (n=6). #P < 0.05 vs Sham group; *P < 0.05 vs Model group. Scale bars: (B) 50 μm; (D) 2.0 μm.
Figure 6
Figure 6
Lutein@DTPP inhibited ferroptosis in cardiomyocytes exposed to H/R. (A) The time axis scheme for the H/R-induced cell research is shown. Data are depicted as mean ± SD (n=6). (B) CCK-8 results of normal cardiomyocytes after different concentrations of lutein treatment. #P < 0.05 vs 0 μM group. (C) CCK-8 results of H/R-injured cardiomyocytes treated with lutein, lutein@DTP, or lutein@DTPP. (D) Fluorescence images of γH2AX in H/R-injured cardiomyocytes. (E and F) Representative fluorescence images of mitochondrial and intracellular ROS production. (G) MDA levels in cardiomyocytes. (H) Ptgs2 mRNA expression in cardiomyocytes upon H/R insult. Data are presented as mean ± SD (n=6). #P < 0.05 vs Control group; *P < 0.05 vs Model group. Scale bars: (D and F) 25 μm; (E) 10 μm. Model: cardiomyocytes treated with hypoxia 12 h and then reoxygenation 24 h.
Figure 7
Figure 7
Lutein@DTPP improved mitochondrial function of H/R-induced cardiomyocytes. (A) Illustrative images showing the fluorescence of JC-1 in the H/R cardiomyocytes. (B and C) Measure of OCR and respective quantitative analysis in cardiomyocytes. Data are presented as mean ± SD (n=6). #P < 0.05 vs Control group; *P < 0.05 vs Model group. Scale bars: 25 μm. Model: cardiomyocytes treated with hypoxia 12 h and then reoxygenation 24 h.
Figure 8
Figure 8
MDM2 deficiency improved mitochondrial function. (A and B) Representative Western blot images of NDUFS1 and MDM2, together with quantification in cardiomyocytes. (C and D) Immunoblot analysis of NDUFS1 and MDM in myocardial tissue. Data are presented as mean ± SD (n=6). #P < 0.05 vs Sham group. (E) Co-IP was used to illustrate the interplay between NDUFS1 and MDM2. (F and G) Immunoblot analysis of MDM2 in cardiomyocytes. (H) Western blotting illustrating the variation between the Model and Model+siMDM2 groups in terms of the cellular distribution of NDUFS1. (I) Illustrative images showed the fluorescence of JC-1 in cardiomyocytes induced with H/R and those treated with MDM2 knockdown. (J) Comparative analysis of the mitochondrial complex I activity of cardiomyocytes in various groups. (K and L) Cardiomyocytes were subjected to OCR and quantitative analysis. (M and N) Detection of intracellular and mitochondrial ROS production in the cardiomyocytes. Data are presented as mean ± SD (n=6). #P < 0.05 vs Control group; *P < 0.05 vs Model group. Scale bars: (M and I) 25 μm; (N) 10 μm.
Figure 9
Figure 9
MDM2 deficiency suppressed cardiomyocytes ferroptosis. (A) MDA levels in H/R-treated cardiomyocytes induced by MDM2 knockdown. (B) GSH levels in H/R-treated cardiomyocytes induced by MDM2 knockdown. (C) Fluorescence imaging of Gpx4 in H/R-injured cardiomyocytes treated by silencing MDM2. (D) Relative mRNA expression of ptgs2. (E) Fluorescence imaging of γH2AX in H/R-injured cardiomyocytes treated by silencing MDM2. (F) The CCK-8 outcomes of H/R-damaged cardiomyocytes after MDM2-silencing therapy. Data are presented as mean ± SD (n=6). #P < 0.05 vs Control group; *P < 0.05 vs Model group. Scale bars: (C) 10 μm; (E) 25 μm.
Figure 10
Figure 10
Molecular dynamics simulation results of lutein and MDM2 protein. (A and B) Representative Western blot images of NDUFS1. (C and D) Immunoblot analysis of MDM2 in cardiomyocytes. (E) Predicted binding mode between lutein and MDM2. (F) RMSD curves of MDM2 (blue) and lutein (red) in 100 ns molecular dynamics simulation. (G) 100 conformational superpositions saved per 1 ns in a 100 ns molecular dynamics simulation. (H) RMSF analysis diagram of MDM2 during 50–100 ns molecular dynamics simulation (the green marked part represents the location of amino acids interacting with the molecule). (I) B-factor distribution map based on MD molecular dynamics trajectory calculation. (J) RMSF (root-mean-square fluctuation) analysis of lutein during 50–100 ns molecular dynamics simulation. (K) Analysis of the contribution of key amino acids to lutein binding at binding sites. (L) A two-dimensional diagram of the binding model of lutein and MDM2 during molecular dynamics simulation. (M) The binding free energy of the last 10 ns of lutein and MDM2 is 1000 frames. (N and O) NDUFS1 protein expression in mitochondria of H/R-induced cardiomyocytes upon lutein@DTPP treatment under the condition of MDM2 overexpression. Data are displayed as mean ± SD (n=6). #P < 0.05 vs Control group; *P < 0.05 vs Model group; @P < 0.05 vs M+lutein@DTPP group.
Figure 11
Figure 11
Overexpression of MDM2 abrogated the protective effect of lutein@DTPP on mitochondria. (A) Representative fluorescence images of mitochondrial ROS production. (B) Images that exemplify the fluorescence of JC-1 in cardiomyocytes. (C) Analysis of mitochondrial complex I activity in cardiomyocytes. (D and E) Measurement of OCR in cardiomyocytes and the corresponding quantitative analysis. (F) Cardiomyocyte viability is assessed via CCK-8. Data are displayed as mean ± SD (n=6). #P < 0.05 vs Control group; *P < 0.05 vs Model group; @P < 0.05 vs M+lutein@DTPP group. Scale bars: (A) 10 μm; (B) 25 μm.

References

    1. Hao Y, Zhao D, Liu J, et al. Performance of management strategies with class i recommendations among patients hospitalized with st-segment elevation myocardial infarction in China. JAMA Cardiol. 2022;7(5):484–491. doi:10.1001/jamacardio.2022.0117 - DOI - PMC - PubMed
    1. Zhang Z, Dalan R, Hu Z, et al. Reactive oxygen species scavenging nanomedicine for the treatment of ischemic heart disease. Adv Mater. 2022;34(35):e2202169. doi:10.1002/adma.202202169 - DOI - PubMed
    1. Huang Q, Yao Y, Wang Y, et al. Ginsenoside Rb2 inhibits p300-mediated SF3A2 acetylation at lysine 10 to promote Fscn1 alternative splicing against myocardial ischemic/reperfusion injury. J Adv Res. 2023;13:S2090–1232(23)00399–5. - PMC - PubMed
    1. Ale-Agha N, Jakobs P, Goy C, et al. Mitochondrial telomerase reverse transcriptase protects from myocardial ischemia/reperfusion injury by improving complex i composition and function. Circulation. 2021;144(23):1876–1890. doi:10.1161/CIRCULATIONAHA.120.051923 - DOI - PubMed
    1. Song R, Dasgupta C, Mulder C, Zhang L. MicroRNA-210 controls mitochondrial metabolism and protects heart function in myocardial infarction. Circulation. 2022;145(15):1140–1153. doi:10.1161/CIRCULATIONAHA.121.056929 - DOI - PMC - PubMed

MeSH terms