. 2024 Nov 19:19:12079-12098.
doi: 10.2147/IJN.S480168. eCollection 2024.

Hybrid Biosilica Nanoparticles for in-vivo Targeted Inhibition of Colorectal Cancer Growth and Label-Free Imaging

Affiliations

Hybrid Biosilica Nanoparticles for in-vivo Targeted Inhibition of Colorectal Cancer Growth and Label-Free Imaging

Donatella Delle Cave et al. Int J Nanomedicine. .

Abstract

Background: Metastasis-initiating cells are key players in progression, resistance, and relapse of colorectal cancer (CRC), by leveraging the regulatory relationship between Transforming Growth Factor-beta (TGF-β) signaling and anti-L1 cell adhesion molecule (L1CAM).

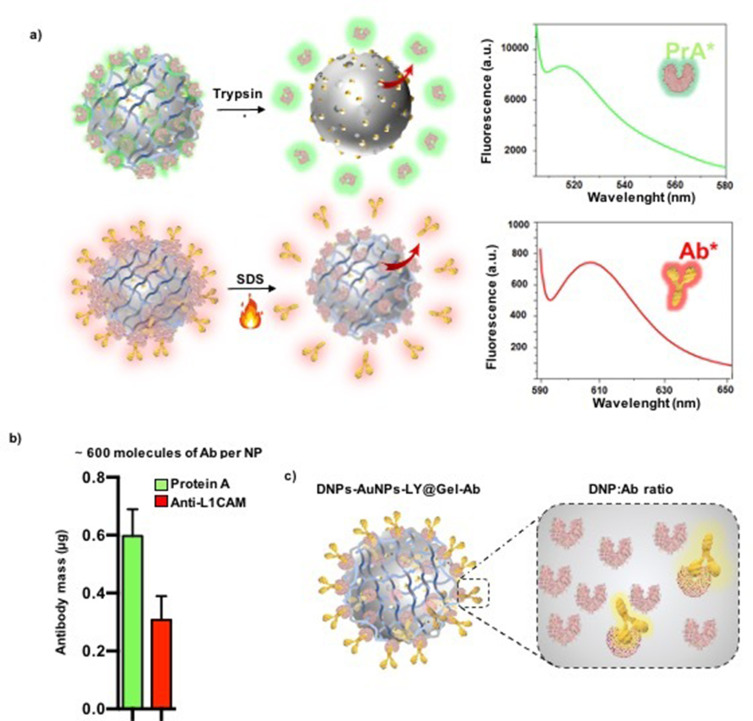
Methods: This study introduces a novel strategy for CRC targeted therapy and imaging based on the use of a hybrid nanosystem made of gold nanoparticles-covered porous biosilica further modified with the (L1CAM) antibody.

Results: The nanosystem intracellularly delivers galunisertib (LY), a TGF-β inhibitor, aiming to inhibit epithelial-mesenchymal transition (EMT), a process pivotal for metastasis. Anti-L1CAM antibody-functionalized nanoparticles (NPs) target tumor-initiating cells expressing L1CAM, inhibiting cancer growth. The number of antibody molecules conjugated to the single NP is precisely quantified, revealing a high surface coverage that facilitates the tumor targeting. The therapeutic efficacy of the nanosystem is investigated in organoid-like cultures of CRC cells and in vivo mouse models, showing a significant reduction in tumor growth. The spatial distribution of NPs within CRC tumors from mice is investigated using a label-free optical approach based on Raman micro-spectroscopy.

Conclusion: This research highlights the multifunctional capabilities of engineered biosilica NPs, which offer new insights in targeted CRC therapy and imaging, improving patient outcomes and paving the way for personalized therapies.

Keywords: Raman imaging; antibody quantification; biosilica nanoparticle; colorectal cancer; in vivo treatment; targeted drug delivery.


Conflict of interest statement

Chiara Tramontano is currently affiliated with Internal Medicine Department, Radboud University Medical Center, Radboud, The Netherlands. The authors report no conflict of interest in this work.

Figures

Scheme 1
Scheme 1
(a) Drug loading and functionalization of DNPs with gelatin and anti-L1CAM antibody. (b) Active targeting of cells with hybrid DNPs-AuNPs-LY@Gel-Ab promotes specific binding to cells and local accumulation of NPs. (c) The effects of the treatment were investigated on tissue sections, assessing the presence of NPs inside the tumor by label-free Raman imaging.
Figure 1
Figure 1
(a) DLS analysis of NPs’ size. (b) Analysis of NPs’ surface charge. (c) LSPR response of the plasmonic DNPs-AuNPs (black line) after gelatin capping (DNPs-AuNPs-LY@Gel, red line) and further surface modification with the protein A (DNPs-AuNPs-LY@Gel-PrA, green light). (d) Fluorescence microscopy analysis of DNPs-AuNPs-LY@Gel, (e) DNPs-AuNPs-LY@Gel-PrA* both excited at 488 nm, and (f) DNPs-AuNPs-LY@Gel-Ab* excited at 530 nm. The scale bars are 25 µm.
Figure 2
Figure 2
(a, upper) Fluorescence intensity of PrA* molecules released from 100 µg DNPs-AuNPs-LY@Gel-PrA* through enzymatic degradation. (a, lower) Fluorescence intensity of Ab* molecules separated from 100 µg DNPs-AuNPs-LY@Gel-Ab* after denaturation with 2% SDS and heating exposure. The number of proteins and antibodies per DNP is estimated in (b); errors are calculated from five independent functionalization procedures. (c) Schematic illustration of PrA and Ab distribution on the surface of each DNP.
Figure 3
Figure 3
Confocal analysis of (DNPs-AuNPs) *-LY@Gel-PrA (a), red staining) and (DNPs-AuNPs) *-LY@Gel-Ab (b), red staining) by LS.174T and SW620 CRC cells. The nuclei (blue) and the filamentous actin (green) were stained using Hoechst and Alexa 488-labeled phalloidin, respectively. (c) The graph shows the quantification of the cell-associated red fluorescence. The scale bars are 20 µm. ** p<0.005, n≥3.
Figure 4
Figure 4
(a) qPCR analysis of EMT, CXCR4, and MMPs genes in LS.174T cells grew for 24 h in the presence of the indicated treatments. Data are normalized to GAPDH expression and are presented as FC in gene expression relative to DNPs-AuNPs. (b) qPCR analysis of EMT, CXCR4, and MMPs genes in SW620 cells grew for 24 h in the presence of the indicated treatments. Data are normalized to GAPDH expression and are presented as FC in gene expression relative to DNPs-AuNPs. (c) Migration assay for LS.174T and SW620 cells incubated for 24 h with the indicated treatments. The nuclei were stained with DAPI (blue). (d) Migratory potential for LS.174T and SW620 cells grew for 24 h in the presence of the indicated treatments. (e) Representative images of LS.174T and SW620 organoids-like grew for 24 hours in the presence of the indicated treatments. (f) Organoid formation capacity for LS.174T and SW620 cells incubated for 24 h with the indicated treatments. (g) Organoid size for LS.174T and SW620 cells grew for 24 h in the presence of the indicated treatments. The scale bars are 100 µm. *p<0.05, ** p<0.005, *** p<0.0005, n≥6.
Figure 5
Figure 5
(a) In vivo tumor growth of subcutaneously (s.c.) injected SW620 cells into nude athymic mice. When tumors reached 100 mm3, mice were randomized and treated with vehicle (PBS), LY (1.25 μg), DNPs-AuNPs (25 μg), DNPs-AuNPs-LY@Gel (25 μg), DNPs-AuNPs-LY@Gel-Ab (25 μg), respectively. Tumor size was measured every week, and tumor volume was calculated. Data are shown as mean (points) ± s.d. *p<0.05 compared to untreated mice. n=8. (b) Images of tumors derived from SW620 cells s.c. injected into nude athymic mice and treated with vehicle (PBS) or the indicated treatments. (c) Representative hematoxylin and eosin (H&E) images of external tissue sections from s.c. tumors derived from SW620 injected cells into nude athymic mice treated with vehicle (PBS) or the indicated treatments. (d) Percentage of necrotic area of the external tissue sections from s.c. tumors derived from SW620 injected cells into nude athymic mice treated with vehicle (PBS) or the indicated treatments. (e) Representative H&E images of innermost tissue sections from s.c. tumors derived from SW620 injected cells into nude athymic mice treated with vehicle (PBS) or the indicated treatments. (f) Percentage of necrotic area of the innermost tissue sections from s.c. tumors derived from SW620 injected cells into nude athymic mice treated with vehicle (PBS) or the indicated treatments. *p < 0.05, ***p < 0.0005. n ≥ 5.
Figure 6
Figure 6
(a) Representative immunofluorescence images for pSMAD2 (violet) and nuclei (blue, DAPI) of external tissue from s.c. tumors derived from SW620 injected cells into nude athymic mice treated with vehicle (PBS) or the indicated treatments. Bottom: quantification of pSMAD2 intensity (b) qPCR analysis of EMT, CXCR4, and MMP10 genes in subcutaneous tumors derived from SW620 injected cells treated with vehicle (PBS) or the indicated treatment. Data are normalized to GAPDH expression and are presented as FC in gene expression relative to Ctrl. The scale bars are 100 µm. (c) Schematic representation of the mechanism of action of the nanoplatform. *p<0.05, **p<0.005, ***p<0.0005. n≥4.
Figure 7
Figure 7
Bright field (left panels), Raman map (middle panels) and merged images (left panels) of tumors derived from untreated (Ctrl (a) or treated mice with DNPs-AuNPs-LY@Gel (b) and DNPs-AuNPs-LY@Gel-Ab (c). In Raman maps the tumoral tissue is shown in red while the NPs are shown in green. The scale bars are 20 µm.

References

    1. Siegel RL, Miller KD, Jemal A. Cancer statistics, 2020. CA A Cancer J Clin. 2020;70(1):7–30. doi:10.3322/caac.21590 - DOI - PubMed
    1. Batlle E, Clevers H. Cancer stem cells revisited. Nat Med. 2017;23(10):1124–1134. doi:10.1038/nm.4409 - DOI - PubMed
    1. Holohan C, Van Schaeybroeck S, Longley DB, Johnston PG. Cancer drug resistance: an evolving paradigm. Nat Rev Cancer. 2013;13(10):714–726. doi:10.1038/nrc3599 - DOI - PubMed
    1. Wicki A, Witzigmann D, Balasubramanian V, Huwyler J. Nanomedicine in cancer therapy: challenges, opportunities, and clinical applications. J Control Release. 2015;200:138–157. doi:10.1016/j.jconrel.2014.12.030 - DOI - PubMed
    1. Blanco E, Shen H, Ferrari M. Principles of nanoparticle design for overcoming biological barriers to drug delivery. Nat Biotechnol. 2015;33(9):941–951. doi:10.1038/nbt.3330 - DOI - PMC - PubMed

MeSH terms