. 2024;5(1):733.
doi: 10.1038/s43247-024-01891-w. Epub 2024 Nov 22.

Impacts of agriculture and snow dynamics on catchment water balance in the U.S. and Great Britain

Affiliations

Impacts of agriculture and snow dynamics on catchment water balance in the U.S. and Great Britain

Masoud Zaerpour et al. Commun Earth Environ. 2024.

Abstract

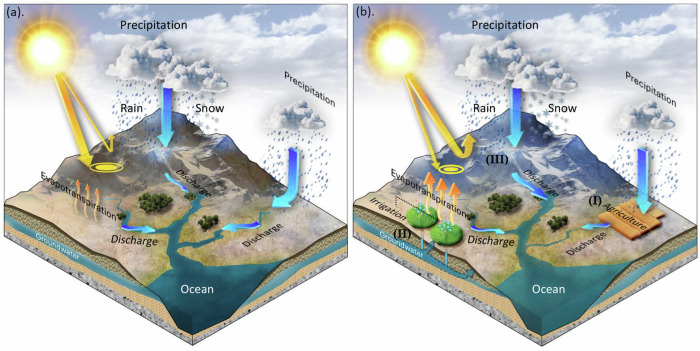
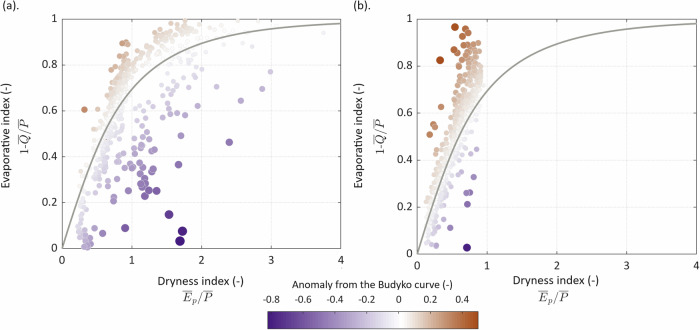
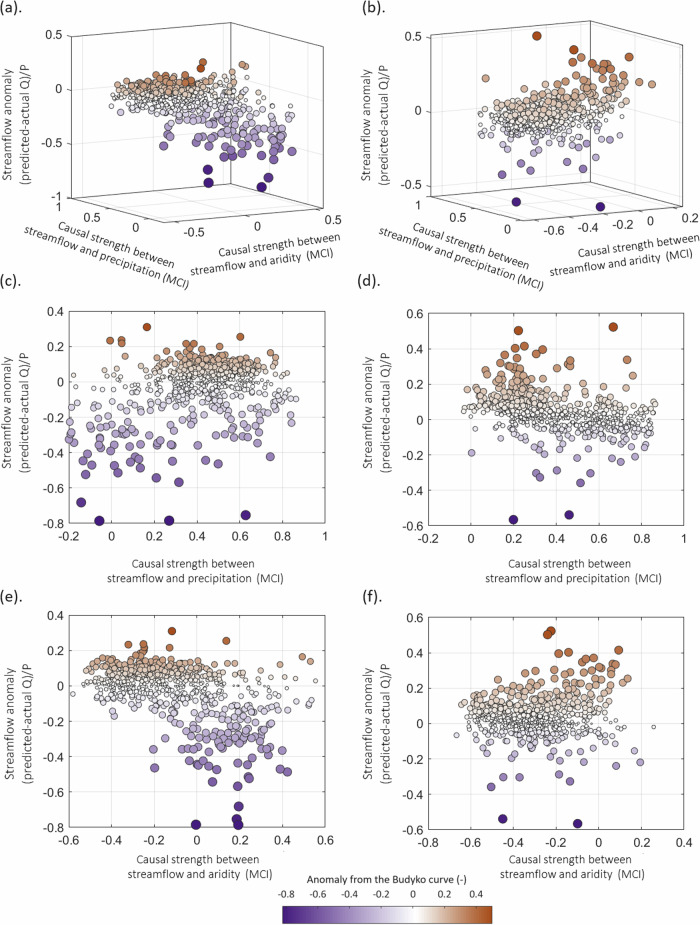
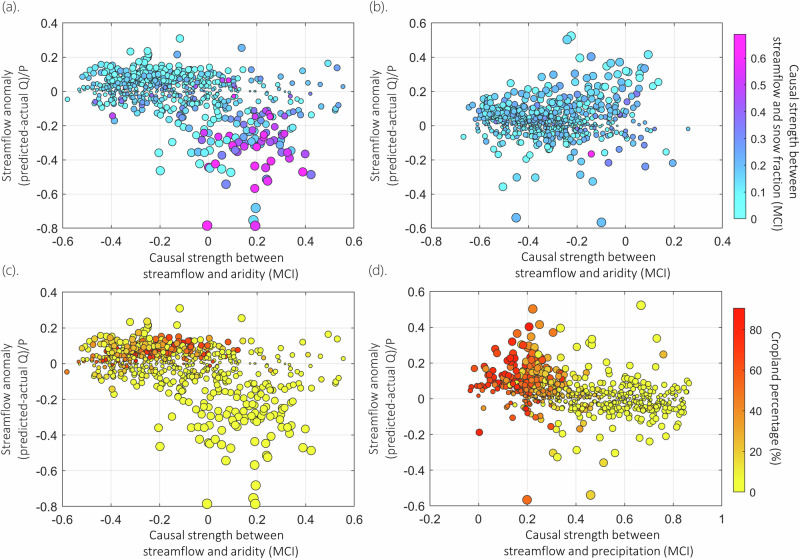
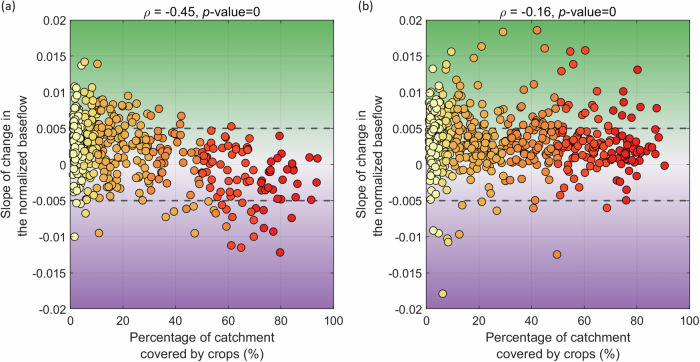
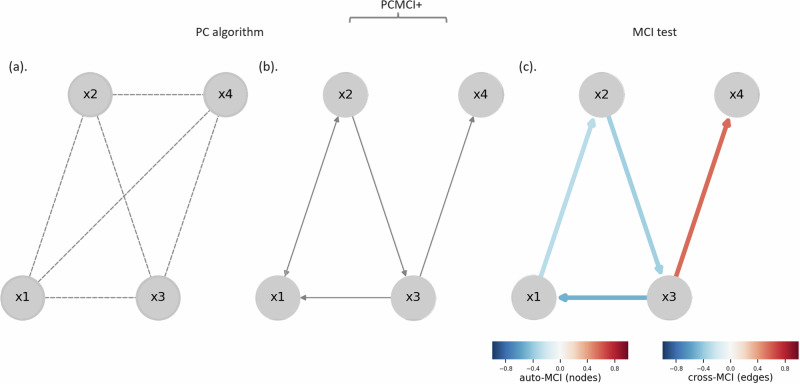
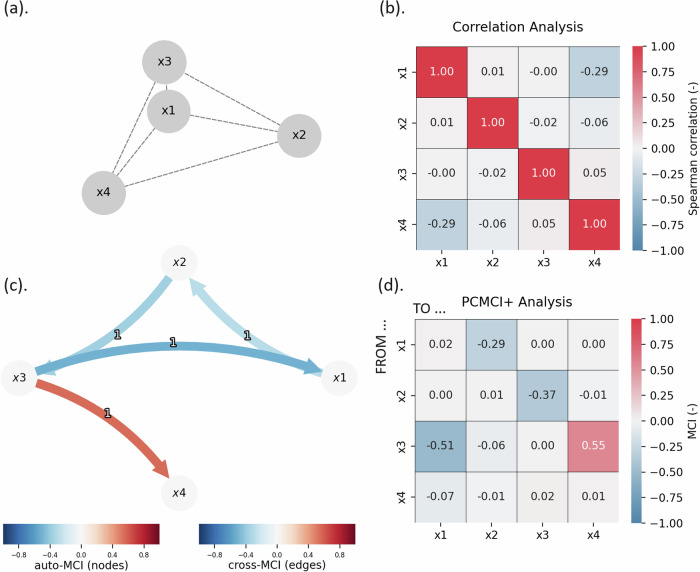
The Budyko water balance is a fundamental concept in hydrology that links aridity to how precipitation is divided between evapotranspiration and streamflow. While the model is powerful, its ability to explain temporal changes and the influence of human activities and climate change is limited. Here we introduce a causal discovery algorithm to explore deviations from the Budyko water balance, attributing them to human interventions such as agricultural activities and snow dynamics. Our analysis of 1342 catchments across the U.S. and Great Britain reveals distinct patterns: in the U.S., snow fraction and irrigation alter the Budyko water balance predominantly through changes in aridity-streamflow relationships, while in Great Britain, deviations are primarily driven by changes in precipitation-streamflow relationships, notable in catchments with high cropland percentage. By integrating causal analysis with the Budyko water balance, we enhance understanding of how human activities and climate dynamics affect water balance, offering insights for water management and sustainability in the Anthropocene.

Keywords: Hydrology.


Conflict of interest statement

Competing interestsThe authors declare no competing interests.

Figures

Fig. 1
Fig. 1. Schematic representation of water cycle changes.
Schematic representation of changes in the water cycle. a a standard water-energy balance equilibrium as per the Budyko hypothesis. b the changes in the water-energy balance due to agriculture (I) irrigation (II), and changes in snow fraction (III).
Fig. 2
Fig. 2. Long-term observed data of studied catchments within the Budyko framework.
The long-term observed data are placed within the framework of the Budyko hypothesis for the US and GB datasets, as depicted in (a, b), respectively (See Method section for further information on the equations that were used). The colours indicate the distance from the Budyko curve.
Fig. 3
Fig. 3. Analysis of long-term observed anomalies from the Budyko curve.
The long-term observed anomalies from the Budyko curve are analyzed through a water-energy balance for the US and GB, as depicted in (a, b), respectively. The z-axis depicts anomalies from the Budyko curve, while the x- and y-axes display the causal strengths between streamflow-precipitation and streamflow-aridity, respectively, reflecting the water-energy balance of the catchments. The projections of the observations over the x- and y-axes are shown in (c) and (e) for the US and panels (d) and (f) for GB.
Fig. 4
Fig. 4. Impact of Snow fraction and cropland percentage on water-energy balance.
The analysis of snow fraction (SF) and cropland percentage (CL%) and their associations with casual relationships between streamflow-aridity-precipitation. a, b present snow fraction analysis for the US and GB, respectively. c, d depict the analysis of CL% for the US and GB, respectively. The points are stratified by shades of blue and red colors across the first and second rows to distinguish between the impacts of SF and CL%. The y-axes represent the deviations from the Budyko curve (i.e., streamflow anomalies), while x-axes indicate the causal strength between aridity/precipitation and streamflow. Only significant patterns are presented here for brevity, and additional details can be found in Supplementary Figs. 2 and 3.
Fig. 5
Fig. 5. Trends in normalized baseflows in relation to cropland percentage.
Analysis of change in the normalized baseflows for the catchments in the US and GB, which contain at least 1% of cropland as a percentage of the total basin area shown in (a, b), respectively. The dashed lines demonstrate the significance level (i.e., the threshold for regression trend) for p-value = 0.05. The significance threshold is defined to detect instances of significant negative trends in baseflows. The y-axis is the linear regression trend of the normalized baseflow, and the x-axis is the percentage of catchment covered by crops. In the US, the regression trend of the baseflow is highly correlated with CL% (Spearman ρ = −0.45), with 7.1% of catchments showing significantly negative trends. In GB, however, the linear regression trend in the baseflow is barely correlated with CL% (Spearman ρ = −0.16), with only 2.3% of catchments showing significantly negative trends. To account for the sensitivity of the results to the cropland percentage, we repeat the analysis for the catchments with a 5% cropland percentage—See Supplementary Fig. 11.
Fig. 6
Fig. 6. Overview of the PCMCI+ causal discovery graph algorithm.
Overview of the PCMCI+ causal discovery graph algorithm. The variables xk (k=1,,4) are depicted by nodes and causal interactions are indicated by directed edges. It includes two main steps (PC algorithm) and MCI tests. PC1 starts with a fully connected graph as shown in (a). It then tests for the elimination of links between variables iteratively by conditioning sets of increasing cardinalities as shown in (b). MCI tests use the estimated conditions found in step one to infer a causal link—See (c). The node colors indicate the level of auto-dependency (auto-MCI) of each component and link colors indicate the interdependency strength (cross-MCI) between variables.
Fig. 7
Fig. 7. Comparison of PCMCI+ performance with correlation analysis.
Overview of PCMCI+ performance compared to correlation analysis. Artificial datasets are generated with a prescribed interaction structure (Eqs. 3–6). a shows all possible links between the four variables. Here for the four generated time series, we compared the results of lagged correlation analysis and PCMCI+. b presents the matrix of correlation coefficients. c, d display the results of PCMCI+ analysis, with (c) showing the causal graph and (d) illustrating the maximum path coefficients (MCI values). Only causal links at a significance level of p-value = 0.05 are shown in shades of blue and red.

References

    1. Renner, M., Seppelt, R. & Bernhofer, C. Evaluation of water-energy balance frameworks to predict the sensitivity of streamflow to climate change. Hydrol. Earth Syst. Sci.16, 1419–1433 (2012).
    1. Daly, E., Calabrese, S., Yin, J. & Porporato, A. Hydrological spaces of long-term catchment water balance. Water Resour. Res.55, 10747–10764 (2019).
    1. Yang, H., Yang, D., Lei, Z. & Sun, F. New analytical derivation of the mean annual water-energy balance equation. Water Resour. Res.44, 3 (2008).
    1. Chapin, F. S., Matson, P. A. & Vitousek, P. M. Water and energy balance. In Principles of Terrestrial Ecosystem Ecology (eds Chapin, F. S., Matson, P. A. & Vitousek, P. M.) 93–122 (Springer, New York, NY, 2011).
    1. Padrón, R. S., Gudmundsson, L., Greve, P. & Seneviratne, S. I. Large-scale controls of the surface water balance over land: insights from a systematic review and meta-analysis. Water Resour. Res.53, 9659–9678 (2017).

LinkOut - more resources