. 2024 Nov 22;13(3):1345-1358.
doi: 10.1039/d4tc03615h. eCollection 2025 Jan 16.

Investigation of the atomic layer etching mechanism for Al2O3 using hexafluoroacetylacetone and H2 plasma

Affiliations

Investigation of the atomic layer etching mechanism for Al2O3 using hexafluoroacetylacetone and H2 plasma

Nicholas J Chittock et al. J Mater Chem C Mater. .

Abstract

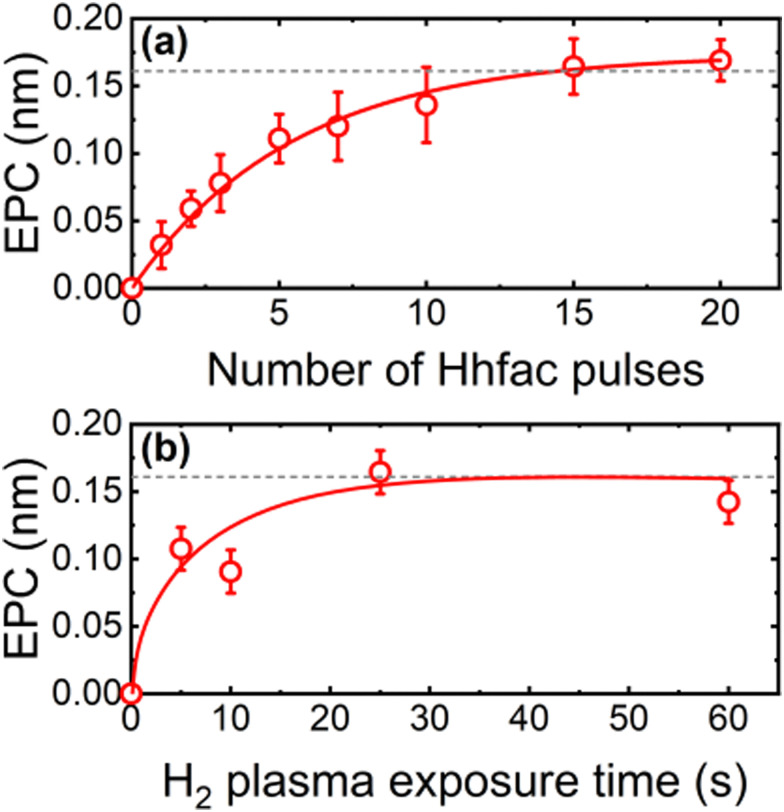
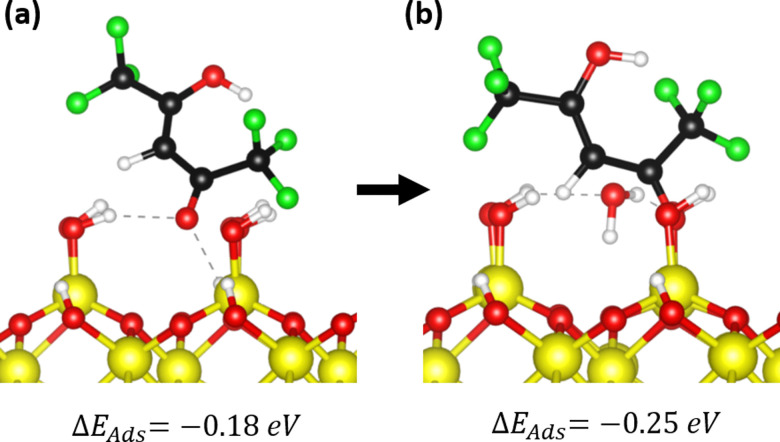
Atomic layer etching (ALE) is required to fabricate the complex 3D structures for future integrated circuit scaling. To enable ALE for a wide range of materials, it is important to discover new processes and subsequently understand the underlying mechanisms. This work focuses on an isotropic plasma ALE process based on hexafluoroacetylacetone (Hhfac) doses followed by H2 plasma exposure. The ALE process enables accurate control of Al2O3 film thickness with an etch rate of 0.16 ± 0.02 nm per cycle, and an ALE synergy of 98%. The ALE mechanism is investigated using Fourier transform infrared spectroscopy (FTIR) and density functional theory (DFT) simulations. Different diketone surface bonding configurations are identified on the Al2O3 surface, suggesting that there is competition between etching and surface inhibition reactions. During the Hhfac dosing, the surface is etched before becoming saturated with monodentate and other hfac species, which forms an etch inhibition layer. H2 plasma is subsequently employed to remove the hfac species, cleaning the surface for the next half-cycle. On planar samples no residue of the Hhfac etchant is observed by FTIR after H2 plasma exposure. DFT analysis indicates that the chelate configuration of the diketone molecule is the most favorable surface species, which is expected to leave the surface as volatile etch product. However, formation of the other configurations is also energetically favorable, which explains the buildup on an etch inhibiting layer. The ALE process is thus hypothesized to work via an etch inhibition and surface cleaning mechanism. It is discussed that such a mechanism enables thickness control on the sub-nm scale, with minimal contamination and low damage.


Conflict of interest statement

There are no conflicts to declare.

Figures

Fig. 1
Fig. 1. (a) General schematic of an ALE cycle relying on surface modification and ligand exchange, which often leads to a very thin residual contaminated layer at the surface. (b) Etch inhibition and surface clean mechanism, where the etching process self-limits due to formation of an etch inhibition layer. The inhibition layer can then be cleaned away to enable etching in the next cycle.
Fig. 2
Fig. 2. (a) The general structure of a diketone molecule, where R1 and R2 can be the same or different terminal groups. The molecule is a keto–enol tautomer; in gas phase enol is the more stable configuration for many diketones. (b) Structure of the hexafluoroacetylacetone (Hhfac) molecule used in this work. Hhfac exists nearly exclusively in the enol form, as shown in the figure.
Fig. 3
Fig. 3. Schematic representations of the reactors used in this work: (a) an Oxford Instruments FlexAL reactor and (b) a home-built ALD reactor equipped with an in situ FTIR setup, shown here in transmission mode for powder samples. The angle of the IR mirrors on the detector and source side can be adjusted such that planar samples can be studied in reflection mode. Both systems are pumped with turbo pumps and use an inductively coupled plasma source supplied with 13.56 MHz RF power.
Fig. 4
Fig. 4. Schematic of the ALE process used in this work. Half-cycle A consists of Hhfac dose/hold steps, which are repeated 15 times per cycle (unless stated otherwise). Half-cycle B is the H2 plasma at a pressure of 300 mTorr and 600 W power. Each half-cycle is followed by a 10 s Ar purge with the APC fully open for maximum pumping efficiency.
Fig. 5
Fig. 5. Saturation curves at 350 °C for (a) Hhfac pulses using a 25 s H2 plasma and (b) H2 plasma exposure using 15 × 50 ms pulses of Hhfac per cycle. The lines are guides to the eye.
Fig. 6
Fig. 6. Thickness evolution as a function of pulses/cycles for (a) only Hhfac dosing, (b) only H2 plasma exposure and (c) ALD cycles with Hhfac and H2 plasma pulses. Experiments were performed at 350 °C table temperature.
Fig. 7
Fig. 7. (a) Etched thickness as a function of ALE cycles using 15 pulses of Hhfac dose/hold and 25 s H2 plasma each cycle. Experiments were performed at 300 °C table temperature, yielding an EPC of 0.08 ± 0.01 nm per cycle. (b) Reflection mode absorbance spectra for Al2O3 and SiO2 planar films exposed to a 100 ms Hhfac dose, referenced to their as-deposited surfaces. The Al–O and hfac absorbance regions are highlighted in the figure.
Fig. 8
Fig. 8. (a) Schematic of the performed experiment to determine whether there is any build-up of Hhfac residue on the Al2O3 surface post ALE. FTIR spectra are referenced to the spectrum for the as-deposited Al2O3 planar film. (b) Spectra taking in reflection mode after full ALE cycles. A cyclic decrease in absorbance for the Al–O bond region is observed. For the rest, the spectrum shows minimal change over the 5 ALE cycles.
Fig. 9
Fig. 9. FTIR difference spectrum for adsorption of Hhfac on the Al2O3-coated powder. (a) Illustration of the performed experiment. The arrows indicate the reference spectrum for each measurement. (b) The spectra between 4000–900 cm−1 for different dosing times, listing the peaks discussed in the main text. (c) Schematic of the monodentate and chelate bonding configurations of hfac on the surface. (d), (e) Zoom in on the region 1900–1200 cm−1 from panel (a) for (d) the first 20 ms Hhfac pulse and (e) for increasing cumulative Hhfac dose times. In (d) and (e) the main monodentate and chelate peaks are highlighted in the figure.
Fig. 10
Fig. 10. (a) Representation of the procedure performed to analyze the integrated total area in the region 1900–1200 cm−1. The data is the same as Fig. 9, however all the FTIR spectra are reference to the starting surface, such that the total change in the surface can be measured. (b) Integrated absorbance area between 1900–1200 cm−1 (red, open circles), and the peak area ratio of monodentate (1656 cm−1) to chelate (1571 cm−1) hfac (blue, closed squares) as a function of Hhfac dose time.
Fig. 11
Fig. 11. (a) Schematic of the performed experiment investigating the effectiveness of H2 plasma at removing hfac ligands adsorbed on the Al2O3 surface. The surface is first functionalized by carrying out a 500 ms Hhfac exposure. The arrows indicate the reference spectrum that is used for each measurement. (b) Spectrum for Al2O3 exposed to 500 ms Hhfac dosing, which is shown such that a comparison to the removal spectra can easily be made. (c) The difference spectra for increasing H2 plasma exposure times referenced to the spectrum in (b).
Fig. 12
Fig. 12. Adsorption pathway for Hhfac on a hydroxylated Al2O3 surface. (a) Hhfac molecule initially physisorbs to the surface. (b) Donation of H from Hhfac to the surface, forming H2O on the surface. (c) The hfac ligand bound in monodentate configuration, with the H2O still bound to the surface. (d) Chelate configuration of the hfac ligand, with both O atoms bound to the same surface Al atom. Adsorption energies for each configuration are shown beneath the images. The arrows indicate potential transitions on the surface and the difference in energy between two configurations.
Fig. 13
Fig. 13. (a) Physisorption of a Hhfac molecule onto an OH-terminated Al2O3 surface where only one O atom is directed towards the surface. From configuration (a) the Hhfac can transition into (b) a monodentate bound configuration with an OH group directed away from the surface.
Fig. 14
Fig. 14. Proposed mechanism for ALE of metal oxides using diketone etch-inhibition and surface cleaning. (a) Adsorption of the Hhfac ligands onto the Al2O3 surface. Initial binding is in the chelate configuration, where both O atoms bind to the same surface atom, leading to the formation of volatile species. Over time, steric hinderance on the surface leads to the adsorption of more molecules in the monodentate and isolated chelate configurations, which eventually inhibit the etching. (b) The hfac species on the surface must then be cleaned away to reset the surface such that more etching can occur in the next ALE cycle. H2 plasma is used in this work to remove the surface inhibition layer.

References

    1. Kanarik K. J. Tan S. Gottscho R. A. J. Phys. Chem. Lett. 2018;9:4814–4821. doi: 10.1021/acs.jpclett.8b00997. - DOI - PubMed
    1. Kanarik K. J. Lill T. Hudson E. A. Sriraman S. Tan S. Marks J. Vahedi V. Gottscho R. A. J. Vac. Sci. Technol., A. 2015;33:020802. doi: 10.1116/1.4913379. - DOI
    1. Fischer A., Janek R., Boniface J., Lill T., Kanarik K. J., Pan Y., Vahedi V. and Gottscho R. A., in Advanced Etch Technology for Nanopatterning VI, ed. S. U. Engelmann and R. S. Wise, American Vacuum Society, 2017, vol. 10149, p. 101490H
    1. Carver C. T. Plombon J. J. Romero P. E. Suri S. Tronic T. A. Turkot R. B. ECS J. Solid State Sci. Technol. 2015;4:N5005–N5009. doi: 10.1149/2.0021506jss. - DOI
    1. Clark R. Tapily K. Yu K.-H. Hakamata T. Consiglio S. O’Meara D. Wajda C. Smith J. Leusink G. APL Mater. 2018;6:058203. doi: 10.1063/1.5026805. - DOI

LinkOut - more resources