. 2024 Dec 15;151(24):dev204294.
doi: 10.1242/dev.204294. Epub 2024 Dec 16.

A simple MiMIC-based approach for tagging endogenous genes to visualise live transcription in Drosophila

Affiliations

A simple MiMIC-based approach for tagging endogenous genes to visualise live transcription in Drosophila

Lauren Forbes Beadle et al. Development. .

Abstract

Live imaging of transcription in the Drosophila embryo using the MS2 or PP7 systems is transforming our understanding of transcriptional regulation. However, insertion of MS2/PP7 stem-loops into endogenous genes requires laborious CRISPR genome editing. Here, we exploit the previously described Minos-mediated integration cassette (MiMIC) transposon system in Drosophila to establish a method for simply and rapidly inserting MS2/PP7 cassettes into any of the thousands of genes carrying a MiMIC insertion. In addition to generating a variety of stem-loop donor fly stocks, we have made new stocks expressing the complementary coat proteins fused to different fluorescent proteins. We show the utility of this MiMIC-based approach by MS2/PP7 tagging of endogenous genes and the long non-coding RNA roX1, then imaging their transcription in living embryos. We also present live transcription data from larval brains, the wing disc and ovary, thereby extending the tissues that can be studied using the MS2/PP7 system. Overall, this first high-throughput method for tagging mRNAs in Drosophila will facilitate the study of transcription dynamics of thousands of endogenous genes in a range of Drosophila tissues.

Keywords: Drosophila; Live imaging; MS2-MCP system; MiMIC; PP7-PCP system; Transcription.


Conflict of interest statement

Competing interests The authors declare no competing or financial interests.

Figures

Fig. 1.
Fig. 1.
Overview of the MiMIC insertion strategy for MS2/PP7 sequences. (Ai) Schematic shows 24×MS2 loops (orange box) inserted into a gene intron. Following transcription, fluorescent coat proteins (grey crescents with green stars) bind to the stem-loops in the RNA. (Aii) Still from a live-imaging movie showing TSs, visualised as bright fluorescent foci of MCPGFP bound to the stem-loops, within the nuclei marked by HisRFP. Fluorescent intensity can be tracked over time as shown for the TS in one nucleus (inset). Scale bars: 10 µm. (B) A flowchart showing the three genetic components required for visualisation of live transcription in vivo: (1) the MiMIC insertion, (2) the stem-loop options and (3) the corresponding coat protein fly stocks generated or used in this study. Hsp83-nlsMCPeGFP is from Forrest and Gavis (2003). (C) Nucleotide sequences of the MS2 and PP7 loop versions used in this study. (D) Schematics of MCP or PCP bound to an MS2 or PP7 loop, respectively. In each case, a tandem dimer coat protein is fused to two fluorescent proteins (red stars). (E) Schematics of the plasmids injected into flies to create the loop donor fly stocks. (F) Scheme for insertion of the loop donor cassette into the MiMIC-containing locus. FLP/FRT-mediated removal of the cassette is followed by RMCE at the attB/attP sites within the donor and target site, mediated by germline expression of the ΦC31 integrase (top). This results in integration of the loops into the MiMIC site within the gene (bottom). Ai and Aii are adapted from Forbes Beadle et al. (2023).
Fig. 2.
Fig. 2.
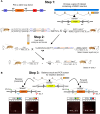
Step-by-step protocol for inserting loops into MiMIC-containing genes. (A) Crossing scheme to target a MiMIC-containing gene on the third chromosome (pxb) with 24×PP7 loops. The pxb gene contains an intronic MiMIC insertion (Mi04897). The Mi04897 insertion is in the opposite orientation to pxb and is marked by the yellow+ marker and flanked by inverted attP sites (grey triangles). The selection of markers as indicated will result in flies with loops inserted into the MiMIC. (B) PCR screening of 24×PP7 loops inserted into pxb at Mi04897. The opposite direction relative to the gene is shown by a band in PCR2 (green and blue primers) and PCR 4 (yellow and red primers) and the absence of a band in PCR1 (green and yellow primers) and PCR 3 (blue and red primers). The same direction relative to the gene is confirmed by a band in PCR1 and PCR 3 and the absence of a band in PCR2 and PCR 4. Samples a, b, d and e here are in the correct forward orientation. MIL-F (red primer) and MIL-R (green primer) are common to all MiMIC inserts and the internal yellow and blue primers are stem-loop specific. Fly cartoons were created in BioRender. Ashe, H. (2024) https://BioRender.com/o52d992.
Fig. 3.
Fig. 3.
Transcription live imaging of pxb tagged with MS2 and PP7 stem-loops in embryos. (Ai) Schematic showing the pxb gene locus with the 24×MS2V6 insertion. Males with the 24×MS2V6 loops inserted into pxb are crossed to females expressing HisRFP and nos-2×MCP2×mNeonGreen. Embryos have the pxb-24×MS2V6 TS visible as an intense mNeonGreen signal within the HisRFP nucleus; the imaging region is shown in yellow. (Aii) Top: still images from a time-lapse movie of pxb-24×MS2V6 TSs in two anterior stripes in the nc14 embryo. Scale bars: 20 µm. Bottom: higher magnification images from nuclei with the stripe. Nuclei are marked in magenta and pxb-MS2 TSs are in green. Scale bars: 5 µm. (Bi) As in Ai but with 24×PP7 loops inserted into pxb and females are expressing HiseBFP2 and nos-2×PCP2×mCherry. (Bii) Still from a movie of an embryo expressing HiseBFP2 and nos-2×PCP2×mCherry marking the nuclei in blue and the pxb-PP7 TSs in magenta. (Ci) Schematic showing pxb labelled to visualise each allele with a different loop type (MS2 or PP7). (Cii) Dual imaging of these embryos detects transcription of both alleles. pxb-PP7 TSs are in magenta, pxb-MS2 TSs are in green, nuclei are blue in the merge. See also Movies 1-3. Fly cartoons created in BioRender. Ashe, H. (2024) https://BioRender.com/u96a435.
Fig. 4.
Fig. 4.
Live imaging of Race and roX1 transcription. (A,B) 24×PP7 loops were inserted into the second chromosome gene Race at Mi05748 (A) and the X chromosome lncRNA roX1 at Mi01457 (B). (C) Stills from a live-imaging movie of an embryo with Race-24×PP7 and maternally expressed HiseBFP2 and nos-2×PCP2×mCherry under the control of the nos promoter, showing nascent TSs within the Race expression domain. (D) Top: heatmap of individual Race transcription site traces measured during nc14. Bottom: graph showing mean TS fluorescence intensity of Race in a nc14 embryo. (E,F) As in C,D, but the data are shown for roX1-24×PP7. Mean±CI for 72 nuclei (Race) and 115 nuclei (roX1). Scale bars: 20 µm.
Fig. 5.
Fig. 5.
Visualising nascent transcription in the ovary. (A) Schematic of the 128×MS2 loop array inserted into the Mi04922 insertion in the first intron of the Dad gene. (B) Schematic showing the female ovary and the follicle cells that surround the egg chambers and oocyte. (C) Still from a live-imaging movie of a stage 9 egg chamber from a ptc-Gal4/+; UASp-2×MCP2×eGFP, HiseBFP2/Dad-128×MS2 female, anterior is to the left. Dad-128×MS2 TSs are detected in the anterior follicle cells with a region of expressing cells marked by the white box. Scale bar: 20 µm. Inset: a higher magnification image of the follicle cells highlighting two cells (magenta and orange circles) with TSs (arrowheads). Scale bar: 5 µm. (D) Fluorescence intensity traces from the two cells highlighted in the inset. The colours denote the different cells in the inset in C.
Fig. 6.
Fig. 6.
Visualising nascent transcription in the larval brain. (A) Schematic showing the third instar larval brain and eye-antennal discs highlighting the regions of the optic lobe and ventral nerve cord that were imaged live. (B) Stills from live-imaging movies of cells from ptc-Gal4; UASp-2×MCP2×eGFP, HiseBFP2 and Dad-128×MS2 larval brains. A number of cells have active TSs (unfilled arrowheads), and examples of non-transcribing cells are also present (orange arrowheads). Scale bars: 10 µm. (C) Higher magnification of the outlined regions in B. Scale bars: 2 µm. (D) Transcription traces from the circled brain cells in C. (E) Still from a live-imaging movie of glial cells from Hsp83-MCPeGFP and Dad-128×MS2 larval brains. Scale bar: 20 µm. Higher magnification of two cells with a Dad-128×MS2 TS is shown in the inset to the right. Scale bars: 5 µm. (F) As in E but larval brains are from Hsp83-MCPeGFP/+ individuals with no MS2 loops in Dad.

References

    1. Apte, M. S., Moran, V. A., Menon, D. U., Rattner, B. P., Barry, K. H., Zunder, R. M., Kelley, R. and Meller, V. H. (2014). Generation of a useful roX1 allele by targeted gene conversion. G3 (Bethesda) 4, 155-162. 10.1534/g3.113.008508 - DOI - PMC - PubMed
    1. Arib, G., Cléard, F., Maeda, R. K. and Karch, F. (2015). Following the intracellular localization of the iab-8ncRNA of the bithorax complex using the MS2-MCP-GFP system. Mech. Dev. 138, 133-140. 10.1016/j.mod.2015.08.004 - DOI - PubMed
    1. Ashe, H. L. and Levine, M. (1999). Local inhibition and long-range enhancement of Dpp signal transduction by Sog. Nature 398, 427-431. 10.1038/18892 - DOI - PubMed
    1. Bellen, H. J., Levis, R. W., Liao, G., He, Y., Carlson, J. W., Tsang, G., Evans-Holm, M., Hiesinger, P. R., Schulze, K. L., Rubin, G. M.et al. (2004). The BDGP Gene Disruption Project: single transposon insertions associated with 40% of Drosophila genes. Genetics 167, 761-781. 10.1534/genetics.104.026427 - DOI - PMC - PubMed
    1. Bertrand, E., Chartrand, P., Schaefer, M., Shenoy, S. M., Singer, R. H. and Long, R. M. (1998). Localization of ASH1 mRNA particles in living yeast. Mol. Cell 2, 437-445. 10.1016/S1097-2765(00)80143-4 - DOI - PubMed

LinkOut - more resources