. 2025;42(1):22-38.
doi: 10.14573/altex.2408292. Epub 2024 Nov 22.

A systematic analysis of read-across adaptations in testing proposal evaluations by the European Chemicals Agency

Affiliations

A systematic analysis of read-across adaptations in testing proposal evaluations by the European Chemicals Agency

Hannah M Roe et al. ALTEX. 2025.

Abstract

An essential aspect of the EU’s Registration, Evaluation, Authorisation and Restriction of Chemicals (REACH) regulation is the European Chemicals Agency’s (ECHA) evaluation of testing proposals submitted by registrants to address data gaps. Registrants may propose adaptations, such as read-across, to waive standard testing; however, it is widely believed that ECHA often finds justifications for read-across hypotheses inadequate. From 2008 to August 2023, 2,630 testing proposals were submitted to ECHA; of these, 1,538 had published decisions that were systematically evaluated in this study. Each document was manually reviewed and information extracted for further analyses, focusing on 17 assessment elements (AEs) from the Read-Across Assessment Framework (RAAF) and testing proposal evaluations (TPE). Each submission was classified as to the AEs relied upon by the registrants and by ECHA. Data was analyzed for patterns and associations. Adaptations were included in 23% (350) of proposals, with analogue (168) and group (136) read-across being most common. Of the 304 read-across hypotheses, 49% were accepted, with group read-across showing significantly higher odds of acceptance. Data analysis examined factors such as tonnage band (Annex), test guidelines, hypothesis AEs, and structural similarities of target and source sub­stances. While decisions were often context-specific, several significant associations influencing acceptance emerged. Overall, this analysis provides a comprehensive overview of 15 years of experience with testing proposal-specific read-across adaptations by both registrants and ECHA. These data will inform future submissions as they identify most critical AEs to increase the odds of read-across acceptance.

Keywords: ECHA; OECD test guideline studies; REACH; adaptations; read-across.

Plain language summary

The European Union’s law requires companies to provide safety data on chemicals they produce or import. To avoid unnecessary testing in animals, companies can propose alternatives like “read-across”, which uses data from similar substances. However, the European Chemicals Agency often rejects these proposals if the reasoning is not convincing. 1,538 decisions on testing proposals submitted between 2008 and 2023 were reviewed for this study. We analyzed the factors that influ­enced the agency’s decisions, focusing on 17 criteria. About 23% of proposals included read-across adaptations, with nearly half of these (49%) found acceptable. Group read-across proposals were more likely to succeed than analogue approaches. The study identified patterns and key factors, such as the similarity between substances and the type of tests proposed, that affected approval rates. This research offers valuable insights to help companies improve their proposals and increase the chances of approval for alternatives to animal testing.


Conflict of interest statement

Conflict of interest

N. Ball is an employee of the Dow Chemical Company, which submitted several registrations and testing proposals for evaluation by ECHA. Other authors declare no conflicts of interest.

Figures

Fig. 1:
Fig. 1:. A simplified illustration of a workflow of substance registration under REACH
The two sides of the diagram represent the difference between “complete” dossiers that contain all information as required for a substance based on its annual tonnage (left side) and cases where gap analysis by the registrant identified missing information that results in the submission of a testing proposal to ECHA (right side). The compliance checks (CCH) and testing proposal evaluations (TPE) result in separate decisions by ECHA; in this study, only published TPE decisions were reviewed.
Fig. 2:
Fig. 2:. A diagram illustrating categorization of the publicly available TPE (testing proposal evaluation) documents with and without adaptations, as well as the acceptance and rejection rates of testing proposals with read-across (RA) adaptations
Numbers indicate the number of submissions with a published TPE as substances may have multiple submitted testing proposals throughout the registration period. Asterisks (*) indicate categories where individual testing proposal submissions may have contained several read-across hypotheses.
Fig. 3:
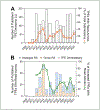
Fig. 3:. Time-trend plots for when TPE decisions were published
(A) The number of all published TPE decisions per calendar year (bars, left y-axis) and the fraction of TPEs that contained read-across (RA) adaptations (line, right y-axis). (B) The number of published TPE decisions per calendar year indicating the type of read-across (stacked bar plots, left y-axis) and the fraction of these that was accepted (line, right y-axis).
Fig. 4:
Fig. 4:. Analysis of publicly available TPE decisions by substance type
(A) Stacked bar plots show the number of substances for which read-across adaptations were accepted or rejected, separated into substance categories. The total number of substances in each category is shown. Within each stacked bar plot, submissions that used analogue (lighter shade) or group (darker shade) read-across are shown. In some instances of rejected read-across, the type of read-across could not be determined (white). (B) For each target substance type, different types of source substances were used as indicated. The outcome of the read-across evaluation is shown by the adjacent bars.
Fig. 5:
Fig. 5:. Analysis of publicly available TPE decisions by REACH Annex (tonnage band)
(A) Stacked bar plots show the number of substances in each Annex for which publicly available TPEs were examined. Gray color represents TPEs without read-across adaptations, and orange represents those with read-across adaptations. (B,C) The number of substances with accepted (B) and rejected (C) read-across adaptations. Within each stacked bar plot, submissions that used analogue (lighter shade) or group (darker shade) read-across are shown. In some instances of rejected read-across, the type of read-across could not be determined (white). (D) For each Annex number, odds ratios (OR) and 95% confidence intervals for acceptance in group vs analogue (i.e., an OR > 1.0 corresponds to greater odds of acceptance for group). The intervals for Annex IX and VIII do not contain the null OR = 1.0, corresponding to significantly greater odds of acceptance for group (p < 0.05).
Fig. 6:
Fig. 6:. Analysis of publicly available TPE decisions by OECD TG study
(A,B) Stacked bar plots show the number of substances (i.e., testing proposals) for each TG, separated into “human health” (A), and other (B) OECD test categories. Gray color represents TPEs without read-across adaptations, and orange represents those with read-across adaptations. (C,D) The number of substances with accepted (C) and rejected (D) read-across adaptations. Within each stacked bar plot, submissions that used analogue (lighter shade) or group (darker shade) read-across are shown. In some instances of rejected read-across, the type of read-across could not be determined (white). (E) For the overall data and when split by OECD guideline type, odds ratios (OR) and 95% confidence intervals for acceptance in group vs analogue (i.e., an OR > 1.0 corresponds to greater odds of acceptance for group). The intervals for overall, TG 414 and TG 408 do not contain the null OR = 1.0, corresponding to significantly greater odds of acceptance for group (p < 0.05).
Fig. 7:
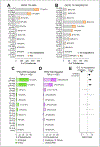
Fig. 7:. Analysis of publicly available TPE decisions by assessment elements (AEs)
(A,B) Stacked bar plots show the number of substances overall and for each AE, separated into TPEs that were accepted (A) and rejected (B). For AE 15 (marked with *), the fraction shown is for UVCB substances only. (C) For the overall data and for each AE, odds ratios (OR) and 95% confidence intervals for acceptance for group vs analogue (i.e. an OR > 1.0 corresponds to greater odds of acceptance for group). The intervals for overall, AE 1, AE 8, and AE 15 do not contain the null OR = 1.0, corresponding to significantly greater odds of acceptance for group (p < 0.05). (D) ORs from multiple logistic regression analyses with predictors submission year, decision year, group vs. analogue-based RA, and all AEs. For each column (all TPEs, mono-constituent, and UVCB), the ORs are displayed on a color scale, where red indicates predictor increases the chance of acceptance, blue indicates predictor decreases the chance of acceptance, and * denotes coefficients that have false discovery rates of q < 0.05.
Fig. 8:
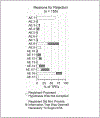
Fig. 8:. Reasons that were stated by ECHA for the rejection of a testing proposal with read-across
The light bar represents when a registrant proposed an AE that ECHA disagreed with and/or interpreted differently. The dark bar represents the registrant failing to take an AE into account in the read-across hypothesis.
Fig. 9:
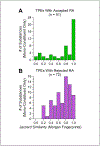
Fig. 9:. Source-to-target Jaccard similarity values for read-across proposals
(A) Accepted and (B) rejected testing proposals. Mean similarity values were not significantly different. However, a rigorous cutpoint analysis revealed that testing proposals with read-across for source and target substances with very high similarity (> 0.9) were significantly more likely to be accepted (p = 0.0003, OR = 7.0).

Update of

Similar articles

References

    1. Ball N, Cronin MT, Shen J et al. (2016). Toward good read-across practice (GRAP) guidance. ALTEX 33, 149–166. doi:10.14573/altex.1601251 - DOI - PMC - PubMed
    1. Beal MA, Gagne M, Kulkarni SA et al. (2022). Implementing in vitro bioactivity data to modernize priority setting of chemical inventories. ALTEX 39, 123–139. doi:10.14573/altex.2106171 - DOI - PMC - PubMed
    1. Berggren E, Amcoff P, Benigni R et al. (2015). Chemical safety assessment using read-across: Assessing the use of novel testing methods to strengthen the evidence base for decision making. Environ Health Perspect 123, 1232–1240. doi:10.1289/ehp.1409342 - DOI - PMC - PubMed
    1. Blackburn K and Stuard SB (2014). A framework to facilitate consistent characterization of read across uncertainty. Regul Toxicol Pharmacol 68, 353–362. doi:10.1016/j.yrtph.2014.01.004 - DOI - PubMed
    1. Botham P, Cronin MTD, Currie R et al. (2023). Analysis of health concerns not addressed by REACH for low tonnage chemicals and opportunities for new approach methodology. Arch Toxicol 97, 3075–3083. doi:10.1007/s00204-023-03601-5 - DOI - PMC - PubMed

Substances

LinkOut - more resources