. 2024 Jan-Dec;16(1):2431167.
doi: 10.1080/19490976.2024.2431167. Epub 2024 Nov 25.

Transcriptional profiling of zebrafish intestines identifies macrophages as host cells for human norovirus infection

Affiliations

Transcriptional profiling of zebrafish intestines identifies macrophages as host cells for human norovirus infection

Emma Roux et al. Gut Microbes. 2024 Jan-Dec.

Abstract

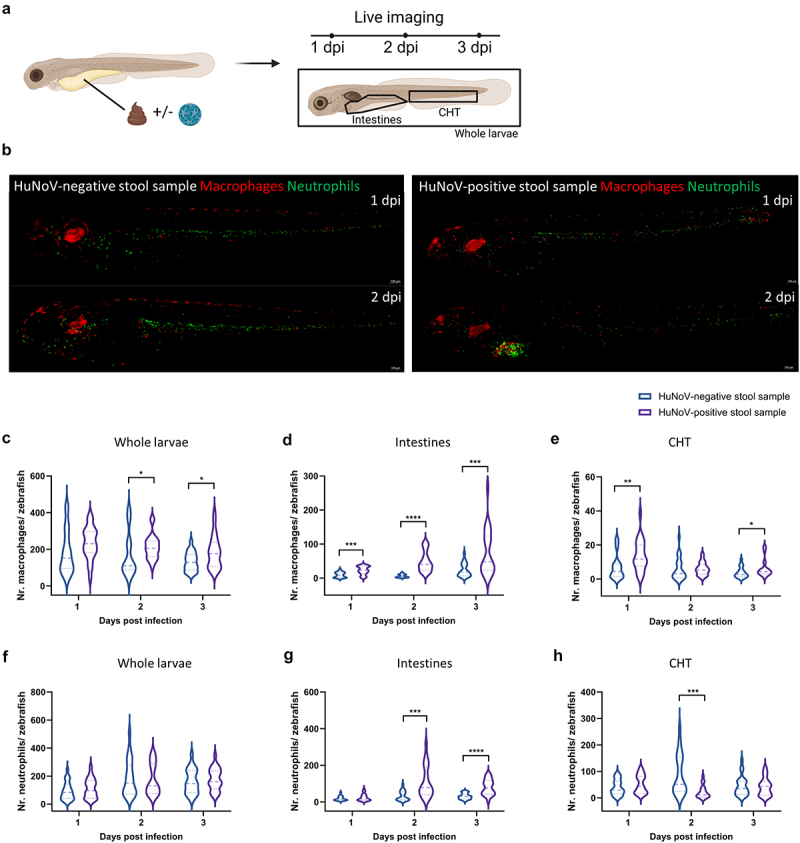
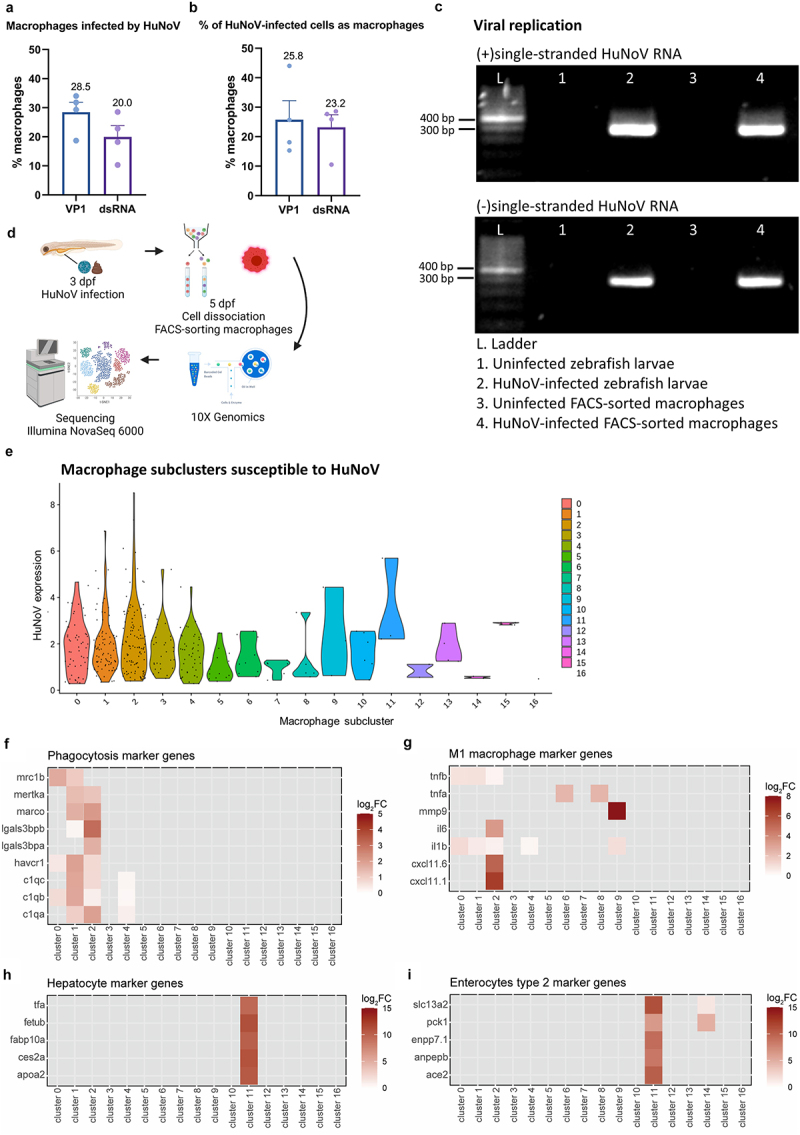
Human noroviruses (HuNoVs) are a major cause of diarrheal disease, yet critical aspects of their biology, including cellular tropism, remain unclear. Although research has traditionally focused on the intestinal epithelium, the hypothesis that HuNoV infects macrophages has been recurrently discussed and is investigated here using a zebrafish larval model. Through single-cell RNA sequencing of dissected zebrafish intestines, we unbiasedly identified macrophages as host cells for HuNoV replication, with all three open reading frames mapped to individual macrophages. Notably, HuNoV preferentially infects actively phagocytosing inflammatory macrophages. HuNoV capsid proteins and double-stranded RNA colocalized within intestinal macrophages of infected zebrafish larvae, and the negative-strand RNA intermediate was detected within FACS-sorted macrophages. Flow cytometry confirmed viral replication within these macrophages, constituting approximately 23% of HuNoV's host cells. Identifying macrophages as host cells prompts a reevaluation of their role in HuNoV pathogenesis, offering new directions for understanding and controlling this infection.

Keywords: Human norovirus; cellular tropism; host cell identification; host-virus interaction; intestinal epithelium; macrophages; zebrafish larval model.


Conflict of interest statement

No potential conflict of interest was reported by the author(s).

Figures

Figure 1.
Figure 1.
Upon HuNoV infection macrophages expand and are attracted to the intestines. (a) A schematic overview illustrating the experimental setup where zebrafish larvae were injected with either a HuNoV-negative or -positive stool sample, followed by live imaging at 1, 2, and 3 dpi. (b) Representative fluorescent images (10X magnification) of zebrafish larvae from the transgenic line Tg(fms:Gal4/UAS:nfsB:mCherry/mpx:GFP) injected with HuNoV-negative or -positive stool samples. The images show the recruitment of macrophages (red) and neutrophils (green) to the intestinal region where HuNoV infection occurs. Images were deconvoluted using leica LAS X imaging software. (c-e) quantification of macrophages in (c) whole larvae, (d) intestines, and (e) the caudal hematopoietic tissue (CHT) using ImageJ, in zebrafish injected with either a HuNoV-negative or positive stool sample. (f-h) quantification of neutrophils in (f) whole larvae, (g) intestines, and (h) the CHT using ImageJ, in zebrafish injected with either a HuNoVnegative or -positive stool sample. For panels (c-h), data from 22-24 larvae per condition are shown as violin plots with medians, with outliers removed (ROUT, Q = 1%). Statistical analysis was performed using the Mann-Whitney test, with significant differences marked by asterisks: *p < 0.05, **p < 0.01, ***p < 0.001, ****p < 0.0001. In (c), macrophage numbers increased by 1.26-fold (p = 0.0135) at 2 dpi and 1.38-fold (p = 0.0431) at 3 dpi. In (d), macrophages increased by 2.36-fold (p = 0.003) at 1 dpi, 7.65-fold (p < 0.0001) at 2 dpi, and 3.29-fold (p = 0.0005) at 3 dpi. In (r), macrophage numbers in the CHT increased by 2.00-fold (p = 0.0038) at 1 dpi and 1.69-fold (p = 0.044) at 3 dpi. In (g), neutrophil numbers in the intestines increased by 3.21-fold (p = 0.0002) at 2 dpi and 2.60-fold (p < 0.0001) at 3 dpi, while (h) shows a 3.91 fold decrease (p = 0.0002) in neutrophils in the CHT at 2 dpi. HuNoV = human norovirus, dpi = days post-infection, CHT = caudal hematopoietic tissue.
Figure 2.
Figure 2.
A scRNA-seq analysis on dissected zebrafish larval intestines shows an increase in leukocytes and an important role in the antiviral immune response. (a) Experimental design for transcriptional profiling of single cells in the zebrafish intestine. (b) Aggregated data of all intestinal cells (N = 22,958 cells (11,631 from uninfected and 11,327 from HuNoV-infected zebrafish larvae)) are represented by UMAP clustering and colored according to the unique cell cluster based on their transcriptional profile. (c) Differences in the proportions of cells between the uninfected and HuNoV-infected conditions are further displayed in detail in bar charts. (d) Volcano plots showing DEGs for the comparison of HuNoV-infected versus uninfected zebrafish larval leukocytes within the intestines. A vertical dotted line marks a log2(fold change) value of zero, while the horizontal dotted line marks a BenjaminiHochberg q-value of 0.05. Genes involved in relevant pathways involved in the innate immune response of antiviral signaling are displayed. (e) Dot plot showing the results of a ClueGO hypergeometric enrichment pathway analysis of upregulated DEGs using the gene ontology - biological process database. HuNoV = human norovirus, DEGs = differentially expressed genes.
Figure 3.
Figure 3.
ScRNA-seq identifies enterocytes, hepatocytes, and leukocytes as host cells for HuNoV infection in the zebrafish intestines. (a) Cell clusters susceptible to HuNoV infection are highlighted and included leukocytes marked with a black box. (b) The relative expression levels of HuNoV’s ORF 1, 2, and 3 (respectively encoding for the non-structural polyprotein, VP1, and VP2) in different cell clusters are shown in detail and highlight a tropism particular for leukocytes. The average expression of each norovirus read per cell type was determined followed by a normalization across all cell types. (c) Within leukocytes, a 2D t-SNE projection of the leukocyte cell cluster shows the relative expression of HuNoV. Within leukocytes, the expression of marco, i.e., a marker for macrophages and mpx, i.e., a marker for neutrophils is shown in both uninfected and HuNoV-infected conditions. The expression of HuNoV and the macrophage marker marco show an overlap corresponding to a Pearson correlation coefficient of 0.51. In contrast, no overlap is seen between the expression of mpx, a marker for neutrophils corresponding to a low Pearson correlation coefficient of − 0.17. HuNoV = human norovirus, ORF = open reading frame, VP1 = viral protein 1, major capsid protein, VP2 = viral protein 2, minor capsid protein, dsRNA = double-stranded RNA.
Figure 4.
Figure 4.
Macrophages in the intestines are infected by HuNoV and allow active viral replication. (a-b) whole mount immunohistochemistry confocal images of Tg(mpeg:mCherry-F) zebrafish larvae infected with HuNoV taken at 2 dpi at a 25X magnification focusing on the intestines using Hoechst, a primary mCherry antibody, and (a) a VP1-targeting antibody or (b) a dsRNA-targeting antibody. Cross-section views created in imaris software show horizontal and vertical sections of macrophages that contain (a) VP1 or (b) dsRNA with the white circle highlighting an infected cell of interest. Imaris 3D Colocalization software calculated the overlap of voxels between macrophages and (a) VP1 or (b) dsRNA (N = 10-19) together with a thresholded Pearson coefficient, mean values ± SEM are shown. HuNoV = human norovirus, dpi = days post infection, VP1 = viral protein 1, major capsid protein, dsRNA = double-stranded RNA, SEM = standard error of means.
Figure 5.
Figure 5.
The in vivo tropism for macrophages is further confirmed by combined results of flow cytometry, RT-PCR on FACS-sorted macrophages, and a scRNA-seq analysis on dissected zebrafish larval intestines. Flow cytometry analysis on 2 dpi Tg(mpeg:mCherry-F) zebrafish larvae infected with HuNoV shows (a) the percentage of macrophages that contain HuNoV (either VP1 or dsRNA) and (b) the percentage of overall infected cells (VP1 or dsRNA) that are identified as macrophages. N = 4. Mean values ± SEM are shown. (c) Detection of (+)ss and (-)ss HuNoV RNA in both whole zebrafish larvae and FACS-sorted macrophages from HuNoV-infected Tg(mpeg:mCherry-F) zebrafish larvae. Strand-specific RT-PCR shows that (-)ss HuNoV RNA was detected intracellularly in macrophages at 2 dpi. (d) Experimental design for transcriptional profiling of FACS-sorted macrophages. (e) Violin plots show the normalized HuNoV expression per cell per macrophage subcluster. Heatmaps show the expression of genes linked to (f) phagocytosis, (g) M1 inflammatory macrophages, (h) hepatocytes, and (i) enterocytes type 2 across the macrophage subclusters. HuNoV = human norovirus, VP1 = viral protein 1, major capsid protein, dsRNA = double-stranded RNA, ss = single-stranded.
Figure 6.
Figure 6.
Single-cell analysis reveals inhibition of cytoplasmic translation and enhanced phagocytosis in HuNoV-infected macrophages. (a) A volcano plot shows the DEGs in HuNoV-infected vs. uninfected bystander macrophages within the HuNoV-infected zebrafish host. A vertical dotted line marks a log2(fold change) value of 0.5, while the horizontal dotted line marks a benjamini-Hochberg q-value of 0.05. Dot plot showing the pathways obtained via a ClueGO hypergeometric enrichment pathway analysis of (b) downregulated and (c) upregulated DEGs using the gene ontology - biological process database. HuNoV = human norovirus, DEGs = differentially expressed genes.
Figure 7.
Figure 7.
Macrophages are not crucial for either viral replication or viral clearance. (a) Graphical presentation of MTZ treatment schedule before and after infection. (b, d) bars represent the number of macrophages per zebrafish larva of Tg(mpeg1:Gal4/UAS:nfsB-mCherry) quantified using ImageJ software when larvae are treated with DMSO or MTZ to induce chemical ablation of macrophages. N = 18-29 zebrafish larvae per group. (c, e) bars represent HuNoV viral RNA copies per zebrafish larva quantified using RT-qPCR. N = 3-5 independent experiments with 10 zebrafish larvae per group. (b-e) mean values ± SEM are shown. The dotted line shows the LOQ. (f) Bars represent HuNoV viral RNA copies per WT or irf8−/− zebrafish larva using RT-qPCR. N = 4 independent experiments with 10 zebrafish larvae per group, mean values ± SEM are shown. The dotted line shows the LOQ. For all graphs: outliers were removed (ROUT, Q = 1%). Statistical analysis was performed using the Mann-Whitney test. Significantly different values are indicated by asterisks; *p < 0.05, ***p < 0.001, ****p < 0.0001. (b) Before HuNoV infection, MTZ treatment reduced macrophage numbers by 67% (p < 0.0001) at 0 dpi, by 72% (p < 0.0001) at 1 dpi, by 52% (p = 0.0003) at 2 dpi, and by 25% (p = 0.0449) at 3 dpi. (d) After HuNoV infection, MTZ treatment reduced macrophage numbers by 70% (p < 0.0001) at 2 dpi, by 82% (p < 0.0001) at 3 dpi, and by 67% (p < 0.0001) at 4 dpi. MTZ = metronidazole, DMSO = dimethylsulfoxide, HuNoV = human norovirus, hpf = hours post fertilization, dpi = days post infection, WT = wildtype, KO = knockout, SEM = standard error of means, LOQ = limit of quantification.

References

    1. Liu L, Johnson HL, Cousens S, Perin J, Scott S, Lawn JE, Rudan I, Campbell H, Cibulskis R, Li M, et al. Global, regional, and national causes of child mortality: an updated systematic analysis for 2010 with time trends since 2000. Lancet. 2012;379(9832):2151–25. doi:10.1016/s0140-6736(12)60560-1. - DOI - PubMed
    1. Bok K, Green KY.. Norovirus gastroenteritis in immunocompromised patients. N Engl J Med. 2012;367(22):2126–2132. doi:10.1056/NEJMra1207742. - DOI - PMC - PubMed
    1. Ludwig A, Adams O, Laws HJ, Schroten H, Tenenbaum T. Quantitative detection of norovirus excretion in pediatric patients with cancer and prolonged gastroenteritis and shedding of norovirus. J Med Virol. 2008;80(8):1461–1467. doi:10.1002/jmv.21217. - DOI - PubMed
    1. Ettayebi K, Crawford SE, Murakami K, Broughman JR, Karandikar U, Tenge VR, Neill FH, Blutt SE, Zeng XL, Qu L, et al. Replication of human noroviruses in stem cell–derived human enteroids. Science. 2016;353(6306):1387–1393. doi:10.1126/science.aaf5211. - DOI - PMC - PubMed
    1. Van Dycke J, Ny A, Conceicao-Neto N, Maes J, Hosmillo M, Cuvry A, Goodfellow I, Nogueira TC, Verbeken E, Matthijnssens J, et al. A robust human norovirus replication model in zebrafish larvae. PLOS Pathog. 2019;15(9):e1008009. doi:10.1371/journal.ppat.1008009. - DOI - PMC - PubMed

LinkOut - more resources