. 2025 Jan 3;136(1):59-74.
doi: 10.1161/CIRCRESAHA.124.325218. Epub 2024 Nov 25.

Loss of the Endothelial Glycocalyx Component EMCN Leads to Glomerular Impairment

Affiliations

Loss of the Endothelial Glycocalyx Component EMCN Leads to Glomerular Impairment

Zhengping Hu et al. Circ Res. .

Abstract

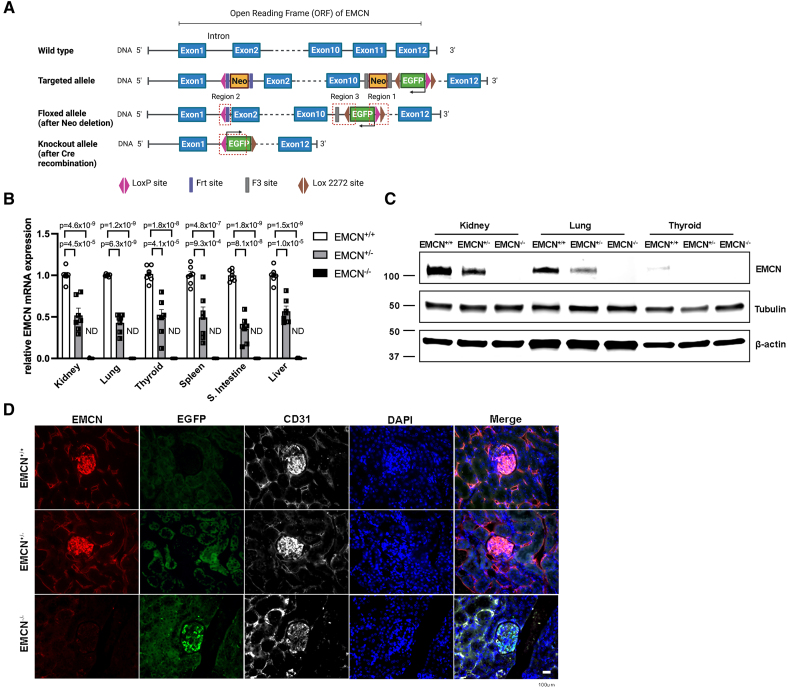
Background: EMCN (endomucin), an endothelial-specific glycocalyx component, was found to be highly expressed by the endothelium of the renal glomerulus. We reported an anti-inflammatory role of EMCN and its involvement in the regulation of VEGF (vascular endothelial growth factor) activity through modulating VEGFR2 (VEGF receptor 2) endocytosis. The goal of this study is to investigate the phenotypic and functional effects of EMCN deficiency using the first global EMCN knockout mouse model.

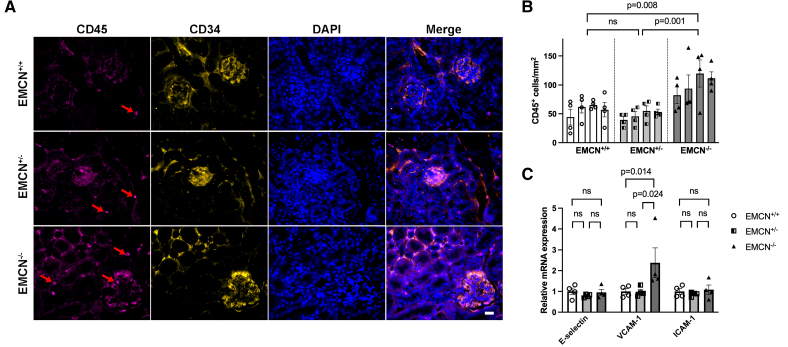
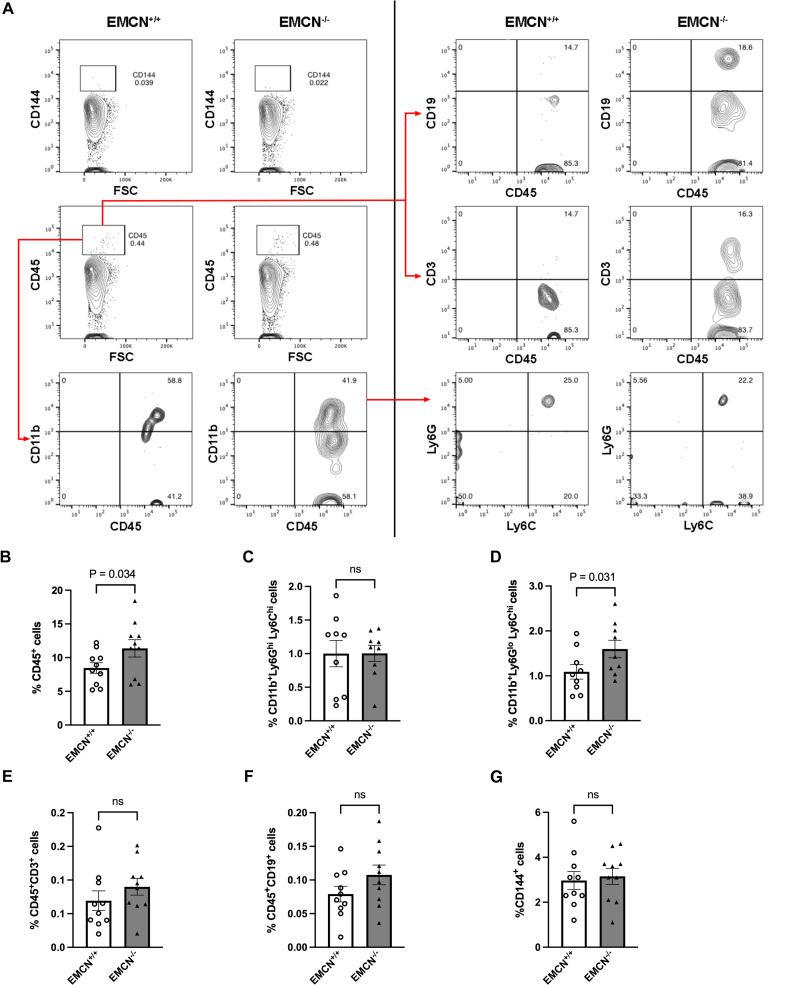
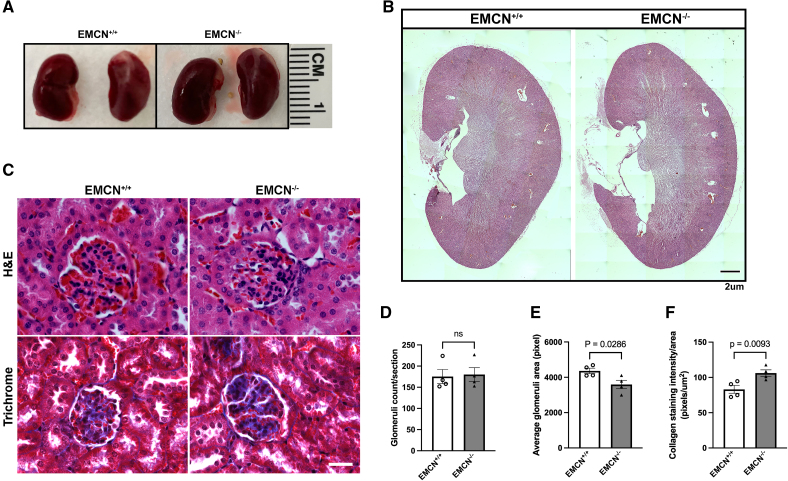
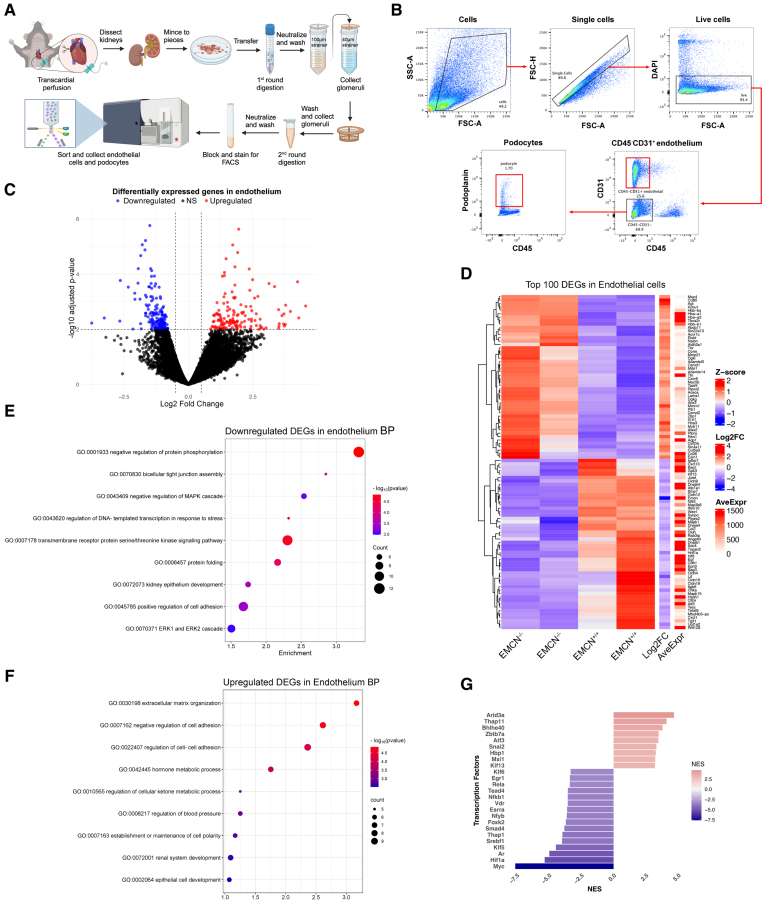
Methods: Global EMCN knockout mice were generated by crossing EMCN-floxed mice with ROSA26-Cre mice. Flow cytometry was used to analyze infiltrating myeloid cells in the kidneys. The ultrastructure of the glomerular filtration barrier was examined by transmission electron microscopy, whereas urinary albumin, creatinine, and total protein levels were analyzed from freshly collected urine samples. Expression and localization of EMCN, EGFP (enhanced green fluorescent protein), CD45 (cluster of differentiation 45), CD31, CD34, podocin, and albumin were examined by immunohistochemistry. Mice were weighed regularly, and their systemic blood pressure was measured using a noninvasive tail-cuff system. Glomerular endothelial cells and podocytes were isolated by fluorescence-activated cell sorting for RNA sequencing. Transcriptional profiles were analyzed to identify differentially expressed genes in both endothelium and podocytes, followed by gene ontology analysis. Protein levels of EMCN, albumin, and podocin were quantified by Western blot.

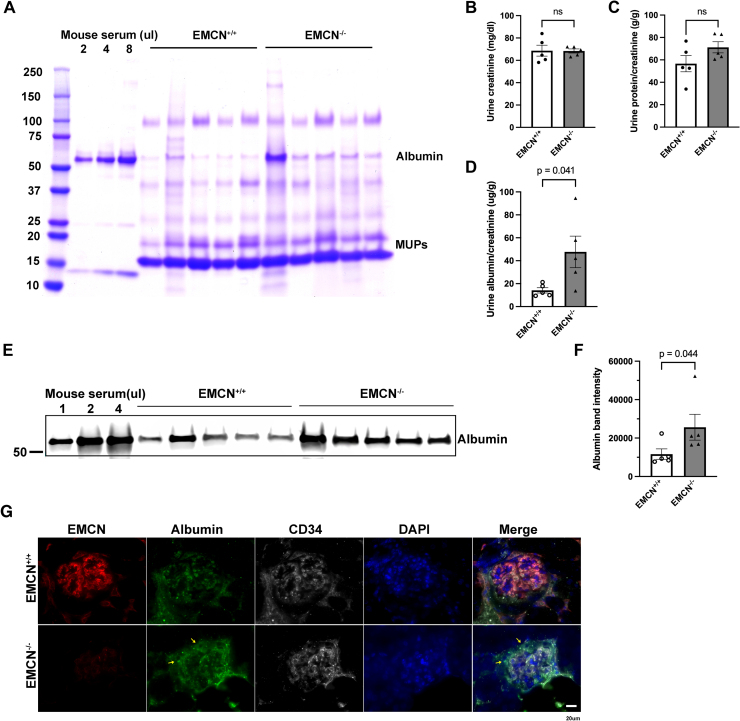
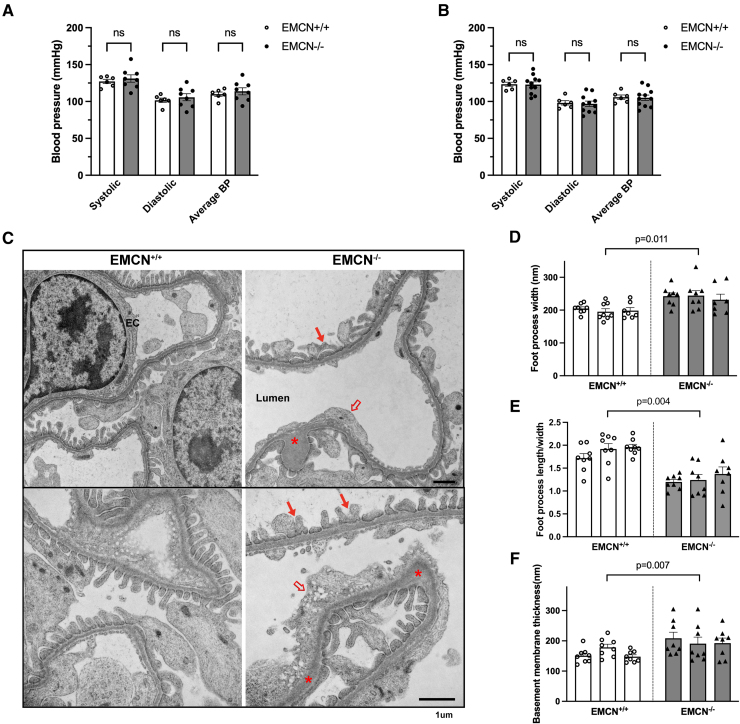
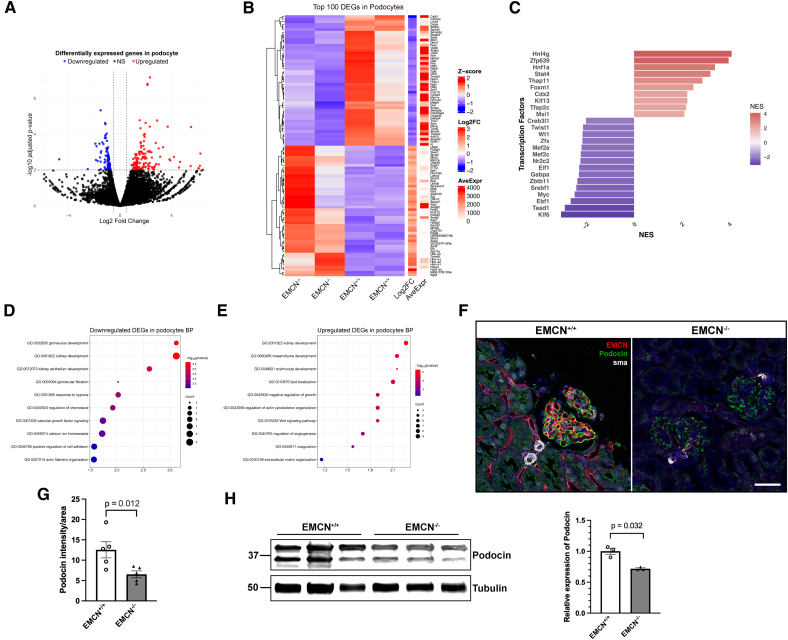
Results: The EMCN-/- mice exhibited increased infiltration of CD45+ cells, with an increased proportion of Ly6GhighLy6Chigh myeloid cells and higher VCAM-1 (vascular cell adhesion molecule 1) expression. EMCN-/- mice displayed albuminuria with increased albumin in the Bowman's space compared with the EMCN+/+ littermates. Glomeruli in EMCN-/- mice revealed fused and effaced podocyte foot processes and disorganized endothelial fenestrations. We found no significant difference in blood pressure between EMCN knockout mice and their wild-type littermates. RNA sequencing of glomerular endothelial cells revealed downregulation of cell-cell adhesion and MAPK (mitogen-activated protein kinase)/ERK (extracellular signal-regulated kinase) pathways, along with glycocalyx and extracellular matrix remodeling. In podocytes, we observed reduced VEGF signaling and alterations in cytoskeletal organization. Notably, there was a significant decrease in both mRNA and protein levels of podocin, a key component of the slit diaphragm.

Conclusion: Our study demonstrates a critical role of the endothelial marker EMCN in supporting normal glomerular filtration barrier structure and function by maintaining glomerular endothelial tight junction and homeostasis and podocyte function through endothelial-podocyte crosstalk.

Keywords: endothelium; glomerular filtration barrier; glycocalyx; inflammation; mice; podocytes.


Conflict of interest statement

None.

Figures

Figure 1.
Figure 1.
Generation of EMCN (endomucin) global knockout mice and confirmation of EMCN deletion. A, EMCN-floxed allele and EMCN deletion allele were generated as shown. The open reading frame (ORF) of EMCN was targeted and floxed by loxP (locus of x-over P1) and lox2272 sites with an EGFP (enhanced green fluorescent protein) tag. After Cre recombination, the majority region of EMCN ORF from exon 2 to exon 11 was deleted, the EGFP sequence was flipped, and the resulting expression reflected EMCN deletion. B, Kidney, lung, thyroid gland, spleen, small intestine, and liver tissues were collected from EMCN+/+, EMCN+/−, and EMCN−/− mice, and mRNA was extracted and examined for EMCN expression. EMCN mRNA was not detected in EMCN−/− tissues. n=6, 1-way ANOVA with Tukey post hoc test for multiple comparisons. C, Total protein was extracted from kidney, lung, and thyroid gland from EMCN+/+, EMCN+/−, and EMCN−/− mice. Protein concentration was quantified using the BCA protein assay kit and loaded onto an SDS-PAGE gel. Levels of EMCN, tubulin, and β-actin were examined by Western blot. n=3. D, Kidneys from EMCN+/+, EMCN+/−, and EMCN−/− mice were collected and fixed with 10% formalin overnight for paraffin sectioning. Immunohistochemical staining was performed to visualize EMCN, EGFP, and CD31 (cluster of differentiation 31); nuclei were stained with DAPI (4′,6-diamidino-2-phenylindole). n=6. Scale bar=100 µm. Frt indicates flippase recognition target; and ND, not detected.
Figure 2.
Figure 2.
Increased CD45+ cell infiltration in kidney of EMCN (endomucin)−/− mice. A, Kidneys from EMCN+/+, EMCN+/−, and EMCN−/− mice were collected and fixed with 10% formalin overnight for paraffin sectioning. Immunohistochemical staining was performed to visualize CD45 (cluster of differentiation 45) and CD34; nuclei were stained with DAPI (4′,6-diamidino-2-phenylindole). n=4. Scale bar=20 µm. B, Quantification of CD45+ cells in kidney sections. n=4, 4 sections from each animal were included for the quantification. EMCN+/+ vs EMCN−/−, P=0.008, EMCN+/− vs EMCN−/−, P=0.001, aligned rank transform ANOVA with post hoc Holm test. C, mRNA from kidneys from EMCN+/+, EMCN+/−, and EMCN−/− mice was extracted and examined for E-selectin, VCAM-1 (vascular cell adhesion molecule 1), and ICAM-1 (intercellular adhesion molecule 1) expression. n=4, EMCN+/+ vs EMCN−/−, P=0.014, EMCN+/− vs EMCN−/−, P=0.024, Kruskal-Wallis test with Dunn test for multiple comparisons.
Figure 3.
Figure 3.
Increased CD11b+Ly6GloLy6Chi cells in kidneys of EMCN (endomucin)−/− mice. A, Representative images of flow cytometry of kidney cells isolated from EMCN+/+ and EMCN−/− mice. Percentage of (B) CD45+ (cluster of differentiation 45) cells, P=0.034, unpaired Student t test. C, CD11b+Ly6GhiLy6Chi cells and (D) CD11b+Ly6GloLy6Chi cells, P=0.031, unpaired Student t test. E, CD45+CD3+ cells, (F) CD45+CD19+, and (G) CD144+ endothelial cells. n=10. FSC indicates forward scatter; and ns, nonsignificant.
Figure 4.
Figure 4.
Histology of kidneys from EMCN (endomucin)+/+ and EMCN−/− mice, and increased collagen staining in kidneys from EMCN−/− mice. A and B, Representative gross morphology images of kidneys and hematoxylin and eosin (H&E)–stained kidney coronal sections across the renal pelvis from EMCN+/+ and EMCN−/− mice. n=3, Scale bar=1 mm. C, Representative images of kidney sections with H&E staining (top) and Trichrome staining (bottom) from EMCN+/+ and EMCN−/− mice for morphometric analysis. n=3, Scale bar=20 µm. D, Glomeruli number and (E) glomeruli areas were quantified using ImageJ on H&E-stained kidney sections from EMCN+/+ and EMCN−/− mice. n=4,* P=0.0286, Mann-Whitney U test. F, Collagen staining intensity (blue color from Trichrome staining in C) per glomeruli area was quantified using ImageJ. n=4,* P=0.0093, Mann-Whitney U test. ns indicates nonsignificant.
Figure 5.
Figure 5.
Increased albumin in urine and Bowman’s space in kidneys of EMCN (endomucin)−/− mice. Urine samples were collected from EMCN+/+ and EMCN−/− mice as described in the Methods section. A, Two microliters of each urine sample was loaded on SDS-PAGE gel with mouse serum as a control and stained with Coomassie Blue. Putative albumin band and major urinary protein bands were indicated as shown. B through D, Mouse urine creatinine and albumin concentrations were quantified by ELISA, and urine creatinine concentration, urine protein/creatinine, and urine albumin/creatinine levels from EMCN+/+ and EMCN−/− mice were compared. n=5, P=0.0079, Mann-Whitney U test. E, Representative image of Western blot examining the albumin expression level in 1 µL of freshly collected urine samples from EMCN+/+ and EMCN−/− mice. F, Quantification of albumin band intensity on Western blot of urine samples from EMCN+/+ and EMCN−/− mice. n=5, P=0.0278, Mann-Whitney U test. G, Representative images of immunohistochemical staining to visualize the expression of EMCN, albumin, and CD34 in kidney sections from EMCN+/+ and EMCN−/− mice; nuclei were stained with DAPI (4′,6-diamidino-2-phenylindole). n=4, Scale bar=20 µm.
Figure 6.
Figure 6.
Defective glomerular ultrastructure in kidneys from EMCN (endomucin)−/− mice. A, Systolic, diastolic, and average blood pressure (BP) measured by a noninvasive tail-cuff BP system in female littermates and (B) male littermates. n=6, 8 for female, n=6, 11 for male. P>0.05, Welch t test. C, Representative transmission electron microscopy images of the glomerular filtration barrier (fenestrated endothelium, basement membrane, and podocytes) showing lower magnification (top) and higher magnification (bottom) from EMCN+/+ (left) and EMCN−/− (right) mice. Red arrows point to the effaced and fused podocytes, red hollow arrows point to the disorganized fenestration of the endothelium, and red asterisks mark the thickening of the basement membrane in the EMCN−/− mice. n=4, Scale bar=1 µm. D, Width of podocyte foot processes, P=0.011. E, Length/width ratio of podocyte foot process, P=0.004, and (F) basement membrane thickness, P=0.007, aligned rank transform ANOVA with post hoc Holm test for D–F, 7–8 images were quantified in a masked fashion from 3 sets of EMCN+/+ and EMCN−/− samples by ImageJ software. n=3. ns indicates nonsignificant.
Figure 7.
Figure 7.
Kidney endothelial cells (ECs) RNA sequencing and differential expressed genes analysis. A, Schematic of the workflow for glomeruli isolation from the kidney followed by fluorescence-activated cell sorting (FACS) of EC and podocyte populations for downstream RNA sequencing. n=2. B, Representative flow cytometry plot illustrating the gating strategy used to identify and sort live ECs and podocytes. C, Volcano map of differentially expressed genes (DEGs) in ECs, except EMCN (endomucin), in EMCN−/− kidney endothelium compared with EMCN+/+. P<0.01 with |log2FC| >0.5 is considered as significantly expressed genes. Blue and red dots indicated downregulated and upregulated genes in EMCN−/− kidney endothelium respectively. D, Heat map of the top DEGs with base mean >50 in EMCN−/− kidney endothelium compared with EMCN+/+. E, Gene ontology (GO) biological process analysis of downregulated genes and (F) upregulated genes in EMCN−/− kidney endothelium compared with EMCN+/+. G, DoRothEA regulons analysis of transcription factor from DEGs in EMCN−/− kidney endothelium compared with EMCN+/+. AveExpr indicates average expression; BP, blood pressure; CD, cluster of differentiation; ERK, extracellular signal–regulated kinase; FC, fold change; FSC-H, forward scatter height; MAPK, mitogen-activated protein kinase; NES, normalized enrichment score; ns, nonsignificant; and SSC-A, side scatter area.
Figure 8.
Figure 8.
Kidney podocyte RNA sequencing with differentially expressed genes (DEGs) analysis and schematic illustration of changes in EMCN (endomucin) knockout mice. A, Volcano map of DEGs in podocytes in EMCN−/− kidney endothelium compared with EMCN+/+. P<0.01 with |log2FC| >0.5 is considered as significantly expressed genes. Blue and red dots indicate downregulated and upregulated genes in EMCN−/− kidney podocytes, respectively. B, Heat map of top 100 DEGs with basemean >50 in EMCN−/− kidney podocytes compared with EMCN+/+. C, DoRothEA (discriminant regulon expression analysis) regulons analysis of transcription factor from DEGs in EMCN−/− kidney podocytes compared with EMCN+/+. D, Gene ontology (GO) biological process analysis of downregulated genes and (E) upregulated genes in EMCN−/− kidney podocytes compared with EMCN+/+. F, Immunohistochemical staining was performed to visualize the expression of EMCN, podocin, and smooth muscle actin. Nuclei were stained with DAPI (4′,6-diamidino-2-phenylindole). n=3, Scale bar=50 µm. G, Podocin intensity per glomeruli area was quantified using ImageJ software. n=5,* P=0.012, Mann-Whitney U test. H, Kidney protein samples were collected from EMCN+/+ and EMCN−/− mice and quantified by BCA protein assay kit. Levels of podocin and tubulin were examined by Western blot analysis. Band intensities of podocin from Western blot were quantified by ImageJ software and normalized to tubulin. Relative podocin expression is calculated as podocin band intensity/tubulin band intensity relative to average podocin band intensity/tubulin band intensity in EMCN+/+. n=3,* P=0.032, Mann-Whitney U test. AveExpr indicates average expression; BP, blood pressure; FC, fold change; NES, normalized enrichment score; and sma, smooth muscle actin.

Comment in

Similar articles

Cited by

References

    1. Weinbaum S, Tarbell JM, Damiano ER. The structure and function of the endothelial glycocalyx layer. Annu Rev Biomed Eng. 2007;9:121–167. doi: 10.1146/annurev.bioeng.9.060906.151959 - PubMed
    1. Reitsma S, Slaaf DW, Vink H, van Zandvoort MAMJ, oude Egbrink MGA. The endothelial glycocalyx: composition, functions, and visualization. Pflugers Arch. 2007;454:345–359. doi: 10.1007/s00424-007-0212-8 - PMC - PubMed
    1. Constantinescu AA, Vink H, Spaan JA. Endothelial cell glycocalyx modulates immobilization of leukocytes at the endothelial surface. Arterioscler Thromb Vasc Biol. 2003;23:1541–1547. doi: 10.1161/01.ATV.0000085630.24353.3D - PubMed
    1. Moore KH, Murphy HA, George EM. The glycocalyx: a central regulator of vascular function. Am J Physiol Regul Integr Comp Physiol. 2021;320:R508–R518. doi: 10.1152/ajpregu.00340.2020 - PMC - PubMed
    1. Mitra R, O’Neil GL, Harding IC, Cheng MJ, Mensah SA, Ebong EE. Glycocalyx in atherosclerosis-relevant endothelium function and as a therapeutic target. Curr Atheroscler Rep. 2017;19:63. doi: 10.1007/s11883-017-0691-9 - PMC - PubMed