. 2024 Nov 6;16(6):1355-1384.
doi: 10.3390/neurolint16060103.

Differential Effects of Extracellular Vesicles from Two Different Glioblastomas on Normal Human Brain Cells

Affiliations

Differential Effects of Extracellular Vesicles from Two Different Glioblastomas on Normal Human Brain Cells

Mary Wang et al. Neurol Int. .

Abstract

Background/Objectives: Glioblastomas (GBMs) are dreadful brain tumors with abysmal survival outcomes. GBM extracellular vesicles (EVs) dramatically affect normal brain cells (largely astrocytes) constituting the tumor microenvironment (TME). We asked if EVs from different GBM patient-derived spheroid lines would differentially alter recipient brain cell phenotypes. This turned out to be the case, with the net outcome of treatment with GBM EVs nonetheless converging on increased tumorigenicity. Methods: GBM spheroids and brain slices were derived from neurosurgical patient tissues following informed consent. Astrocytes were commercially obtained. EVs were isolated from conditioned culture media by ultrafiltration, concentration, and ultracentrifugation. EVs were characterized by nanoparticle tracking analysis, electron microscopy, biochemical markers, and proteomics. Astrocytes/brain tissues were treated with GBM EVs before downstream analyses. Results: EVs from different GBMs induced brain cells to alter secretomes with pro-inflammatory or TME-modifying (proteolytic) effects. Astrocyte responses ranged from anti-viral gene/protein expression and cytokine release to altered extracellular signal-regulated protein kinase (ERK1/2) signaling pathways, and conditioned media from EV-treated cells increased GBM cell proliferation. Conclusions: Astrocytes/brain slices treated with different GBM EVs underwent non-identical changes in various omics readouts and other assays, indicating "personalized" tumor-specific GBM EV effects on the TME. This raises concern regarding reliance on "model" systems as a sole basis for translational direction. Nonetheless, net downstream impacts from differential cellular and TME effects still led to increased tumorigenic capacities for the different GBMs.

Keywords: astrocytes; extracellular vesicles; glioblastoma; innate immunity; protease; proteomics; signaling; transcriptomics.


Conflict of interest statement

The authors declare no conflicts of interest. The funders had no role in the design of the study; in the collection, analyses, or interpretation of data; in the writing of the manuscript; or in the decision to publish the results.

Figures

Figure 1
Figure 1
Proteomes of astrocytes treated with GBM F3-8 EVs or GBM G17-1 EVs. Data were generated in Metaboanalyst 5.0. (A,B) volcano plots, showing significantly differential proteomes between astrocytes treated with GBM EVs (upper-right quadrants, red dots) or control treatments (PBS, upper-left quadrants, blue dots). (A) Astrocytes treated with F3-8 EVs; (B) astrocytes treated with G17- EVs. (C,D) Hierarchical clustering heatmaps from ANOVA statistical analyses utilized normalized data that were standardized by autoscaling features (top 100) with Euclidean distance measurements and clustered by ward. (C) Astrocytes treated with F3-8 EVs; (D) astrocytes treated with G17-1 EVs.
Figure 2
Figure 2
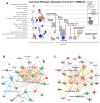
Ingenuity Pathway Analysis (IPA) highlights of astrocytes proteomes following treatment (“tx’d”) with F3-8 GBM EVs: Canonical Pathways and relevant networks. (A) “Bubble chart” of significant Canonical Pathways (based on −log(p-values)) derived from the proteome of astrocytes treated with GBM F3-8 EVs; broad categories are on the y-axis, and more specific categories are designated in the bubbles (higher scoring categories are denoted). Bubble sizes and color scheme are in the inset. (B) Relevant interactome shown for F3-8 EV-treated astrocytes (Network 4—Cardiovascular Disease; Infectious Disease; Organismal Injury and Abnormalities. Score = 44, 26 Focus Molecules). (C) Relevant interactome shown for F3-8 EV-treated astrocytes (Network 7—Antimicrobial Response; Immunological Disease; Inflammatory Response. Score = 33, 21 Focus Molecules). “Scores” are based on Fisher’s exact test, −log(p-value); “Focus Molecules” are considered focal point generators within the network. The number of genes illustrated is limited to 35 by the algorithm. IPA network legends (node and path design shapes, edges, and their descriptions) are in Supplementary Figure S7.
Figure 3
Figure 3
IPA highlights of astrocytes proteomes following treatment (“tx’d”) with G17-1 GBM EVs: Canonical Pathways and relevant networks. (A) “Bubble chart” of significant Canonical Pathways derived from the proteome of astrocytes treated with GBM G17-1 EVs (as described in Figure 2A). (B) Relevant interactome shown for G17-1 EV-treated astrocytes (Network 4—Hereditary Disorder, Ophthalmic Disease, Organismal Injury and Abnormalities. Score = 32, 18 Focus Molecules). (C) Relevant interactome shown for G17-1 EV-treated astrocytes (Network 6—Neurological Disease, Organismal Injury and Abnormalities, Skeletal and Muscular Disorders. Score = 30, 17 Focus Molecules). “Scores” are based on Fisher’s exact test, -log(p-value); “Focus Molecules” are considered focal point generators within the network. Number of genes illustrated is limited to 35 by the algorithm. IPA network legends (node and path design shapes, edges, and their descriptions) are in Supplementary Figure S7.
Figure 4
Figure 4
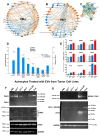
GBM F3-8 EVs induce an anti-viral-like response along with increased GFAP expression in recipient astrocytes. (A) Astrocyte transcriptomic analysis (IPA) following treatment with GBM F3-8 EVs and (B) proteomic analysis show RIG-I/DDX58 as the central nodes in the Graphical Summary (shown in the radial layout). (C) STRING analysis of top 10 most highly over-expressed mRNAs in the astrocyte transcriptome following F3-8 EV treatment. (D) Top FunRich Biologic Pathways deduced from the astrocyte transcriptome following F3-8 EV treatment. (E) Following treatment with F3-8 EVs, astrocyte supernatants were collected and subjected to ELISA analysis for type I-III interferons and other cyto/chemokines (PBL Assay Science VeriPlex Human Interferon 9-Plex ELISA kit). Gray bars = astrocytes (normal human astrocytes, NHAs) alone; blue bars = astrocytes treated with EVs from normal human epithelial cell (epi) EVs; red bars = astrocytes treated with F3-8 EVs. * p < 0.05 compared to astrocytes alone; ** p < 0.01 vs. astrocytes alone; *** p < 0.005 vs. astrocytes alone; **** p < 0.0001 vs. astrocytes alone. For epi EV-treated astrocytes, IL6, ** p < 0.01 vs. F3-8 EV-treated astrocytes. One-way ANOVA followed by Tukey’s pairwise multiple comparisons. (F) Western blot validation of innate immune/RNA sensors, GFAP, and (G) IFN-induced molecules, and EVs from cell lines shown (or PBS as control) were incubated with astrocytes for 24 h; cells were lysed, separated on SDS-PAGE, transferred to nitrocellulose, blocked and probed with antibodies against proteins listed, followed by washing and probes with secondary antibodies. That was followed by washing and chemiluminescent development. Molecular weight markers are as indicated. GAPDH was probed to verify comparable loading. Blots are shown as they appear in the FluorChem Q imager. “F3-8 MV” astrocytes were treated with the same protein concentration of “microvesicles” derived from the F3-8 line (see Supplementary Figure S1 for isolation details). M2-7 = adult (metastatic) embryonal rhabdomyosarcoma (recurrent; had prior radiation). M6-7 = Grade 4 astrocytoma, IDH mutant (recurrent; had prior radiation).
Figure 5
Figure 5
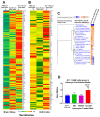
Brain slice and astrocyte secretomes following cell tissue and cell treatment with GBM G17-1 EVs. (A) Normal human brain slices were treated with PBS, normal epithelial cell EVs, or GBM G17-1 EVs. Conditioned media supernatants were subjected to Proteome Profiler Human XL Cytokine Arrays (ARY022B; R&D Systems). Spots were quantified by densitometry, averaged, and normalized to tissue weight. Results are displayed as heatmaps. (B) Astrocytes were treated with PBS, astrocyte EVs, or GBM G17-1 EVs. Conditioned media supernatants were subjected to Proteome Profiler Human XL Cytokine Arrays (ARY022B; R&D Systems). Spots were quantified by densitometry, duplicates averaged, and spots normalized to cell count. Results are displayed as heatmaps. (C) Using IPA Comparison Analysis, changes in cyto/chemokine expression of brain slices vs. astrocytes (treated with G17-1 EVs) were categorized by Canonical Pathways, as analyzed by hierarchical clustering by z-score. The top 25 Canonical Pathways compared by heatmaps are shown. (D) Astrocytes were treated with PBS, with EVs from HEK293 cells, or with G17-1 EVs. The conditioned media were transferred to G17-1 cells grown in the same ABM medium, and cell proliferation was measured by MTS assay 24 h later.
Figure 6
Figure 6
Brain slice and astrocyte secretomes following tissue and cell treatment with GBM G17-1 EVs implicate ERK1/2 signaling. (A) IPA network analysis of the secretome of brain slices treated with GBM G17-1 EVs identified a network with ERK1/2 signaling as the major node when presented in radial layout: “Cell Death and Survival; Cell Development; Inflammatory Response”. Score = 18, 10 Focus Molecules. (B) IPA network analysis of the secretome of astrocytes treated with G17-1 EVs identified a network with ERK1/2 signaling as the major node when presented in radial layout: “Cardiovascular System Development and Function; Hematological System Development and Function; Inflammatory Response”. Score = 18, 11 Focus Molecules. Score and Focus Molecule definitions are the same as in Figure 2 and Figure 3 (see also Supplementary Figure S7). (C) Equal numbers of astrocytes were left untreated, or were treated with the ERK1/2 inhibitor SCH772984 (1 mM) for 4 h, and then ± G17-1 EVs for 24 h. Astrocytes were lysed, and lysates subjected to a Creative Biolabs Human Phospho-Kinase Antibody Array (AbAr-0225-YC). Spots were quantified by densitometry and duplicates averaged, and values were represented by heatmaps. (D) Astrocyte culture supernatants (from cells treated as in (C)) were subjected to the same ELISA as in Figure 4E; only TNFA and IL6 results are shown, along with a POSTN ELISA (ELH-POSTN; RayBiotech). For TNFA, **** p < 0.0001 G17-1 EVs vs. G17-1 EVs and ERKi; vs. PBS; vs. PBS and ERKi. AA p = 0.0078 G17-1 EVs and ERKi vs. PBS and ERKi. CCCC p < 0.001 PBS vs. PBS and ERKi. For IL6, **** p < 0.0001 G17-1 EVs and ERKi vs. G17-1 EVs; vs. PBS; vs. PBS and ERKi. @@ p = 0.0012 PBS and ERKi vs. G17-1 EVs. For POSTN, ** p < 0.003 G17-1 EVs vs. PBS; vs. PBS and ERKi; * p < 0.05 G17-1 EVs vs. G17-1 EVs and ERKi. ANOVA followed by Tukey’s pairwise multiple comparisons.
Figure 7
Figure 7
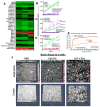
Proteases and activities in GBM EVs and astrocyte or brain-slice-conditioned media following GBM EV treatment. (A) Equal numbers of astrocytes were treated with PBS, GBM F3-8 EVs, or GBM G17-1 EVs for 24 h. Conditioned media supernatants were collected and used to probe Proteome Profiler Human Protease Arrays (#ARY021B; R&D Systems). Spots were quantified by densitometry and duplicates averaged, and values were represented by heatmaps. (B) Collagenase/MMP activity was measured by abcam MMP Activity Assay Kits (Cat # ab112146); astrocytes were treated with the tumor EVs listed (PBS as a control; F3-8, G17-1, M16-8, M6-7) for 24 h. Conditioned media were harvested, and assayed over a 1 h period; **** p < 0.0001 G17-1 EV treatment vs. all others. (C) Collagenase/MMP activity of PBS only (blue line), astrocyte-conditioned medium following PBS treatment (red line), G17-1 EVs only (green line, same concentration as used in astrocyte treatment), or astrocyte-conditioned medium following G17-1 EV treatment (purple line). **** p < 0.0001 G17-1 EV treatment of astrocytes vs. either PBS; *** p < 0.001 G17-1 EVs alone vs. either PBS; ** p < 0.01 G17-1 EV treatment of astrocytes vs. G17-1 EVs alone. (D) Collagenase/MMP activity of PBS only (blue line), astrocyte-conditioned medium following PBS treatment (red line), F3-8 EVs only (green line, same concentration as used in astrocyte treatment), or astrocyte-conditioned medium following F3-8 EV treatment (purple line). **** p < 0.0001 F3-8 EVs only vs. all others. ANOVA followed by Tukey’s pairwise multiple comparisons. E: Brain slices were treated G17-1 EVs (red line), epithelial cell EVs (blue line), or PBS (gray line) for 24 h. Brain-slice-conditioned media were assayed in a gelatinase assay (EnzChek™ Gelatinase/Collagenase Assay Kit; cat # E12055; ThermoFisher) over 14 h. G17-1 EV gelatinase activity was measured directly (orange line, same concentration as used in astrocyte treatment) over the same period. (F) Brain slices were treated as in (E) and were imaged in two-photon excitation microscopy through 10 μm depths to reveal matrix degradation (G17-1 EV treatment panels, right side). Top row = representative single plane, multiple deep focal plane imaging, 2-D maximum intensity projection image size = 1024 × 1024 pixel resolution; bottom row = axial scanning reconstructed Z-stack series, 3-D Intensity projection (XY image size x: 1024, y: 1024, Z: 33, 8-bit) was reconstructed from the Z-stack (sample (x: 353.90 μm, y: 353.90 μm, z: 10.65 μm, 33 slides).

References

    1. Wirsching H.G., Galanis E., Weller M. Glioblastoma. Handb. Clin. Neurol. 2016;134:381–397. - PubMed
    1. Lukas R.V., Wainwright D.A., Ladomersky E., Sachdev S., Sonabend A.M., Stupp R. Newly Diagnosed Glioblastoma: A Review on Clinical Management. Oncology. 2019;33:91–100. - PMC - PubMed
    1. Ostrom Q.T., Cioffi G., Waite K., Kruchko C., Barnholtz-Sloan J.S. Cbtrus Statistical Report: Primary Brain and Other Central Nervous System Tumors Diagnosed in the United States in 2014–2018. Neuro. Oncol. 2021;23:iii1–iii105. doi: 10.1093/neuonc/noab200. - DOI - PMC - PubMed
    1. Cruz J.V.R., Batista C., Afonso B.H., Alexandre-Moreira M.S., Dubois L.G., Pontes B., Neto V.M., Mendes F.A. Obstacles to Glioblastoma Treatment Two Decades after Temozolomide. Cancers. 2022;14:3203. doi: 10.3390/cancers14133203. - DOI - PMC - PubMed
    1. Farrell C., Shi W., Bodman A., Olson J.J. Congress of Neurological Surgeons Systematic Review and Evidence-Based Guidelines Update on the Role of Emerging Developments in the Management of Newly Diagnosed Glioblastoma. J. Neurooncol. 2020;150:269–359. doi: 10.1007/s11060-020-03607-4. - DOI - PubMed

LinkOut - more resources